Baseline characteristics
In the health screening conducted in 2009, 10,490,491 subjects were older than 20 years. Among them, 1,037,063 did not meet the eGFR or proteinuria criterion, 510,925 had missing data, and 3,304,183 were not examined in 2015. A total of 5,638,320 subjects was selected as the study population (10,490,491 − 1,037,063 − 510,925 − 3,304,183 = 5,638,320) (
Fig. 1).
Fig. 1
Selection of the study population.
NHIS = National Health Insurance Service, eGFR = estimated glomerular filtration rate.


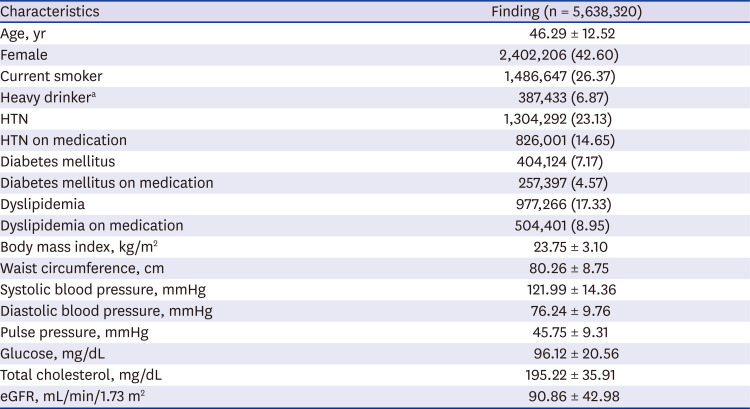
The baseline characteristics for the 5,638,320 subjects at the beginning of the study were as follows: mean age, 46.29 ± 12.52 years; female, 42.60%; smoker, 26.37%; HTN prevalence, 23.13%; DM prevalence, 7.17%; mean BP, (121.99 ± 14.36)/(76.24 ± 9.76) mmHg; and eGFR, 90.86 ± 42.98 mL/min/1.73 m
2. Other baseline characteristics are presented in
Table 1.
Table 1
Baseline characteristics
|
Characteristics |
Finding (n = 5,638,320) |
|
Age, yr |
46.29 ± 12.52 |
|
Female |
2,402,206 (42.60) |
|
Current smoker |
1,486,647 (26.37) |
|
Heavy drinkera
|
387,433 (6.87) |
|
HTN |
1,304,292 (23.13) |
|
HTN on medication |
826,001 (14.65) |
|
Diabetes mellitus |
404,124 (7.17) |
|
Diabetes mellitus on medication |
257,397 (4.57) |
|
Dyslipidemia |
977,266 (17.33) |
|
Dyslipidemia on medication |
504,401 (8.95) |
|
Body mass index, kg/m2
|
23.75 ± 3.10 |
|
Waist circumference, cm |
80.26 ± 8.75 |
|
Systolic blood pressure, mmHg |
121.99 ± 14.36 |
|
Diastolic blood pressure, mmHg |
76.24 ± 9.76 |
|
Pulse pressure, mmHg |
45.75 ± 9.31 |
|
Glucose, mg/dL |
96.12 ± 20.56 |
|
Total cholesterol, mg/dL |
195.22 ± 35.91 |
|
eGFR, mL/min/1.73 m2
|
90.86 ± 42.98 |

Comparison between IRF and NRF groups
After 6 years of study, 161,044 (2.86%) of the original subjects had IRF (
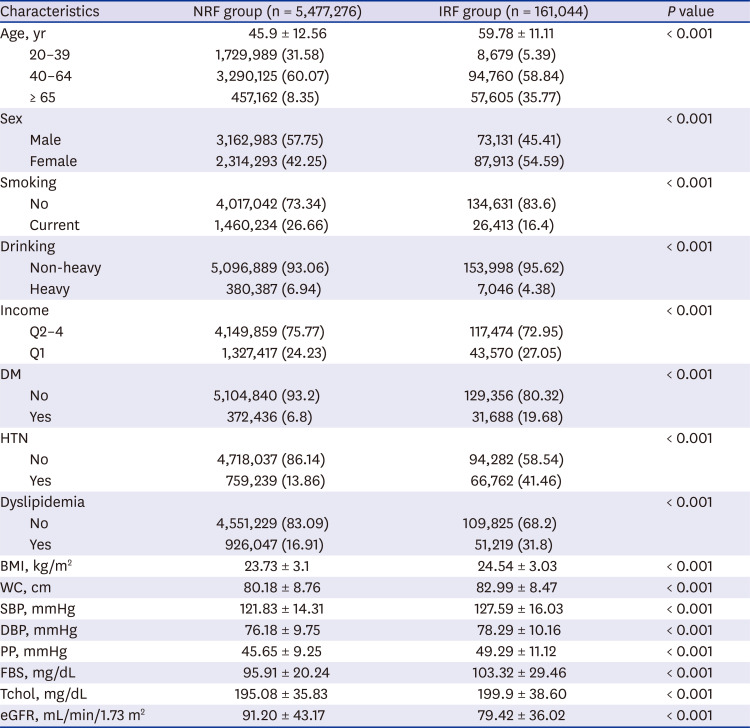
Fig. 2). All subjects were divided into IRF and NRF groups, and the clinical factors at baseline were compared between two groups (
Table 2). The IRF group showed larger proportions of both elderly (65 years or older) and female compared with the NRF group (
P < 0.001), and the prevalence of HTN, DM, and dyslipidemia was also higher (
P < 0.001). In addition, eGFR was lower in the IRF group than in the NRF group (79.42 ± 36.02 mL/min/1.73 m
2 vs. 91.2 ± 43.17 mL/min/1.73 m
2,
P < 0.001), and smoker and over-drinker proportions were lower (smoker, 16.4% vs. 26.66%,
P < 0.001; over-drinker, 4.38% vs. 6.94%,
P < 0.001). Values for SBP, DBP, and PP were compared between the two groups without considering whether an antihypertensive drug has been administered, and the IRF group had higher SBP, DBP, and PP compared with the NRF group (
P < 0.001).
Fig. 2
IRF incidence in 2015 after 6-years of follow-up.
IRF = impaired renal function, NRF = normal renal function.
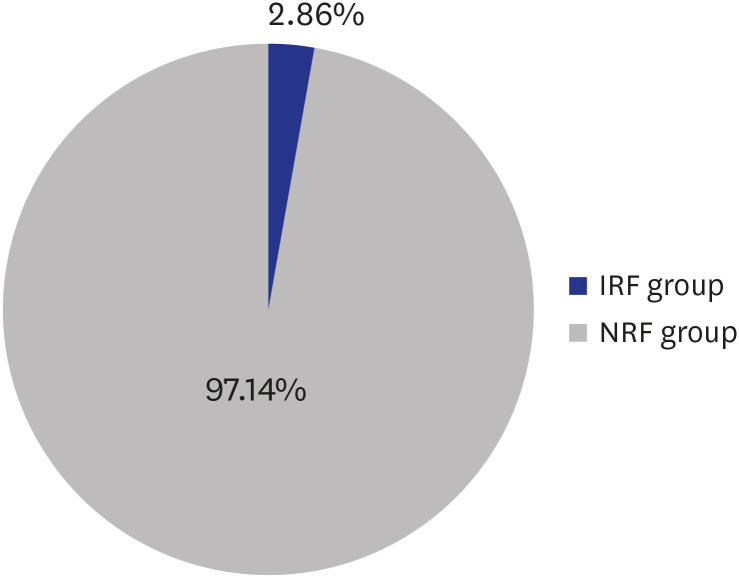

Table 2
Comparison between IRF and NRF groups
|
Characteristics |
NRF group (n = 5,477,276) |
IRF group (n = 161,044) |
P value |
|
Age, yr |
45.9 ± 12.56 |
59.78 ± 11.11 |
< 0.001 |
|
20–39 |
1,729,989 (31.58) |
8,679 (5.39) |
|
40–64 |
3,290,125 (60.07) |
94,760 (58.84) |
|
≥ 65 |
457,162 (8.35) |
57,605 (35.77) |
|
Sex |
|
|
< 0.001 |
|
Male |
3,162,983 (57.75) |
73,131 (45.41) |
|
Female |
2,314,293 (42.25) |
87,913 (54.59) |
|
Smoking |
|
|
< 0.001 |
|
No |
4,017,042 (73.34) |
134,631 (83.6) |
|
Current |
1,460,234 (26.66) |
26,413 (16.4) |
|
Drinking |
|
|
< 0.001 |
|
Non-heavy |
5,096,889 (93.06) |
153,998 (95.62) |
|
Heavy |
380,387 (6.94) |
7,046 (4.38) |
|
Income |
|
|
< 0.001 |
|
Q2–4 |
4,149,859 (75.77) |
117,474 (72.95) |
|
Q1 |
1,327,417 (24.23) |
43,570 (27.05) |
|
DM |
|
|
< 0.001 |
|
No |
5,104,840 (93.2) |
129,356 (80.32) |
|
Yes |
372,436 (6.8) |
31,688 (19.68) |
|
HTN |
|
|
< 0.001 |
|
No |
4,718,037 (86.14) |
94,282 (58.54) |
|
Yes |
759,239 (13.86) |
66,762 (41.46) |
|
Dyslipidemia |
|
|
< 0.001 |
|
No |
4,551,229 (83.09) |
109,825 (68.2) |
|
Yes |
926,047 (16.91) |
51,219 (31.8) |
|
BMI, kg/m2
|
23.73 ± 3.1 |
24.54 ± 3.03 |
< 0.001 |
|
WC, cm |
80.18 ± 8.76 |
82.99 ± 8.47 |
< 0.001 |
|
SBP, mmHg |
121.83 ± 14.31 |
127.59 ± 16.03 |
< 0.001 |
|
DBP, mmHg |
76.18 ± 9.75 |
78.29 ± 10.16 |
< 0.001 |
|
PP, mmHg |
45.65 ± 9.25 |
49.29 ± 11.12 |
< 0.001 |
|
FBS, mg/dL |
95.91 ± 20.24 |
103.32 ± 29.46 |
< 0.001 |
|
Tchol, mg/dL |
195.08 ± 35.83 |
199.9 ± 38.60 |
< 0.001 |
|
eGFR, mL/min/1.73 m2
|
91.20 ± 43.17 |
79.42 ± 36.02 |
< 0.001 |

Renal progression according to BP
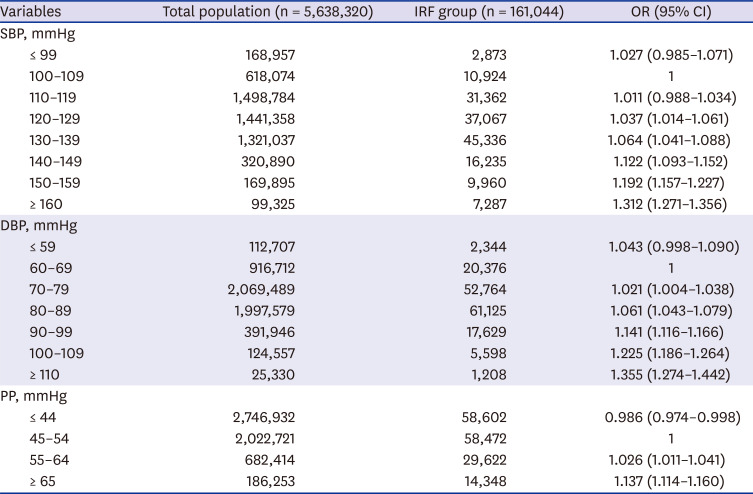
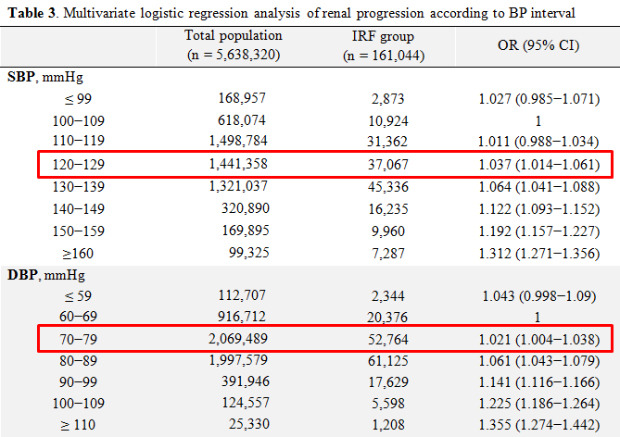
To investigate the effects of SBP, DBP, and PP on occurrence of IRF, the three pressures were divided into 8, 7, and 4 categories, respectively (
Table 3). Adjustments were made for 11 confounding variables of age, sex, smoking, drinking, exercise, income, BMI, DM, HTN, dyslipidemia, and eGFR. The reference intervals were set as 100–109 mmHg for SBP, 60–69 mmHg for DBP, and 45–54 mmHg for PP, and the ORs of IRF occurrence at each BP category were calculated.
Table 3
Multivariate logistic regression analysis of renal progression according to blood pressure interval
|
Variables |
Total population (n = 5,638,320) |
IRF group (n = 161,044) |
OR (95% CI) |
|
SBP, mmHg |
|
|
|
|
≤ 99 |
168,957 |
2,873 |
1.027 (0.985–1.071) |
|
100–109 |
618,074 |
10,924 |
1 |
|
110–119 |
1,498,784 |
31,362 |
1.011 (0.988–1.034) |
|
120–129 |
1,441,358 |
37,067 |
1.037 (1.014–1.061) |
|
130–139 |
1,321,037 |
45,336 |
1.064 (1.041–1.088) |
|
140–149 |
320,890 |
16,235 |
1.122 (1.093–1.152) |
|
150–159 |
169,895 |
9,960 |
1.192 (1.157–1.227) |
|
≥ 160 |
99,325 |
7,287 |
1.312 (1.271–1.356) |
|
DBP, mmHg |
|
|
|
|
≤ 59 |
112,707 |
2,344 |
1.043 (0.998–1.090) |
|
60–69 |
916,712 |
20,376 |
1 |
|
70–79 |
2,069,489 |
52,764 |
1.021 (1.004–1.038) |
|
80–89 |
1,997,579 |
61,125 |
1.061 (1.043–1.079) |
|
90–99 |
391,946 |
17,629 |
1.141 (1.116–1.166) |
|
100–109 |
124,557 |
5,598 |
1.225 (1.186–1.264) |
|
≥ 110 |
25,330 |
1,208 |
1.355 (1.274–1.442) |
|
PP, mmHg |
|
|
|
|
≤ 44 |
2,746,932 |
58,602 |
0.986 (0.974–0.998) |
|
45–54 |
2,022,721 |
58,472 |
1 |
|
55–64 |
682,414 |
29,622 |
1.026 (1.011–1.041) |
|
≥ 65 |
186,253 |
14,348 |
1.137 (1.114–1.160) |

The OR of IRF occurrence according to SBP was not statistically different in either the ≤ 99 mmHg interval or the 110–119 mmHg interval compared with the reference interval of 100–109 mmHg. The OR was statistically significant (OR, 1.037; 95% CI, 1.014–1.061) from the 120–129 mmHg interval, and as SBP increased, the OR increased (130–139 mmHg, OR, 1.064, 95% CI, 1.041–1.088; 140–149 mmHg, OR, 1.122, 95% CI, 1.093–1.152; 150–159 mmHg, OR, 1.192, 95% CI, 1.157–1.227; ≥ 160 mmHg, OR, 1.312, 95% CI, 1.271–1.356).
The OR of IRF occurrence according to DBP was not statistically different in the ≤ 59 mmHg interval compared with the reference level of 60–69 mmHg. The OR was statistically significant (OR, 1.021; 95% CI, 1.004–1.038) for the 70–79 mmHg interval, and as DBP increased, the OR increased (80–89 mmHg, OR, 1.061, 95% CI, 1.043–1.079; 90–99 mmHg, OR, 1.141, 95% CI, 1.116–1.166; 100–109 mmHg, OR, 1.225, 95% CI, 1.186–1.264; ≥ 110 mmHg, OR, 1.355, 95% CI, 1.274–1.442).
On the other hand, for PP, the OR of IRF occurrence was statistically significantly lower in the ≤ 44 mmHg interval compared with the reference interval of 45–54 mmHg, and the OR was statistically significantly higher (55–64 mmHg; OR, 1.026; 95% CI, 1.011–1.041) for the 55–64 mmHg interval. As PP increased, the OR increased (≥ 65 mmHg; OR, 1.137; 95% CI 1.114–1.16).
The risk of IRF occurrence was measured by subgroup analysis of 8 significant risk factors for CKD of age, sex, DM, obesity, abdominal obesity, eGFR, and smoking according to SBP, DBP, and PP intervals (
Supplementary Fig. 1). The risk of IRF occurrence gradually increased with SBP, DBP, and PP intervals in most subgroups but was significantly higher in some subgroups at the highest blood pressure (≥ 160 mmHg of SBP, ≥ 110 mmHg of DBP). The risk of IRF occurrence in the 20–39 year age group was significantly higher at SBP ≥ 160 mmHg and DBP ≥ 110 mmHg (SBP OR, 1.917, 95% CI, 1.609–2.285; DBP OR, 1.725, 95% CI, 1.357–2.193), and risk for smokers was also significantly higher (SBP OR, 1.518; 95% CI, 1.402–1.644). In addition, the male subgroups showed very high risks (OR, 1.580; 95% CI, 1.458–1.712) in the DBP ≥ 110 mmHg interval, although there was no statistical significance in female (OR, 1.099; 95% CI, 0.995–1.215).


 PDF
PDF Citation
 Print
Print



 XML Download