

 PDF
PDF Citation
 Print
Print


INTRODUCTION
Vancomycin is a glycopeptide antibiotic which has been widely used for the treatment of Methicillin-Resistant Staphylococcus aureus infection.1 Concentrations of vancomycin that are too high could result in severe side effects such as nephrotoxicity,2 hepatotoxicity,3 and ototoxicity,4 especially if it is used together with aminoglycosides.5 Subtherapeutic levels of vancomycin on the other hand, could result in therapeutic failure and development of resistant microorganisms.67 As such, the narrow therapeutic range of vancomycin and a trend towards higher minimum inhibitory concentration increases the importance of accurate dosing of vancomycin to ensure its safety and efficacy.6 Vancomycin is primarily eliminated by the kidneys and hence the maintenance dose is determined by the glomerular filtration rate (GFR).
Accurate estimation of a patient's kidney function is highly essential during vancomycin use. Numerous methods can be used to determine GFR, with estimated creatinine clearance (CLcr) widely accepted as the clinical reference standard.8 Renal clearance is usually estimated based on Cockcroft-Gault equation and is assumed to be relative to the renal clearance of vancomycin.91011 However, studies conducted previously found that serum creatinine-based estimated GFR (eGFR) was associated with several factors such as age, muscle mass and sex. Overestimation of eGFR often occurs amongst the elderly, highly obese, patients with reduced muscle mass, malnutrition, hepatic dysfunction and bedridden patients.121314 Tubular secretion of creatinine could also increase as chronic kidney disease develop progressively to a later stage, thus, results in an unpredictable overestimation of GFR. Some drugs such as trimethoprim,15 cimetidine,16 and antiretroviral drugs,17 could block the tubular secretion of creatinine, leading to increasing serum creatinine concentration without the presence of GFR modification. Therefore, an alternative biomarker with greater precision is required to accurately measure renal function status for better use of vancomycin.18
One alternative endogenous biomarker of glomerular filtration that has been suggested is cystatin C. It is a 13 kDA non-glycosylated cysteine protease inhibitor.19 Cystatin C has a stable production rate because it is produced virtually by all nucleated cells in the body.1920 In a normally functioning kidney, cystatin C is freely filtered by the glomerulus, reabsorbed and catabolised at the renal proximal tubules.19 Serum cystatin C level also showed less dependence on other factors such as age, sex, weight, and muscle mass compared to serum creatinine.2122 Therefore, the serum concentration of cystatin C will directly reflect the kidney function status. Precise dosing is crucial for drugs with a narrow therapeutic index and/or patient with unpredictable renal function estimates. Thus, Kidney Disease: Improving Global Outcomes (KDIGO) 2012 guidelines outlined a recommendation to use methods based on serum cystatin C for GFR estimation. These recommendations are based on many reports which revealed that cystatin C is better than creatinine in GFR determination because it is not affected by hepatic dysfunction, inflammation, body surface area, age, sex, diet and muscle mass.23 A meta-analysis conducted previously also found cystatin C showed greater accuracy than creatinine as a biomarker for patients with impaired renal function.24
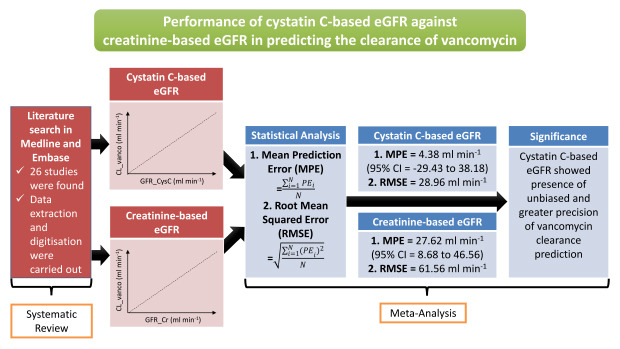
In spite of these results, the use of serum cystatin C for drug dosage adjustment remains limited, partly because many clinicians do not believe its utility.25 Several studies, often with small sample sizes, have compared the performance of serum cystatin C- and creatinine-based eGFR equations in predicting vancomycin clearance. However, missing from the literature is a comprehensive quantitative assessment on the predictive ability or usefulness of serum cystatin C-based eGFR equations to predict the clearance of vancomycin compared to creatinine. The purpose of this study is to systematically review the literature and compare the effectiveness of pooled cystatin C- and creatinine-based eGFR equations in predicting vancomycin clearance.
METHODS
Identification of relevant studies and eligibility criteria
Relevant studies were located through a literature search in MEDLINE (1946 to April 2019) and Embase (1947 to April 2019) to identify all studies that compared the predictive performance of cystatin C- and/or creatinine-based eGFR in predicting the clearance of vancomycin. The literature search was updated in September 2019 to include any recent publications. The MEDLINE MeSH terms and corresponding keywords used are “cystatin C”, “creatinine”, “eGFR”, “pharmacokinetic, and “vancomycin”. In the search strategy, subject terms and keywords were applied in combination. The search was limited to human studies and articles published in the English language. The reference lists from the key review publications were further examined for potentially relevant studies as well as citations of the studies identified.
Inclusion and exclusion criteria
Studies that were identified from the database search were screened based on the title and abstract. A full-text assessment was carried out on all studies that compare the performance of cystatin C- and/or creatinine-based eGFR in predicting the clearance of vancomycin. These steps were conducted by two authors. Most of these data come in the form of a scatterplot of the eGFR and vancomycin clearance values. Studies were excluded if they met any of the following criteria: 1) they are review articles, meta-analyses, commentaries, editorial letters, case reports, 2) only summary data of cystatin C- or creatinine-based eGFR values against vancomycin clearance were provided, 3) the clearance values cannot be standardised in mL min−1, 4) no scatter plot or raw data was provided, and 5) the published scatter plot was of poor resolution for the data to be extracted.
Data extraction
Data extracted from the published studies were based on a standardized form, and any discrepancies in data extraction process were resolved by consensus between authors. Study characteristics extracted from the studies were the year of publication, study size, type of patient's group, age, methods to analyse serum concentration of cystatin C, creatinine, vancomycin, type of cystatin C- or creatinine-based eGFR equations used and methods of vancomycin clearance estimation. Data points from each scatter plot were digitized using the WebPlotDigitizer version 4.1 (Austin, TX, USA). Differences in the number of data points on the scatter plot and the number of subjects recruited were found in some studies. Subsequent calculation and analysis were based on the number of data points, instead of the number of subjects being reported. The reproducibility of the data extraction was evaluated by replicating the data extraction process by a researcher who was not involved in this study. The relative difference between the original and replicate of the extracted data points was compared based on the correlation coefficient or coefficient of determination, depending on which information was provided. A difference of < 5% was considered to be acceptable.
The predictive performance of each cystatin C- and creatinine-based eGFR equations was assessed for bias (mean prediction error [MPE]) and imprecision (mean squared error [MSE] and root MSE [RMSE]) according to Sheiner and Beal26 based on the following equation:
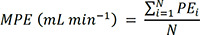
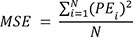

where PEi is the prediction error (the value of eGFR equations minus vancomycin clearance for the ith observation). N is the number of data points extracted from each study. Magnitude and direction of bias was expressed as MPE ± 95% confidence interval (CI) of the difference plots. The RMSE defined as average discrepancy of the prediction from the reference values were reported in the original units of the measure. An RMSE of 0 indicates a completely precise predictions.26
Data-analysis and statistical method
The meta-analyses were performed based on the generic inverse variance method using MedCalc for Windows, version 17.9.7 (MedCalc Software, Ostend, Belgium). In this method, each study estimate of the relative treatment is assigned with a weight equivalent to the inverse of the variance of the effect estimate. This method is used to report the difference between the means and the standard error of this difference based on the continuous data. Several cystatin C- and creatinine-based eGFR equations used in more than one study were considered as a repeated measure. Information on the type of eGFR equations used was extracted from each study and similar equations were pooled together. Results on MPE and its standard error mean were compared between pooled cystatin C-based eGFR and creatinine-based eGFR equations through a three-stage hierarchical meta-analytical model. Comparison of each biomarker in predicting the vancomycin clearance will be determined based on the 95% CI of the pooled MPE and RMSE. If the 95% CI of MPE includes zero, it will indicate the presence of unbiased results. The predictions will be considered not to differ significantly from the actual values. Meanwhile, smaller RMSE value will indicate a greater precision of predictive ability by each biomarker.
Heterogeneity analysis for each study was conducted by using the χ2 test. A P value of less than 0.05 was considered statistically significant. Heterogeneity test based on I2 statistic were used whereby an I2 value of 75%, 50%, and 25% is considered as having a high, moderate and low heterogeneity respectively.27 The meta-analysis was based on a random effects model given a priori assumption of significant heterogeneity between studies. Potential causes of heterogeneity were investigated by conducting sensitivity analysis. This was done by excluding one study at a time to determine its influence on the pooled effects.28 If the overall results and conclusions are consistent with the primary analysis, with a reduction in the I2 value, the study will be considered as an outlier. A pre-specified subgroup analysis among adult patients and methods to estimate vancomycin clearance (e.g., Bayesian, two-stage, Sawchuk-Zaske and population pharmacokinetic analysis) were also conducted. Publication bias was examined using funnel plots and Duval-Tweedie's Trim and Fill method.29
Proportional bias
The data point of eGFR and vancomycin clearance values extracted were further analysed to investigate for the presence of any systematic trend of bias across the different range of vancomycin clearance. A proportional bias, in this case, is defined as a systematic deviation of the PE were plotted against the values of vancomycin clearance on the X-axis. The presence of statistically significant proportional bias is defined when the value of the slope of the difference plot does not equal to zero with a P value less than 0.05.
RESULTS
Literature search results and characteristics of the eligible studies
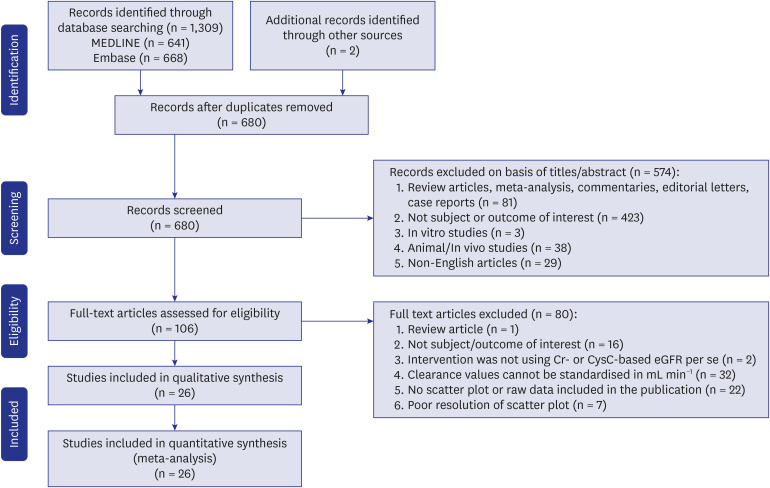
The literature search retrieved 1,309 articles from MEDLINE and Embase databases. Two additional studies were identified in a manual search of the reference list. Of them, 633 articles were removed due to duplication. After screening by title and abstract, 106 studies investigating the relationship between serum cystatin C and creatinine with vancomycin pharmacokinetics were retrieved for further assessment by studying the full-text articles. Further 80 studies were excluded because the inclusion criteria were not met. Flow diagram for the literature search and study selection process is shown in Fig. 1.
There were 26 studies included in the final analysis.930313233343536373839404142434445464748495051525354 Four of the studies provided information on the correlation between both cystatin C- and creatinine-based eGFR with vancomycin clearance.33385354 The study population consisted of patients with various conditions such as burn patients, those who were admitted to the intensive critical unit and patients with unstable renal function. Study characteristics such as assays for serum creatinine, cystatin C and vancomycin level, equations used for each biomarker as well as methods to estimate vancomycin clearance were also presented (Tables 1 and 2, Supplementary Table 1). Data from 1,234 patients were available for analysis.
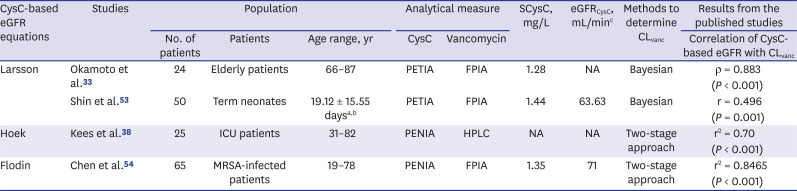
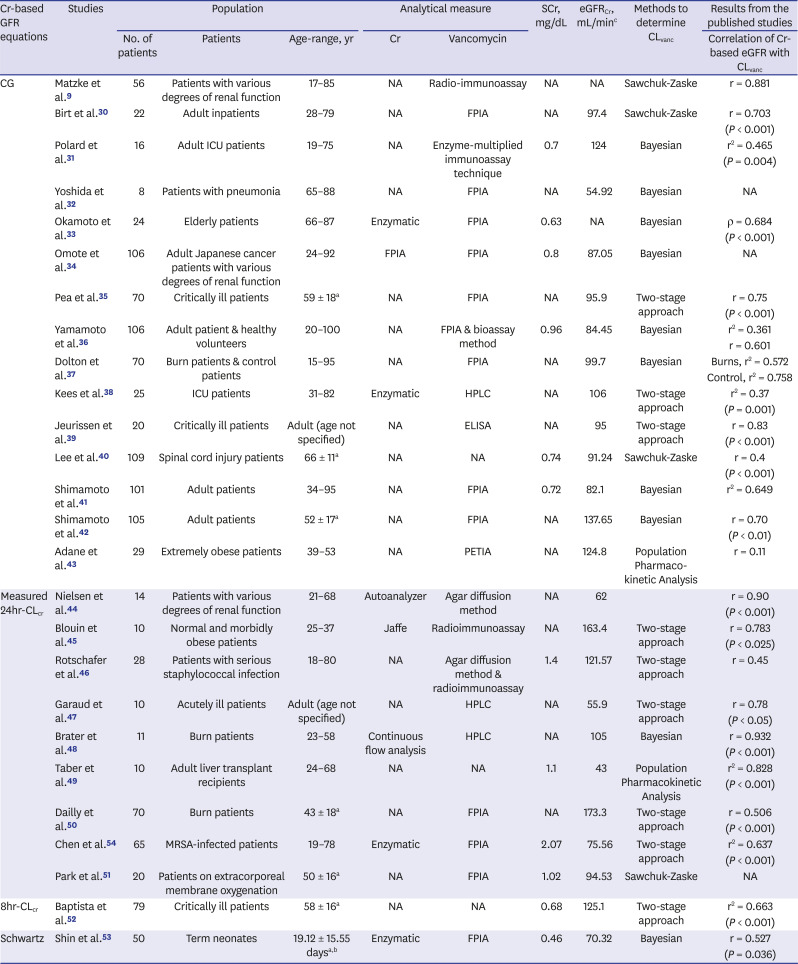
Table 1
Summary of published studies on CysC-based eGFR equations in predicting vancomycin clearance
| CysC-based eGFR equations | Studies | Population | Analytical measure | SCysC, mg/L | eGFRCysC, mL/minc | Methods to determine CLvanc | Results from the published studies | |||
|---|---|---|---|---|---|---|---|---|---|---|
| No. of patients | Patients | Age range, yr | CysC | Vancomycin | Correlation of CysC-based eGFR with CLvanc | |||||
| Larsson | Okamoto et al.33 | 24 | Elderly patients | 66–87 | PETIA | FPIA | 1.28 | NA | Bayesian | ρ = 0.883 |
| (P < 0.001) | ||||||||||
| Shin et al.53 | 50 | Term neonates | 19.12 ± 15.55 daysa,b | PETIA | FPIA | 1.44 | 63.63 | Bayesian | r = 0.496 | |
| (P = 0.001) | ||||||||||
| Hoek | Kees et al.38 | 25 | ICU patients | 31–82 | PENIA | HPLC | NA | NA | Two-stage approach | r2 = 0.70 |
| (P < 0.001) | ||||||||||
| Flodin | Chen et al.54 | 65 | MRSA-infected patients | 19–78 | PENIA | FPIA | 1.35 | 71 | Two-stage approach | r2 = 0.8465 |
| (P < 0.001) | ||||||||||
CysC = cystatin C, eGFR = estimated glomerular filtration rate, SCysC = serum cystatin C, CLvanc = clearance of vancomycin, MRSA = methicillin-resistant Staphylococcus aureus, ICU = intensive care unit, PENIA = particle-enhanced immunonephelometry assay, PETIA = particle-enhanced immunoturbidimetry assay, HPLC = high performance liquid chromatography, NA = not available, r = correlation coefficient, r2 = coefficient of determination.
aAge reported in mean ± standard deviation; bAge reported in days; ceGFR were variably expressed as means or medians or the measure of central tendency was not reported; eGFR was variably expressed as mL/min or mL/min/1.73 m2.
![]()
Table 2
Summary of published studies on Cr-based eGFR in predicting vancomycin clearance
| Cr-based GFR equations | Studies | Population | Analytical measure | SCr, mg/dL | eGFRCr, mL/minc | Methods to determine CLvanc | Results from the published studies | |||
|---|---|---|---|---|---|---|---|---|---|---|
| No. of patients | Patients | Age-range, yr | Cr | Vancomycin | Correlation of Cr-based eGFR with CLvanc | |||||
| CG | Matzke et al.9 | 56 | Patients with various degrees of renal function | 17–85 | NA | Radio-immunoassay | NA | NA | Sawchuk-Zaske | r = 0.881 |
| Birt et al.30 | 22 | Adult inpatients | 28–79 | NA | FPIA | NA | 97.4 | Sawchuk-Zaske | r = 0.703 | |
| (P < 0.001) | ||||||||||
| Polard et al.31 | 16 | Adult ICU patients | 19–75 | NA | Enzyme-multiplied immunoassay technique | 0.7 | 124 | Bayesian | r2 = 0.465 | |
| (P = 0.004) | ||||||||||
| Yoshida et al.32 | 8 | Patients with pneumonia | 65–88 | NA | FPIA | NA | 54.92 | Bayesian | NA | |
| Okamoto et al.33 | 24 | Elderly patients | 66–87 | Enzymatic | FPIA | 0.63 | NA | Bayesian | ρ = 0.684 | |
| (P < 0.001) | ||||||||||
| Omote et al.34 | 106 | Adult Japanese cancer patients with various degrees of renal function | 24–92 | FPIA | FPIA | 0.8 | 87.05 | Bayesian | NA | |
| Pea et al.35 | 70 | Critically ill patients | 59 ± 18a | NA | FPIA | NA | 95.9 | Two-stage approach | r = 0.75 | |
| (P < 0.001) | ||||||||||
| Yamamoto et al.36 | 106 | Adult patient & healthy volunteers | 20–100 | NA | FPIA & bioassay method | 0.96 | 84.45 | Bayesian | r2 = 0.361 | |
| r = 0.601 | ||||||||||
| Dolton et al.37 | 70 | Burn patients & control patients | 15–95 | NA | FPIA | NA | 99.7 | Bayesian | Burns, r2 = 0.572 | |
| Control, r2 = 0.758 | ||||||||||
| Kees et al.38 | 25 | ICU patients | 31–82 | Enzymatic | HPLC | NA | 106 | Two-stage approach | r2 = 0.37 | |
| (P = 0.001) | ||||||||||
| Jeurissen et al.39 | 20 | Critically ill patients | Adult (age not specified) | NA | ELISA | NA | 95 | Two-stage approach | r = 0.83 | |
| (P < 0.001) | ||||||||||
| Lee et al.40 | 109 | Spinal cord injury patients | 66 ± 11a | NA | NA | 0.74 | 91.24 | Sawchuk-Zaske | r = 0.4 | |
| (P < 0.001) | ||||||||||
| Shimamoto et al.41 | 101 | Adult patients | 34–95 | NA | FPIA | 0.72 | 82.1 | Bayesian | r2 = 0.649 | |
| Shimamoto et al.42 | 105 | Adult patients | 52 ± 17a | NA | FPIA | NA | 137.65 | Bayesian | r = 0.70 | |
| (P < 0.01) | ||||||||||
| Adane et al.43 | 29 | Extremely obese patients | 39–53 | NA | PETIA | NA | 124.8 | Population Pharmaco-kinetic Analysis | r = 0.11 | |
| Measured 24hr-CLcr | Nielsen et al.44 | 14 | Patients with various degrees of renal function | 21–68 | Autoanalyzer | Agar diffusion method | NA | 62 | r = 0.90 | |
| (P < 0.001) | ||||||||||
| Blouin et al.45 | 10 | Normal and morbidly obese patients | 25–37 | Jaffe | Radioimmunoassay | NA | 163.4 | Two-stage approach | r = 0.783 | |
| (P < 0.025) | ||||||||||
| Rotschafer et al.46 | 28 | Patients with serious staphylococcal infection | 18–80 | NA | Agar diffusion method & radioimmunoassay | 1.4 | 121.57 | Two-stage approach | r = 0.45 | |
| Garaud et al.47 | 10 | Acutely ill patients | Adult (age not specified) | NA | HPLC | NA | 55.9 | Two-stage approach | r = 0.78 | |
| (P < 0.05) | ||||||||||
| Brater et al.48 | 11 | Burn patients | 23–58 | Continuous flow analysis | HPLC | NA | 105 | Bayesian | r = 0.932 | |
| (P < 0.001) | ||||||||||
| Taber et al.49 | 10 | Adult liver transplant recipients | 24–68 | NA | NA | 1.1 | 43 | Population Pharmacokinetic Analysis | r2 = 0.828 | |
| (P < 0.001) | ||||||||||
| Dailly et al.50 | 70 | Burn patients | 43 ± 18a | NA | FPIA | NA | 173.3 | Two-stage approach | r = 0.506 | |
| (P < 0.001) | ||||||||||
| Chen et al.54 | 65 | MRSA-infected patients | 19–78 | Enzymatic | FPIA | 2.07 | 75.56 | Two-stage approach | r2 = 0.637 | |
| (P < 0.001) | ||||||||||
| Park et al.51 | 20 | Patients on extracorporeal membrane oxygenation | 50 ± 16a | NA | FPIA | 1.02 | 94.53 | Sawchuk-Zaske | NA | |
| 8hr-CLcr | Baptista et al.52 | 79 | Critically ill patients | 58 ± 16a | NA | NA | 0.68 | 125.1 | Two-stage approach | r2 = 0.663 |
| (P < 0.001) | ||||||||||
| Schwartz | Shin et al.53 | 50 | Term neonates | 19.12 ± 15.55 daysa,b | Enzymatic | FPIA | 0.46 | 70.32 | Bayesian | r = 0.527 |
| (P = 0.036) | ||||||||||
Cr = creatinine, eGFR = estimated glomerular filtration rate, SCr = serum creatinine, CLvanc = clearance of vancomycin, MRSA = methicillin-resistant Staphylococcus aureus, ICU = intensive care unit, PETIA = particle-enhanced immunoturbidimetry assay, FPIA = fluorescence polarisation immunoassay, HPLC = high performance liquid chromatography, ELISA = enzyme-linked immunosorbent assay, 24hr-CLcr = 24-hour creatinine clearance, 8hr-CLcr = 8-hour creatinine clearance, CG = Cockcroft-Gault, NA = not available, r = correlation coefficient, r2 = coefficient of determination.
aAge reported in mean ± standard deviation; bAge reported in days; ceGFR or CLcr were variably expressed as means or medians or the measure of central tendency was not reported; eGFR was variably expressed as mL/min or mL/min/1.73m2.
![]()
Meta-analysis on the performance of cystatin C- and creatinine-based eGFR equations in predicting vancomycin clearance
The MPE and RMSE per study and per eGFR equation were summarised in Table 3. Fig. 2 presents a forest plot illustrating the predictive performance of cystatin C- and creatinine-based eGFR equations in predicting the clearance of vancomycin. The pooled MPE obtained by cystatin C-based eGFR equations is 4.38 mL min−1, 95% CI, −29.43, 38.18 mL min−1 with significantly high heterogeneity, P < 0.001, I2 = 96.92% when compared with the creatinine-based eGFR equations with a pooled MPE of 27.62 mL min−1, 95% CI, 8.68, 46.56 mL min−1 with significantly high heterogeneity, P < 0.001, I2 = 87.74%. Cystatin C-based equations with a 95% CI of MPE that include zero indicates an unbiased prediction of vancomycin clearance. Meanwhile, there was statistically significant positive bias demonstrated by the creatinine-based eGFR equations. Greater precision was shown by cystatin C-based eGFR equations in predicting vancomycin clearance due to the smaller RMSE values, when compared with the creatinine-based eGFR equations (28.96 vs. 61.56 mL min−1, respectively), suggesting a better consistency on the ability to predict vancomycin clearance.
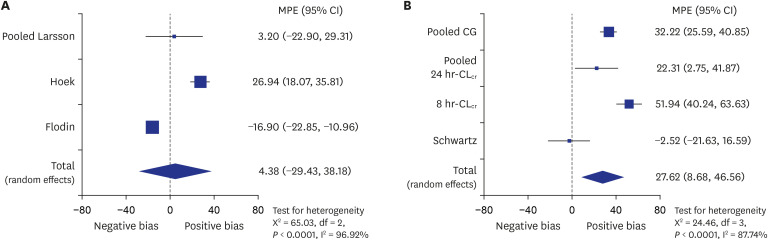
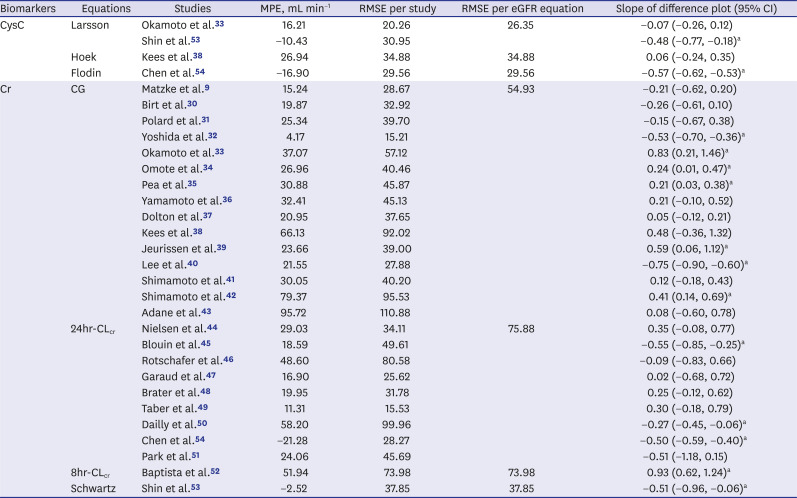
Fig. 2
Forest plot for the primary analysis. (A) On the performance of pooled cystatin C- and (B) creatinine-based estimated glomerular filtration rate equations in predicting vancomycin clearance.
MPE = mean prediction error, CI = confidence interval, CG = Cockcroft-Gault, 24hr-CLcr = 24-hour creatinine clearance, 8hr-CLcr = 8-hour creatinine clearance, df = degrees of freedom.
![]()
Table 3
Summary of bias (MPE) and precision (RMSE) of Cr- and Cys C-based eGFR equations from study
| Biomarkers | Equations | Studies | MPE, mL min−1 | RMSE per study | RMSE per eGFR equation | Slope of difference plot (95% CI) |
|---|---|---|---|---|---|---|
| CysC | Larsson | Okamoto et al.33 | 16.21 | 20.26 | 26.35 | −0.07 (−0.26, 0.12) |
| Shin et al.53 | −10.43 | 30.95 | −0.48 (−0.77, −0.18)a | |||
| Hoek | Kees et al.38 | 26.94 | 34.88 | 34.88 | 0.06 (−0.24, 0.35) | |
| Flodin | Chen et al.54 | −16.90 | 29.56 | 29.56 | −0.57 (−0.62, −0.53)a | |
| Cr | CG | Matzke et al.9 | 15.24 | 28.67 | 54.93 | −0.21 (−0.62, 0.20) |
| Birt et al.30 | 19.87 | 32.92 | −0.26 (−0.61, 0.10) | |||
| Polard et al.31 | 25.34 | 39.70 | −0.15 (−0.67, 0.38) | |||
| Yoshida et al.32 | 4.17 | 15.21 | −0.53 (−0.70, −0.36)a | |||
| Okamoto et al.33 | 37.07 | 57.12 | 0.83 (0.21, 1.46)a | |||
| Omote et al.34 | 26.96 | 40.46 | 0.24 (0.01, 0.47)a | |||
| Pea et al.35 | 30.88 | 45.87 | 0.21 (0.03, 0.38)a | |||
| Yamamoto et al.36 | 32.41 | 45.13 | 0.21 (−0.10, 0.52) | |||
| Dolton et al.37 | 20.95 | 37.65 | 0.05 (−0.12, 0.21) | |||
| Kees et al.38 | 66.13 | 92.02 | 0.48 (−0.36, 1.32) | |||
| Jeurissen et al.39 | 23.66 | 39.00 | 0.59 (0.06, 1.12)a | |||
| Lee et al.40 | 21.55 | 27.88 | −0.75 (−0.90, −0.60)a | |||
| Shimamoto et al.41 | 30.05 | 40.20 | 0.12 (−0.18, 0.43) | |||
| Shimamoto et al.42 | 79.37 | 95.53 | 0.41 (0.14, 0.69)a | |||
| Adane et al.43 | 95.72 | 110.88 | 0.08 (−0.60, 0.78) | |||
| 24hr-CLcr | Nielsen et al.44 | 29.03 | 34.11 | 75.88 | 0.35 (−0.08, 0.77) | |
| Blouin et al.45 | 18.59 | 49.61 | −0.55 (−0.85, −0.25)a | |||
| Rotschafer et al.46 | 48.60 | 80.58 | −0.09 (−0.83, 0.66) | |||
| Garaud et al.47 | 16.90 | 25.62 | 0.02 (−0.68, 0.72) | |||
| Brater et al.48 | 19.95 | 31.78 | 0.25 (−0.12, 0.62) | |||
| Taber et al.49 | 11.31 | 15.53 | 0.30 (−0.18, 0.79) | |||
| Dailly et al.50 | 58.20 | 99.96 | −0.27 (−0.45, −0.06)a | |||
| Chen et al.54 | −21.28 | 28.27 | −0.50 (−0.59, −0.40)a | |||
| Park et al.51 | 24.06 | 45.69 | −0.51 (−1.18, 0.15) | |||
| 8hr-CLcr | Baptista et al.52 | 51.94 | 73.98 | 73.98 | 0.93 (0.62, 1.24)a | |
| Schwartz | Shin et al.53 | −2.52 | 37.85 | 37.85 | −0.51 (−0.96, −0.06)a |
MPE = mean prediction error, RMSE = root mean squared error, Cr = creatinine, CysC = cystatin C, eGFR = estimated glomerular filtration rate, CI = confidence interval, CG = Cockcroft-Gault, 24hr-CLcr = 24-hour creatinine clearance, 8hr-CLcr = 8-hour creatinine clearance.
aPresence of statistically significant proportional bias (P < 0.05).
![]()
Subgroup analysis
Our analysis was further stratified based on age group of patients (i.e., adults only) to further examine the generalisability of the pooled estimate. The study by Shin et al.53 was excluded because the results were based on the neonate population. Re-analysis for the rest of the studies found the pooled MPE obtained by cystatin C-based eGFR equations is 8.63 mL min−1, 95% CI, −15.73, 33.00 mL min−1 with significantly high heterogeneity, I2 = 98.04%, P < 0.001, when compared with the creatinine-based eGFR equations with a pooled MPE of 36.97 mL min−1, 95% CI, 21.75, 52.20 mL min−1 with significantly high heterogeneity, I2 = 78.67%, P = 0.009 (Fig. 3). This indicates the presence of unbiased results when cystatin C-based eGFR equations were used to predict the clearance of vancomycin in the adult population, compared to creatinine-based eGFR equations.
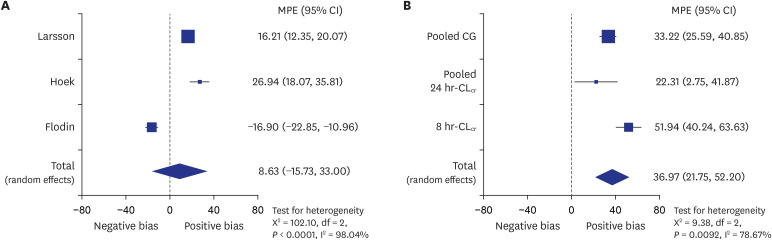
Fig. 3
Forest plot for the subgroup analysis among adult patients only. (A) On the performance of pooled cystatin C- and (B) creatinine-based estimated glomerular filtration rate equations in predicting vancomycin clearance.
MPE = mean prediction error, CI = confidence interval, CG = Cockcroft-Gault, 24hr-CLcr = 24-hour creatinine clearance, 8hr-CLcr = 8-hour creatinine clearance, df = degrees of freedom.
![]()
Subgroup analysis based on methods to estimate vancomycin clearance (e.g., Bayesian estimates, two-stage approach, Sawchuk-Zaske and population pharmacokinetic method) were also conducted. A similar pattern was observed when the cystatin C-based eGFR equations showed unbiased predictions for vancomycin clearance when it is estimated by using Bayesian (MPE, 3.20 mL min−1; 95% CI, −22.90, 29.31 mL min−1) and two-stage approach (MPE, 4.89 mL min−1; 95% CI, −38.07 to 47.85 mL min−1). The details of the subgroup analyses and publication bias assessment are available in Supplementary Table 2 and Supplementary Fig. 1.
Sensitivity analysis
In the sensitivity analysis, one study is excluded at a time to determine its influence on the pooled effects. The dataset is re-analysed after exclusion of a study with negative MPE value, each from cystatin C- and creatinine-based eGFR equations group. There was a statistically significant positive bias by creatinine-based eGFR equations compared to cystatin C-based eGFR equations in vancomycin clearance prediction (Fig. 4). Cystatin C-based equations demonstrated a pooled MPE of 18.38 mL min−1 (95% CI, −3.96, 40.71), while creatinine-based equations demonstrated a pooled MPE of 36.97 mL min−1 (95% CI, 21.75, 52.20). Homogeneity exists between studies involving cystatin C-based equations (I2, 64.87%; P = 0.092). Hence, the results of the sensitivity analysis supported the outcomes of the primary analysis which found a better prediction of vancomycin clearance by cystatin C-based eGFR equations compared to creatinine-based eGFR equations.
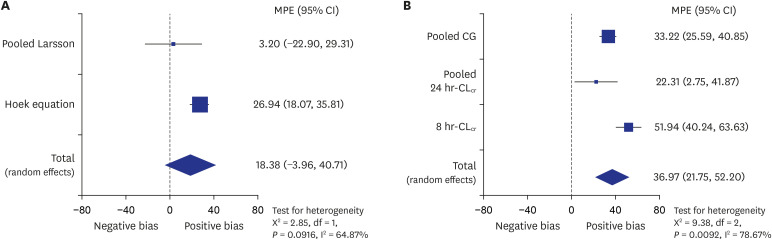
Fig. 4
Forest plot for the sensitivity analysis. (A) On the performance of pooled cystatin C- and (B) creatinine-based estimated glomerular filtration rate equations in predicting vancomycin clearance.
MPE = mean prediction error, CI = confidence interval, CG = Cockcroft-Gault, 24hr-CLcr = 24-hour creatinine clearance, 8hr-CLcr = 8-hour creatinine clearance, df = degrees of freedom.
![]()
Systematic trend of the difference plots
Statistically significant proportional bias was defined as differences in prediction against the clearance of vancomycin, with the presence of P value less than 0.05. Presence of significant proportional bias across the range of vancomycin clearance was found in some studies.323334353940424550525354 The PE based on both biomarkers were inconsistent across the range of vancomycin clearance. Two of the studies involving cystatin C-based eGFR equations showed a presence of statistically significant proportional bias.5354 Positive bias was found at lower vancomycin clearance and negative bias was found at higher vancomycin clearance (Supplementary Fig. 2). Similar results were also shown in six of the creatinine-based studies (Supplementary Fig. 3).324045505354 Majority of these studies uses 24-hour CLcr to obtain the eGFR values. Meanwhile, another six creatinine-based studies with a statistically significant positive slope showed a negative bias at lower vancomycin clearance and positive bias at higher vancomycin clearance. Majority of these studies employed the Cockcroft-Gault equation to estimate patient's GFR. This indicates a different degree of bias as the vancomycin clearance values increases.
DISCUSSION
In this systematic review and meta-analysis, we assessed the performance of serum cystatin C- and creatinine-based eGFR equations in predicting vancomycin clearance. We found that utilising cystatin C-based eGFR equations to predict vancomycin kinetic parameters will be a good alternative to creatinine due to its better accuracy and precision. Cystatin C-based eGFR equations demonstrated better performance than creatinine in estimating vancomycin clearance because the pooled MPE includes zero, indicating the presence of unbiased results (MPE, 4.38 mL min−1; 95% CI, −29.43, 38.18 mL min−1; I2, 96.92%; P < 0.001). Meanwhile, statistically significant positive bias was demonstrated by the creatinine-based eGFR equations as the 95% CI of the pooled MPE did not include zero (MPE, 27.62 mL min−1; 95% CI, 8.68, 46.46 mL min−1; I2, 87.74%; P < 0.001). The result is consistent with the findings obtained through a systematic review conducted by Barreto et al.55 Better prediction of target levels and elimination of vancomycin were obtained by cystatin C-based eGFR than creatinine-based eGFR. In general, cystatin C-based eGFR showed an equivalent accuracy, if not superior than creatinine-based eGFR in predicting the renal elimination of medications. The conduct of this study is consistent with the recommendations by the KDIGO which encourage more studies on the association between eGFR equations and drug pharmacokinetics to be carried out.56
Cystatin C has been proposed as an alternative biomarker because it has a stable production rate and lesser influence by factors known to affect serum creatinine levels such as sex, age, race, and muscle mass.1920 It is expressed in all nucleated cells, freely filtered by the glomerulus and were reabsorbed but not secreted by the proximal tubules.21 These characteristics of cystatin C fit the ideal criteria as an endogenous biomarker. Numerous studies conducted previously found cystatin C is better than creatinine as a biomarker for GFR estimation. In a study conducted by Huang et al.,57 the performance of creatinine- and cystatin C-based eGFR equations were compared with measured GFR (mGFR). Cystatin C-based Hoek equation showed the best overall performance with low bias, good precision and greatest accuracy. This finding is supported by a meta-analysis which concluded that cystatin C had better diagnostic sensitivity, although lesser specificity in the estimation of GFR.58 Hence, there is a promising area for utilisation of cystatin C-based eGFR equations in drug dose adjustment. In a study by Jin et al.,59 the coefficient of determination between measured vancomycin concentrations and predicted vancomycin concentrations based on serum cystatin were higher (r2 = 0.5436) when compared with serum creatinine (r2 = 0.2776). A systematic review was later conducted by Brou et al.60 to investigate the performance of cystatin C and creatinine in dose prediction of certain drugs such as vancomycin, amikacin, carboplatin and digoxin. Majority of the studies (n = 13/16) found a better correlation between serum cystatin C and drug clearance or trough concentrations of drugs being assessed compared to creatinine. This study marked the potential use of cystatin C as a biomarker to obtain more accurate dosing of vancomycin.
Dosage adjustment of renally excreted drugs is crucial among patients with reduced eGFR values. This is important particularly for drugs with a narrow therapeutic index such as vancomycin.61 This time-dependent antibiotic relied on the value of the area under the curve (AUC) to evaluate its effectiveness. Efforts to predict the AUC based on estimated CLcr without information on drug concentration was suggested.62 More than 80% of the vancomycin is excreted by the kidney and its clearance is approximately 50%–80% of the mGFR.10 Hence, predicting the AUC of vancomycin without having to measure its serum concentration is possible through an equation describing a linear relationship between vancomycin clearance and CLcr.62 Although serum creatinine concentrations have been widely used in clinical practice to measure patient’s renal function, it often led to an overestimation of eGFR. This is especially true among elderly patients or those with low muscle mass and could possibly result in renal toxicity due to the drug overdose.
Analysis involving cystatin C- and creatinine-based eGFR equations in predicting vancomycin clearance showed the presence of significantly high heterogeneity. Some of the 95% CI of the studies do not overlap, indicating the presence of differences between studies. The various characteristics of these studies are evident from the examination of Tables 1 and 2. Subgroup analysis on adult patients did not demonstrate any improvement of homogeneity between studies. However, the MPE of cystatin C-based eGFR equations still showed unbiased predictions of vancomycin clearance (MPE, 8.63 mL min−1; 95% CI, −15.73, 33.00 mL min−1). compared to creatinine-based eGFR equations (MPE, 36.97 mL min−1; 95% CI, 21.75, 52.20 mL min−1). Subgroup analysis on the paediatric population was not conducted as only one study were reported in this category. We also evaluated the influence of different methods of vancomycin clearance estimation on the prediction performance of cystatin C- and creatinine-based eGFR equations. A similar pattern, whereby cystatin C-based eGFR equations showed an unbiased prediction of vancomycin clearance were found. The pooled MPE of both cystatin C-based eGFR equations and creatinine-based eGFR equations was reduced in subgroup analysis involving vancomycin clearance obtained based on Bayesian estimates (from 4.38 to 3.20 mL min−1 and from 27.62 to 17.72 mL min−1, respectively). These findings could be explained by the fact that Bayesian estimate demonstrated greater accuracy and lower degree of bias compared to other methods of estimation.6364
Sensitivity analysis was also conducted to examine which study might be an influential outlier to the primary endpoint.28 Outliers are measurements that have a significant deviation from the rest and they are quite common in different kind of datasets.65 The amount of residual heterogeneity tends to be inflated by the outliers, and often results in upwardly biased mean estimates.66 After exclusion of these outliers from meta-analyses of both biomarkers, the heterogeneity test was further improved, while maintaining the consistency of the pooled MPE results with the primary analysis.
Several limitations in this meta-analysis should be acknowledged. First, some studies had repeated measurements for the same individual (i.e., more than one measurement was available per individual).343550 This indicates that the values of eGFR and vancomycin clearance reported are not unique for each individual and that the errors might be correlated. Second, there is a possibility that inaccurate digitisation of the data points to occur during the data extraction process. A good resolution of the scatter plot is very important in ensuring accurate extraction of eGFR and vancomycin clearance values. This is because sometimes overlapping data points could result in imprecise values recorded. However, the error is relatively small overall and less likely to cause a significant effect on the results or conclusion of the present study. A quality control step was conducted by comparing the reproducibility of eGFR and vancomycin clearance data points extracted from the scatter plot by a different researcher. A correlation coefficient or coefficient of determination obtained from the data points extracted were compared to the original values reported in the studies included, with a difference of < 5% were considered acceptable.
Another limitation of this meta-analysis is the inclusion of studies written in the English language only and the clearance values must be reported in units that can be standardised in mL min−1. This had further limited the number of studies that can be included in this meta-analysis. A small number of studies investigating the correlation between cystatin C-based eGFR equations and vancomycin clearance is also one of the limitations in this study. There was a disproportionate focus on creatinine-based eGFR equations (26 studies) compared to cystatin C-based eGFR equations (four studies). It should be noted that although creatinine-based eGFR equations showed a statistically significant bias, it has less variance. This is because a bigger sample size will result in a narrower CI. In this case, creatinine had a smaller 95% CI of the pooled MPE due to the inclusion of a greater number of studies involving creatinine-based eGFR equations. Therefore, more studies investigating the correlation between cystatin C-based eGFR equations and vancomycin clearance should be included to improve the precision of the pooled estimate in future meta-analyses.
Other limitations associated with this study is the high heterogeneity between study designs. Differences in cystatin C, creatinine and vancomycin assays, as well as methods to estimate vancomycin clearance could be among the contributing factors. There is also a plausible effect between different populations of patients on vancomycin (such as renal failure, burns and obese patients) with our study findings. The pharmacokinetic parameters of these patient populations were known to be difficult to predict. This would lead to a very high level of heterogeneity and hence, compromises the interpretation of results. Random-effects model was used after considering the effects of heterogeneity between studies. We tried to address this limitation by conducting subgroup analysis based on patient age group (i.e., adult population) and methods to estimate clearance of vancomycin. However, subgroup analysis based on the complex patient's condition was not conducted because data were too varied.
In conclusion, this meta-analysis has demonstrated that the cystatin C-based eGFR equations provided the best estimation of vancomycin clearance when compared to the creatinine-based equations. Greater precision of predictive performance was also shown by cystatin C-based eGFR equations due to its smaller RMSE values. This indicates that utilisation of cystatin C could be a good alternative biomarker to creatinine in the maintenance or adjustment of vancomycin doses. Majority of the studies also had a statistically significant proportional bias with a positive mean error at a low vancomycin clearance and vice versa. This finding was similar in both biomarkers. A further study specifically designed to compare the different eGFR equations in predicting vancomycin clearance across different patient population or assay methods for both biomarkers and vancomycin is needed to quantify the effectiveness of these biomarkers.
 XML Download