

 PDF
PDF Citation
 Print
Print


INTRODUCTION
When patients try to access healthcare services, time, distance, and cost constraints related to transportation usage lead to a lack of healthcare access.1 Transportation barriers are especially prevalent among poorer, older, disabled, and rural populations, who are disadvantaged in transport utilization, owing to geographical inconveniences (regarding access to healthcare), inability to drive, lack of private cars, and financial difficulties in paying for public transportation.2 Lack of access to healthcare transportation results in more substantial burden of diseases among the transport-disadvantaged population, hence leading to lower life expectancy and quality of life than the transport-advantaged.3
The Korean healthcare system is facing several challenges owing to geographic gaps in healthcare access and a high burden of diseases among the elderly.4 According to the Health Insurance Review & Assessment Service and the National Health Insurance Service of Korea, 24% of the total healthcare providers and 31% of all tertiary hospitals are in Seoul—the national capital.5 Other than regional inequalities, the Korean healthcare system is confronting ever-enlarging medical expenditure issues owing to rapid aging; in the next 50 years, elderly people aged 65 or above are expected to account for more than 45% of the national population.6
Given the aforementioned associations between traveling burden and access to healthcare among disadvantaged populations (e.g., rural residents or elderly people), there is a need to estimate transportation costs regarding healthcare service utilization as a part of the socioeconomic costs of illness. Owing to transportation inconveniences, a significant number of Korean rural elderly people have unmet healthcare needs, more than 35% of which were due to a lack of transportation.7 Another study on access to medical services among people with unmet healthcare needs in Korea reported that 20.9% of the population experienced barriers to receiving necessary medical services due to a lack of transportation access.8 Similarly, several studies reported a lack of access to healthcare among rural, elderly, and disabled populations, indicating a prevalence of physical barriers in primary care settings among vulnerable populations in Korea.91011 Previous studies have determined the economic burden of diseases in Korea by measuring the direct medical costs of inpatient and outpatient care, pharmaceuticals, direct non-medical costs (e.g., transportation costs and caregiver expenses), and indirect costs owing to productivity loss regarding morbidity and mortality.121314151617 Notwithstanding, despite the aforementioned importance of transportation in healthcare utilization, no previous Korean study has independently investigated transportation cost burden.
Conversely, several studies in the United States of America and Europe have investigated transportation cost burden in patients who are required to visit healthcare services regularly owing to medical conditions—such as type 2 diabetes, end-stage renal disease, rheumatoid arthritis, or various types of cancers (i.e., colorectal, cervical, and breast cancer).181920212223 However, the abovementioned past literature from other countries on the size of transportation cost burden regarding healthcare utilization generally focused on a single disease or specific treatment groups. Regarding this gap, a past study highlighted that studies on the cost of disease could benefit from a methodological approach that allows for measuring the overall economic burden in different disease groups, as this may help to enable the distribution of restricted healthcare resources.24 For corroboration, we believe that investigating transportation costs regarding healthcare service utilization among different disease groups at the national level is warranted, and this study may come to support policymakers in their decision-making process related to resource allocation.
Therefore, this study aimed to determine the characteristics of transportation costs regarding healthcare service visits in Korea using secondary data from a nationally representative sample of the Korea Health Panel Study (KHPS). Specifically, we estimated transportation costs in travels to inpatient and outpatient care units in 2016 by transport mode and all categories of diseases that cause people to utilize healthcare services (i.e., 238 disease and 19 injury groups). Afterward, we analyzed the estimated transportation costs to determine the sociodemographic predictors of high economic burden related to healthcare transportation.
METHODS
Data collection and participants
This study utilized data retrieved from the KHPS version 1.5 database. The KHPS is an official statistical database of Korea; since 2008, the study has been conducted annually by the Korea Institute for Health and Social Affairs and the National Health Insurance Service. It provides baseline data on healthcare service utilization, medical expenditures, and healthcare coverage in a nationally representative sample of Korea.25
Specifically, this study used the eleventh-year panel data of the KHPS version 1.5 database (collected in 2016). It had a total sample of 17,424 subjects; this study included only samples of individuals who had experience in healthcare service utilization: 2,216 participants in inpatient and 14,990 in outpatient care. After this initial selection, we excluded subjects with any type of missing data on their sociodemographic characteristics or transportation utilization. In total, 14,845 individuals (6,281 households) were included in our study. Within our final sample, 2,148 had experiences with inpatient and 14,787 with outpatient care. As there were individuals who used healthcare services several times during the study period, the number of healthcare service visits exceeded that of the included samples, with 3,392 inpatient and 292,765 outpatient care visits.
Transportation costs and related variables
In this study, transportation costs were defined as the round-trip costs of using transportation when traveling to utilize a healthcare service. It included inpatient and outpatient transportation costs. In the KHPS survey, participants self-reported their transportation costs for all healthcare travel they made from January to December 2016, except when they traveled by private vehicle (e.g., car or motorcycles).25 In our study, these missing values regarding transportation costs when using private vehicles were filled with the mean value for transportation costs using transit modes other than private vehicles, except in cases where travel cost was free, which were excluded from the calculations. The calculated average transportation costs of using non-private transit modes for inpatient and outpatient care were USD (United States of America dollars) 32.19 and USD 3.93, respectively, which replaced the missing values of transportation costs in private vehicle users.
The estimated transportation costs were computed by healthcare service types (inpatient and outpatient care), transportation modes (private car, taxi, public transportation, train or airplane, walking or biking, ambulance, emergency room hospitalization, and others [including motorcycle or tractor]), and by disease and injury groups (i.e., the major illnesses inducing transportation costs). The latter variable included 238 disease and 19 injury groups, which were categorized under three main clusters: communicable, maternal, neonatal, and nutritional conditions (CMNNs); non-communicable diseases (NCDs); and injuries. We defined the disease and injury groups according to major illness diagnoses from the KHPS database; diagnoses were coded according to the Korean Classification of Diseases (KCD), which is a classification system based on the International Classification of Diseases (ICD). Thereafter, we classified the 238 disease groups based on the hierarchies defined by a previous Korean study on the burden of disease.26 Nevertheless, for the injury groups, while the KHPS database provides information on injury types with S- and T-codes, this aforementioned Korean study clustered injury groups by cause of injury through V-, X-, and Y-codes.26 Thus, the definitions of the 19 injury groups followed the classification of 298 disease groups by KCD codes, as the KCD system provides disease classification from codes for injury type (S-code and T-code).27 In the secondary data we analyzed, transportation costs were calculated exclusively for disease and injury groups that had 30 or more healthcare visits. A selection criterion of a minimum of 30 cases was decided as a compromise between accuracy and the restricted number of samples available in the KHPS database.
Demographic variables
We also collected demographic and socioeconomic factors of the sample, which included: sex (male and female), age (below 20, 20-44, 45-64, 65-74, and 75 or above), healthcare coverage (employee health insurance, self-employed health insurance, and medical-aid beneficiary), household income level in 5-quantiles, disability status (not disabled, mildly disabled, and severely disabled), and residential area (capital, urban, and rural). In the panel data, household income was estimated during the reference period of the previous year, from January to December 2015.25 To reduce any potential bias caused by changes in household members and family size when determining household income levels, we used household population-based weights in the estimation, rather than raw values. This study included data from the following Korean administrative districts: one special metropolitan city (Seoul), six metropolitan cities (Busan, Daegu, Incheon, Gwangju, Daejeon, and Ulsan), one metropolitan autonomous city (Sejong), eight provinces of “Do” (Gyeonggi, Gangwon, Chungbuk, Chungnam, Jeonbuk, Jeonnam, Gyeongbuk, and Gyeongnam), and one special self-governing province (Jeju).28 In this study, we used three categories for residential areas: capital (for those residing in the special metropolitan city), urban (for those residing in either the metropolitan cities or the metropolitan autonomous city), and rural (for those residing in other provinces or the special self-governing province).
Statistical analysis
We utilized descriptive statistics to determine participants' socioeconomic and demographic characteristics, healthcare service types, and outcomes associated with transportation costs. Participants' baseline characteristics and transportation costs were compared between-group for the two types of healthcare services utilized (inpatient and outpatient care recipients); we conducted Pearson's χ2 test for categorical variables and Student's t-test for continuous variables. Transportation costs among participants who traveled by private car, walked, or biked showed identical values: either imputed values to replace missing variables or zero. Therefore, we excluded participants who utilized the aforementioned transit modes to visit healthcare services from the comparative analysis of transportation costs between inpatient and outpatient care recipients by mode.
Multivariable regressions were performed to analyze the influencing factors of higher transportation costs among both groups, and for both the total annual transportation costs and the average cost per visit made to utilize a healthcare service. In the multivariable regression models, the explanatory variables were sex, age, healthcare coverage, household income, disability status, and residential area. These variables are common socioeconomic and demographic factors. Furthermore, multivariable logistic regressions were performed to analyze the influencing factors of higher transportation costs. We defined transportation costs to be at a higher level if they were in the upper 25% of average costs per visit (inpatient, USD 32.19; outpatient, USD 3.60) or per year (inpatient, USD 32.19; outpatient, USD 47.12).
In this study, we chose to present transportation costs based on USD; for this intent, we used the 2016 average currency exchange rate of Korean Won/USD (USD 1 = 1,160.41 KRW).29 To ensure that the estimation of transportation costs during the 2016 study period is comparable to those in other years, key findings are also reported in purchasing power parity dollars (PPP USD). In 2016, the PPP exchange rate was 858.99 KRW/PPP USD.30 All statistical analyses were performed using SPSS version 25 (IBM Corp., Armonk, NY, USA), and statistical significance was set at P = 0.05.
Ethics statement
The protocol of this study was reviewed and approved by the Institutional Review Board of Kyung Hee University (approval No. KHSIRB-19-354[EA]). Because this study used public data from the KHPS, which is de-identified, the Review Board deemed that the need for collecting informed consent was not applicable.
RESULTS
Table 1 shows the sociodemographic characteristics of the 2016 KHPS participants by healthcare service type. Among the inpatient care recipients, 57.96% were female, 28.35% were aged 45–64, 68.34% had employee health insurance, 22.11% were in the first (lowest) quintile for household income level, 90.18% were not disabled, and 61.59% were rural residents. Conversely, among outpatient care recipients, 54.93% were female, 30.54% were aged 45–64, 70.30% had employee health insurance, 22.95% were in the fourth quintile for household income level, 93.98% were not disabled, and 58.29% were rural residents.
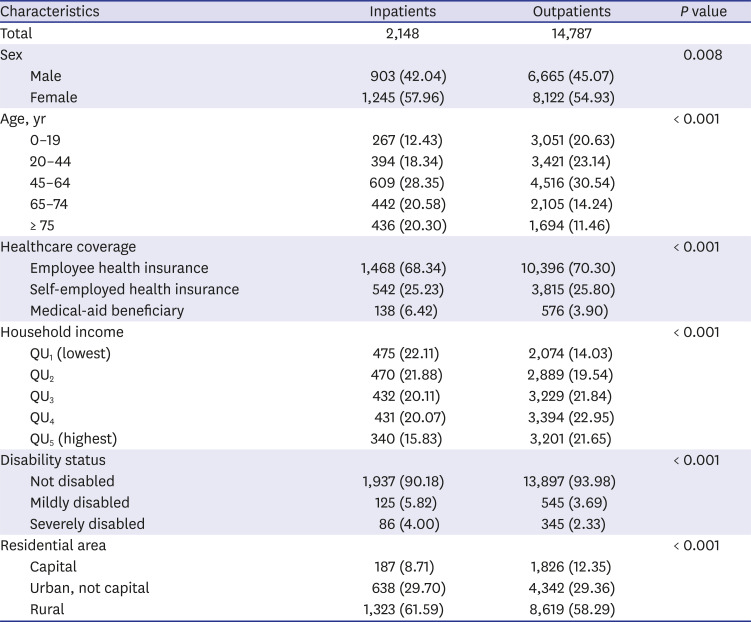
Table 1
Participants' sociodemographic characteristics
![]()
Table 2 shows the total and average costs of using transportation by healthcare service type. Total transportation costs for participants were USD 93,863 (PPP USD 69,483) for inpatient and USD 612,623 (PPP USD 453,493) for outpatient care. In 2016, the average annual transportation costs per patient were USD 43.70 (PPP USD 32.35) for inpatient and USD 41.43 (PPP USD 30.67) for outpatient care; there was no statistically significant difference. However, the average transportation costs per visit (made to a healthcare service) were USD 27.67 (PPP USD 20.48) for inpatient and USD 2.09 (PPP USD 1.55) for outpatient care; for this result, we found a statistically significantly higher cost for inpatient than for outpatient care.
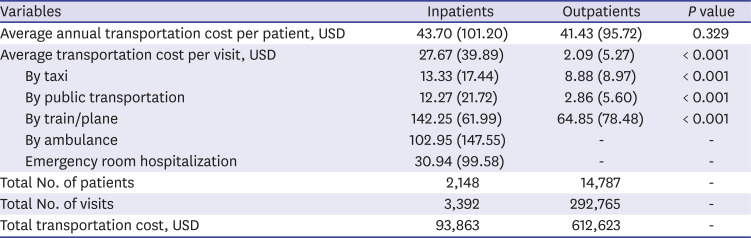
Table 2
Participants' average transportation costs by characteristics and healthcare service type
![]()
Fig. 1 shows the number of visits to inpatient and outpatient care by transportation mode. For inpatient care visits, participants traveled mostly by private car (1,851; 54.57%). For outpatient care visits, participants traveled mostly by walking and biking (130,710; 44.65%). According to average costs by transportation mode and healthcare service type, for both inpatient and outpatient care visits, traveling by train or airplane was the costliest (USD 142.25 for inpatient; USD 64.85 for outpatient care travels) (Table 2). Costs for travel by taxi, public transportation, and train or airplane were significantly higher among inpatient than outpatient care visits.
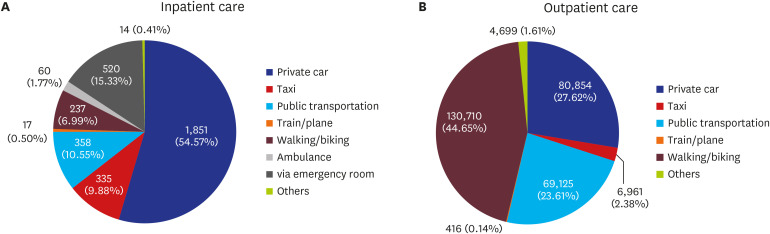
Fig. 2 shows the number of visits by healthcare service type for the three main disease groups—CMNNs, NCDs, and injuries—in 2016. For both inpatient and outpatient care visits, NCDs were the leading cause of healthcare service utilization (1,917 for inpatient; 177,542 for outpatient care).
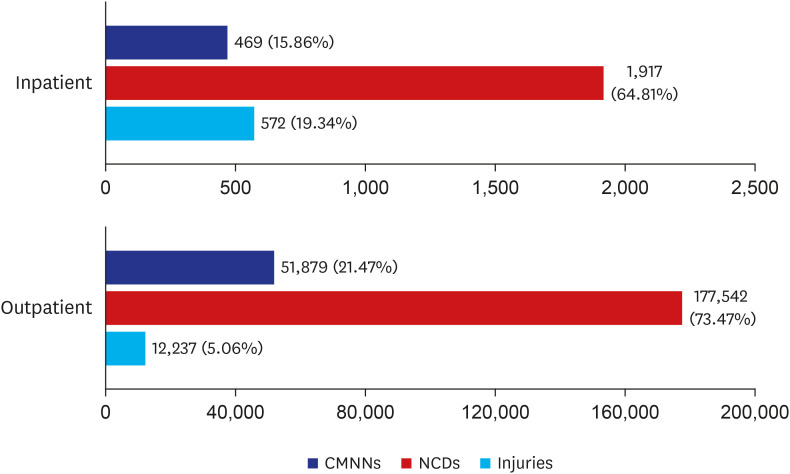
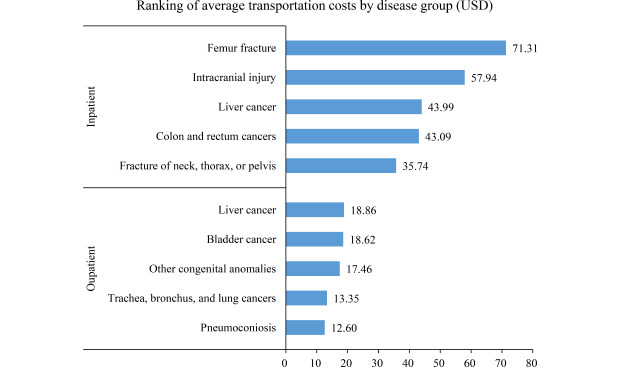
Fig. 3 shows the top ten disease groups with the highest average transportation costs regarding healthcare visits. Participants with neoplasms incurred the highest transportation costs (average of USD 9.73 per visit). Among the smaller groups, participants with bladder cancer (defined by ICD code C67) incurred the highest transportation cost (average of USD 22.98 per visit), followed by those with liver cancer (ICD code C22; average of USD 21.72), and those with femur fractures (ICD code S72; average of USD 18.48). Particularly, for inpatient care, femur fractures resulted in the highest costs per visit (average of USD 71.31); for outpatient care, liver cancer resulted in the highest costs per visit (average of USD 18.86) (Table 3).
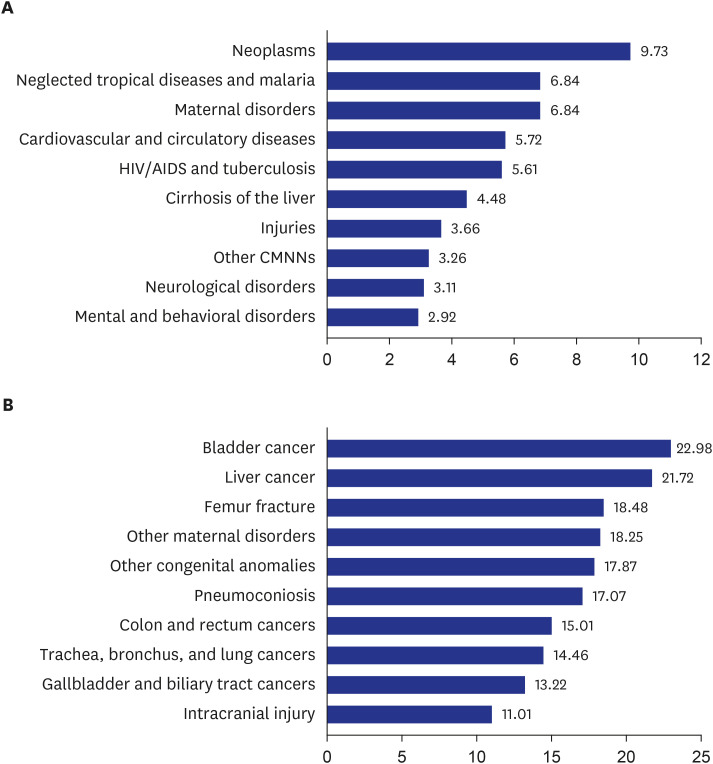
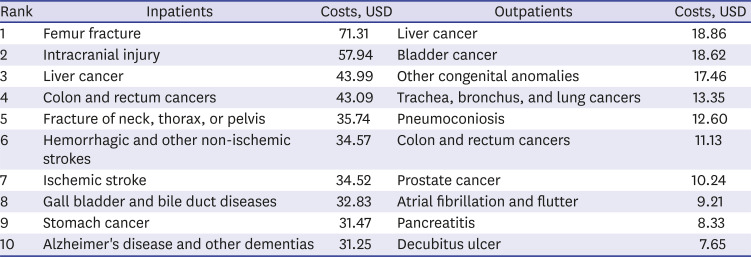
Fig. 3
Ranking of average transportation costs by disease group (USD). (A) Top 10 leading causes in level 2 disease groups. (B) Top 10 leading causes in level 3 and 4 disease groups.
HIV/AIDS = Human immunodeficiency virus infection and acquired immune deficiency syndrome, CMNN = communicable, maternal, neonatal, and nutritional condition, USD = United States dollars.
![]()
Table 3
Ranking of average transportation cost by disease group and healthcare service type
![]()
Table 4 shows the multivariable regression analysis results on the influencing factors of average transportation costs for healthcare services, per year and visit, by service type. Among inpatient care visits, the annual transportation costs were higher by USD 22.32 among those with employee health insurance compared to those who were medical-aid beneficiaries (P = 0.023); by USD 44.71 among those severely disabled compared to those who were not disabled (P < 0.001); and by USD 20.40 among rural compared to capital residents (P = 0.010).
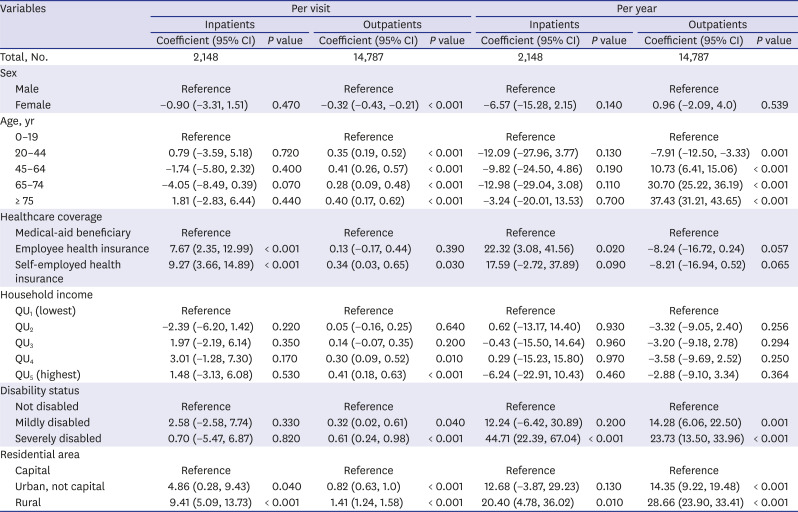
Table 4
Multivariable regression analysis on the influencing factors of transportation costs of healthcare service visits by service type
![]()
Among outpatient care visits, compared to those aged below 20, annual transportation costs were lower by USD 7.91 among those aged 20-44 (P = 0.001) and higher by USD 10.73 (P < 0.001), USD 30.70 (P < 0.001), and USD 37.43 (P < 0.001) among those aged 45–64, 65–74, and 75 or above, respectively. Disability status also had a significant association with annual transportation costs for healthcare services: compared to participants who were not disabled, costs were higher by USD 14.27 among those mildly disabled (P = 0.001) and by USD 23.73 among those severely disabled (P < 0.001). Residential area had a significant association with higher annual transportation costs for outpatient visits: compared to capital residents, costs were higher by USD 14.35 among urban residents (P < 0.001) and by USD 28.66 among rural residents (P < 0.001).
Compared to medical-aid beneficiaries, average transportation costs per inpatient care visit were higher by USD 7.67 among those with employee health insurance (P = 0.005) and by USD 9.27 among those with self-employed health insurance (P = 0.001). Residential area also had a significant association with average transportation costs per inpatient visit: costs were higher by USD 4.86 among non-capital urban residents (P = 0.038) and by USD 9.41 among rural residents, compared to capital residents (P < 0.001).
Among outpatient care recipients, average transportation costs per visit were lower by USD 0.32 among female compared to male participants (P < 0.001). Age groups were all statistically significantly associated with higher mean transportation costs per visit, with those aged 20-44, 45-64, 65-74, and 75 or above had mean transportation costs that were USD 0.35 (P < 0.001), USD 0.41 (P < 0.001), USD 0.28 (P = 0.005), and USD 0.40 higher (P < 0.001) per visit, respectively, compared to those aged below 20. Moreover, among outpatient care recipients, average transportation costs per visit were higher by USD 0.34 among those with self-employed health insurance (P = 0.032) than those who were medical-aid beneficiaries (P = 0.032). Compared to those in the first quintile for household income level, costs were higher by USD 0.30 among those in the fourth quintile (P = 0.006) and by USD 0.41 among those in the fifth (P < 0.001). Compared to those who were not disabled, costs were higher by USD 0.32 among those who were mildly disabled (P = 0.035) and by USD 0.61 among those who were severely disabled (P = 0.001). Compared to capital residents, costs were higher by USD 0.82 among non-capital urban residents (P < 0.001) and by USD 1.41 among rural residents (P < 0.001). Results from the logistic regression analyses for average transportation costs per year and visit also generally presented similar trends (Supplementary Table 1).
DISCUSSION
In 2016, based on KHPS data, average annual transportation costs per patient were USD 43.70 and USD 41.43 for inpatient and outpatient care, respectively. For each visit made to receive healthcare services, average transportation costs per visit were USD 27.67 for inpatient care and USD 2.09 for outpatient care. A report on the 2016 KHPS estimated transportation costs to be approximately 1.3% of overall household medical expenses and 19.17% of non-medical costs.31 According to Lee et al.,16 the total socioeconomic burden of disease in Korea was USD 133.7 billion in 2015, of which USD 65.5 billion were attributable to direct costs and USD 68.2 billion to indirect costs. However, also regarding socioeconomic disease burden, a previous Korean study did not mention the amount of transportation costs, or non-medical expenses including both transportation and caregiving costs. Conversely, the current study focused on the transportation aspect of disease burden. Our findings suggest that inpatient care poses a great economic burden in using transportation to utilize healthcare services, and thus needs to be managed.
Our results showed that, for inpatient care visits, the most popular mode of transportation was private cars (55% of the total cases); among outpatient care visits, most walked or biked (45% of the total cases). In the UK, car ownership is one of the primary factors affecting healthcare usage, mainly because the public transportation system may not be prevalent in disadvantaged areas (e.g., rural locations).32 Moreover, according to the transit performance monitoring system in the US, in small-sized transportation systems for population groups under 500,000, walking is a major alternative to make up for the lack of public transportation.33 Nevertheless, Korea is a country with developed and urbanized transportation systems. In 2016, Korea devoted 9.4% of its total government expenditure on transportation and social overhead capital, all to stimulate regional development.34 Owing to the high investment allocated to urban transport infrastructure, the Korean average for the modal share of public transport was 42.8 in 2016.35 However, despite the high investment in and well-established infrastructure of public transportation, our results from a nationally representative Korean sample showed similarities to those of other countries: higher usage of private cars in an inpatient care context, with walking or biking being more widely utilized for outpatient care visits. The similarities in patterns of transportation utilization between Korea and other countries may be due to differences in public transportation infrastructure in rural areas with low population density. For example, the subway system is built only in five metropolitan areas of Korea: Seoul, Busan/Ulsan, Daegu, Gwangju, and Daejeon.36 Therefore, stronger public transportation systems should be established in non-metropolitan areas.
Overall, there was a high burden of transportation costs related to cancer, representing two of the top three diseases that incurred the highest transportation costs (i.e., bladder cancer, liver cancer, and femur fracture). This corroborated a previous study showing diseases that necessitate regular medical follow-ups (e.g., different types of cancer) require patients to spend considerable amounts of time and money on their treatments.37 Furthermore, outpatient transportation costs were the highest among patients with liver cancer (USD 18.86). In Korean healthcare system, patients can choose between different healthcare providers for their treatment, including tertiary hospitals.4 Although the Korean government has encouraged its population to utilize local clinics before approaching a higher level of healthcare, the freedom to choose any type of healthcare service leads patients with diseases such as cancer to seek and receive medical care mostly from tertiary hospitals—not only for inpatient but also outpatient care.3839 Results from this study showed a high burden of transportation costs among patients with cancer diagnoses. The study also reflected the inclination of major NCD patients to prefer tertiary hospitals over local clinics, thus underscoring a need to strengthen the primary healthcare system in Korea.
In this study, the influencing factors of higher annual inpatient transportation costs were healthcare coverage, disability status, and residential area. Moreover, those influencing higher annual outpatient transportation costs were age, disability status, and residential area. According to Wallace et al.,2 age, geographical location, and disabilities were considered disadvantages for transportation utilization related to healthcare services. Moreover, these results were partly investigated in previous Korean studies that have determined among those who are disabled, the elderly, or rural residents, there is a lower probability of using health screening or medical services when faced with minor symptoms. Furthermore, this behavior was shown to be associated with increased severity in overall health outcomes.74041 Specifically, our results showed age to be a strong influencing factor for transportation costs associated with healthcare services, with those aged over 75 years spending up to USD 37.43 more annually on medical-related travel compared to the younger population. Higher transportation costs among elderly people may be due to the low proportion of individuals in this population who can drive themselves or find a driver among family members.7 Due to the lower availability of personal transportation for older individuals, previous studies have reported higher rates of facing barriers to healthcare access for this population.741
Although we pointed out positive results for research and practice, this study still had limitations. First, we estimated transportation costs based on KHPS secondary data, which were collected through self-report questionnaires; hence, there may have been under or overestimations owing to participants' facing difficulties in recollecting such information. Second, transportation costs for private vehicles (e.g., cars or motorcycles) were calculated using a substitute; the average transportation costs of other transit modes was used. Thus, our results regarding this transportation mode may be different from actual costs.
Despite these limitations, this is, to the best of our knowledge, the first Korean study to investigate transportation costs of all disease groups among those receiving Korean healthcare services. To emphasize previously cited studies in the Introduction, cost or geographical location constraints to transportation usage when trying to visit healthcare services lead to lower healthcare accessibility.123 Previous studies in Korea determined the association between transportation inconveniences and the unmet healthcare needs of vulnerable populations (e.g., elderly people or rural residents)741; nevertheless, these same studies acknowledged the lack of detailed research on specific transportation aspects (e.g., costs or transportation modes) that limit people's accessibility to healthcare services.7 To close this research gap, we used a nationally representative dataset of individuals and households in Korea,25 and analyzed transportation costs of healthcare travel for both inpatient and outpatient care.
In summary, our results showed that the average annual transportation costs were USD 43.70 for inpatient and USD 41.43 for outpatient care. Moreover, the average transportation costs per visit made to a healthcare service were USD 27.67 for inpatient and USD 2.09 for outpatient care. Regarding transportation modes, for inpatient care visits, most used private vehicles; for outpatient care visits, most walked or biked. These results suggested differences in transport utilization related to accessible transportation modes that differ according to levels of public transport infrastructure.
Additionally, transportation costs were estimated by cause of travel (including all 238 disease groups and 19 injuries we found in the KHPS data). Particularly, outpatient care users experienced high transportation costs when they had cancer diagnoses. Furthermore, the influencing factors of transportation costs were age, healthcare coverage, household income, disability status, and residential area. We believe our study provides evidence that transportation cost burden is higher among older, low-income, disabled, or geographically isolated (i.e., rural residents) populations; specifically, it seems to be high among major NCD groups with severe symptoms (e.g., cancer), which often require regular follow-up. Hence, despite the well-structured public transportation system in Korea, transportation costs can still be burdensome to vulnerable populations, especially among those without private vehicles.
In response, we believe there is a need for future investigations on transportation cost disparities in disadvantaged groups (e.g., elderly, low-income, or disabled individuals, and those in rural areas, with major NCD diagnoses, or without private vehicles), and for the targeted implementation of policies to reduce transportation cost burden among these populations.
 XML Download