

 PDF
PDF Citation
 Print
Print


INTRODUCTION
Noncommunicable diseases (NCDs) are known to have various causes. They are affected by a combination of multiple genetic, health behavior, and social factors.1234 NCDs affect the global population, and incur a high burden of disease worldwide. NCDs account for 63% of deaths worldwide (36 million deaths).5 They are responsible for around 70% of annual deaths in the United States (1.7 million deaths).6 Korea experienced a higher burden of NCDs, which accounted for 81% of all deaths in 2016.7 Treatment costs due to NCDs were 44 trillion KRW (38.3 billion USD), accounting for approximately 84% of all medical costs.8
The World Health Organization (WHO) established the Global Action Plan (GAP) 2013–2020 for chronic disease, and set a target of a 25% decrease in premature mortality due to chronic disease.9 Certain countries are attempting to curtail the increase in NCDs, and have developed their own models, for instance, the National Diabetes Prevention Program (DPP) in the United States,10 the Disease Management Program (DMP) in Germany,11 and the North Karelia Project in Finland.12
The model for Korea's representative NCD control program was based on the Chronic Care Model endorsed by the WHO. This is a mutually cooperative model divided into the macroscopic domain (policy and legislation), intermediate domain (public health and medical organizations and local communities), and microscopic domain (patients and family). The program aims to support continuous care through close partnerships between patients, family, healthcare experts and institutions (medical institutions, pharmacies, etc.), and the local community.13
This study assessed the effectiveness of the KCNPC model by linking and analyzing data from the registered management system of the KCNPC and data from the National Health Insurance Service.
Go to : 
METHODS
Characteristics of the Korean Community-based NCD Prevention and Control Program (KCNPC)
The KCNPC started as a model to manage patients with hypertension and diabetes in the local community. After a medical consultation at a clinic, a patient may be registered with the KCNPC, with their consent. Services provided by the KCNPC include recall and reminder services, structured education, counseling, organization of patient self-help groups, and support for evidence-based activities for self-help groups at an education and consulting center (ECC). Patients 65 years and older may receive 42,000 KRW per annum as an incentive for participation, additionally, they receive incentives of an 18,000 KRW exemption on patient-borne costs for up to 12 clinic consultations per annum and a 24,000 KRW exemption on medicine costs. The clinic may apply for a reimbursement for exempted treatment costs at a KCNPC-designated public health center. This program was started as a citywide project in one region (Gwangmyeong-si, Gyeonggi-do) in 2009, using funding from the central government. This was followed by citywide projects in three additional regions (Ansan-si, Namyangju-si, and Hanam-si, Gyeonggi-do) in 2010. In 2012, the program was further expanded to 15 regions (Seongdong-gu, Seoul-si; Gwangsan-gu, Gwangju-si; Jung-gu, Ulsan-si; Sejong-si; Bucheon-si, Gyeonggi-do; Donghae-si and Hongcheon-gun, Gangwon-do; Jinan-gun, Jeollabuk-do; Mokpo-si and Yeosu-si, Jeollanam-do; Gyeongju-si and Nam-gu, Pohang-si, Gyeongsangbuk-do; Sacheon-si, Gyeongsangnam-do; Jeju-si, Jeju-do), making a total of 19 regions. Thereafter, the program continued to expand using funding from local governments. The program currently operates in 25 cities, counties, and districts, which make up 10% of all cities, counties, and districts in Korea.
Data sources and participants
Data registered by a clinic participating in the KCNPC program is known as ‘Registered management data.’ From this data, those who had been diagnosed and registered with hypertension or diabetes at a clinic from 2010–2012 were selected for the intervention group. The blood pressure and blood glucose information of patients aged 30–64 years old participating in the study was incomplete because they were not eligible to receive financial incentives. So, these patients were excluded from the analysis. ‘National health insurance data’ was used to select a control group of patients aged ≥ 65 years who had been diagnosed with hypertension or diabetes at a clinic from 2010–2012 in 19 control regions with similar demographics to the areas participating in the program. The intervention group consisted of patients who had been diagnosed with hypertension or diabetes at a clinic from 2010–2012. None of the patients included in either group had a history of healthcare utilization due to complications (e.g. stroke, myocardial infarction, chronic kidney disease) prior to the study period. Then, to reduce selection bias and the potential baseline differences between the groups, propensity score matching (PSM) was performed via the calliper matching method to match patients from the two groups in a 1:1 ratio. The propensity score was calculated by logistic regression analysis using the following covariates: age, sex, income level and comorbid conditions. The final number of patients included in the analysis was 252,900 in both groups. The control group participants had similar demographic characteristics as the intervention group. Subsequently, these participants were followed-up for 5 years.
Definitions of the study variables
For the classification of diseases, main or secondary disease codes in insurance claims were divided into diagnoses corresponding to 10th revision of the International Statistical Classification of Diseases and Related Health Problems (ICD-10) codes. Specifically, hypertension (I10–I15), diabetes (E10–E14) and, as complications, cerebrovascular disease (I60–I69), cardiac disease (angina pectoris [I20], myocadial infarction [I21–23], other acute ischemic heart diseases [I24], chronic ischemic heart diseases [I25]), and kidney failure (acute kidney failure [N17], chronic kidney diseases [N18], unspecified kidney failure [N19]) were defined. Participants were classified into groups based on income deciles for regional and workplace health insurance subscribers. Medical aid recipients were classified as the bottom decile.
Accounting for the period of health insurance data sampling, the duration of illness variable was defined as the first day care was received at a medical institution for hypertension or diabetes, using data of registered care recipients from 2007 to 2012. Accounting for the duration of illness, patients with records before 2010 were excluded. To classify the time lapse, the duration was calculated from the date of registration in the control program for hypertension and diabetes to the date of care coverage in health insurance data, and the maximum duration was from the date of registration to December 31, 2016, which was when the health insurance data was collected.
Statistical analysis
Data are presented as the mean ± standard deviation or percent. Categorical variables were analyzed using χ2 analysis. The Kaplan–Meier method was applied to estimate the survival probability in both groups. Cox proportional hazards models were applied to calculate the hazard ratios (HRs) and 95% confidence intervals (CIs) for mortality and hospitalization in the intervention group compared with the control group adjusting for age, sex, income level and comorbid conditions. All statistical testing was two sided at a significance level of 0.05. All statistical analyses were conducted using SAS version 9.4 (SAS Institute Inc., Cary, NC, USA).
Ethics statement
This study is based on the data from the NHIS, which is managed by the National Health Insurance Service (No. NHIS-2018-1-084). This study was approved by the Institutional Review Board of the Soonchunhyang University (No. 201712-SB-057-01).
Go to :
RESULTS
Sociodemographic characteristics and NCD prevalence
A total of 252,900 patients were included in the analysis, with 126,450 patients in the case and control group each. There were more female (n = 160,946) than male patients (n = 91,954). The mean age was 73.3 years. By age group, there were 76,728 patients aged 65–69 years, 81,420 patients aged 70–74 years, 54,337 patients aged 75–79 years, 26,694 patients aged 80–84 years, 10,374 patients aged 85–89 years, and 3,347 patients aged ≥ 90 years. By income percentile, there were 10,243 patients in the 0th decile (medical aid recipients), 40,507 patients in the 1st–2nd decile, 28,483 patients in the 3rd–4th decile, 36,348 patients in the 5th–6th decile, 54,163 patients in the 7th–8th decile, and 83,156 patients in the 9th–10th decile. There were 107,550 patients diagnosed with hypertension only, 12,239 patients diagnosed with diabetes only, and 133,111 patients diagnosed with both hypertension and diabetes. The mean duration of illness was 61.7 months (Table 1).
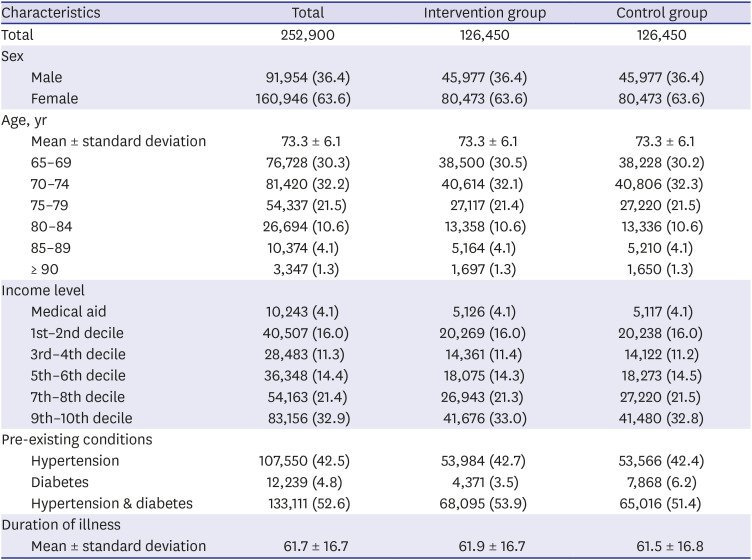
Table 1
General characteristics of the study population
![]()
Hospitalization due to complications
The 5-year hospitalization rate due to cerebrovascular disease (I60–I69) was 5.7% in the intervention group and 6.1% in the control group. The five-year hospitalization rate due to cardiac disease (I20–I25) was 3.8% in the intervention group and 4.1% in the control group. Kidney disease (N17–N19) had a hospitalization rate of 1.7% in the intervention group and 1.9% in the control group (Table 2).

Table 2
Five-year hospitalization rates due to cardiovascular complications
![]()
Kaplan-Meier analysis and Cox regression
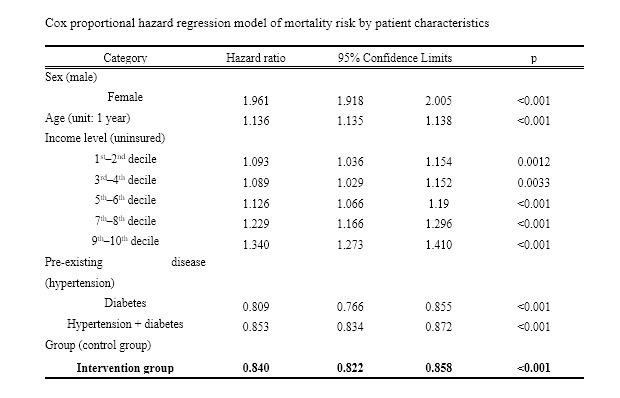
The survival rate was higher in the intervention group than the control group for the entire duration of the study period. In particular, the five-year survival rate in the intervention group was 0.879, higher than the control group at 0.860 (Table 3). Through the Cox proportional hazards analysis of mortality, females showed 1.96 times (95% CI, 1.92–2.01) higher risk of mortality than males. The intervention group showed 0.84 times (95% CI, 0.82–0.86) lower risk of mortality of the control group (Table 4).
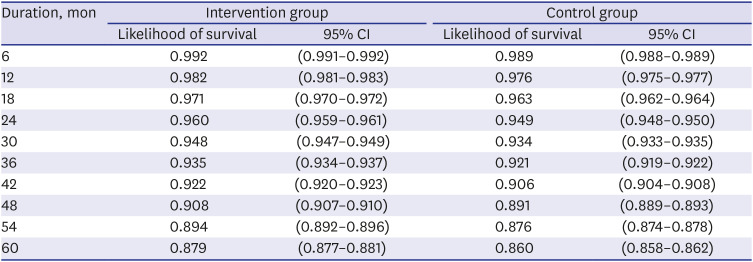
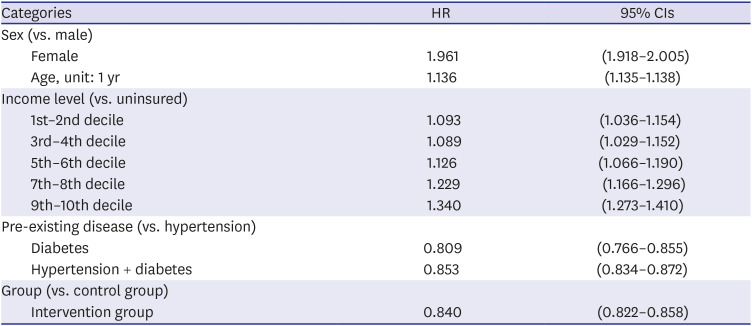
Table 3
Estimated survival rate by time elapsed
Number of months elapsed from the date of participation in the registration management project to the occurrence of the incident. Log rank test (P < 0.001).
CI = confidence interval.
![]()
Table 4
Cox proportional hazard regression model of mortality risk by patient characteristics
![]()
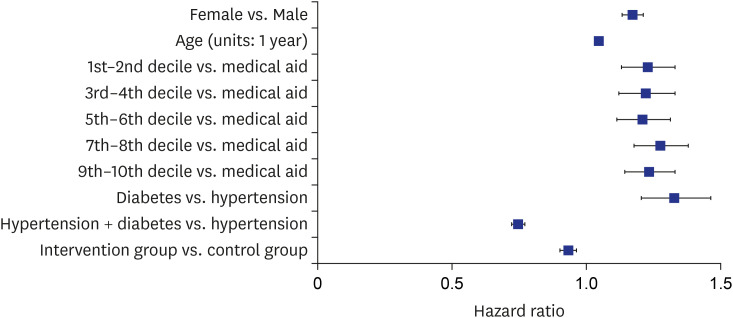
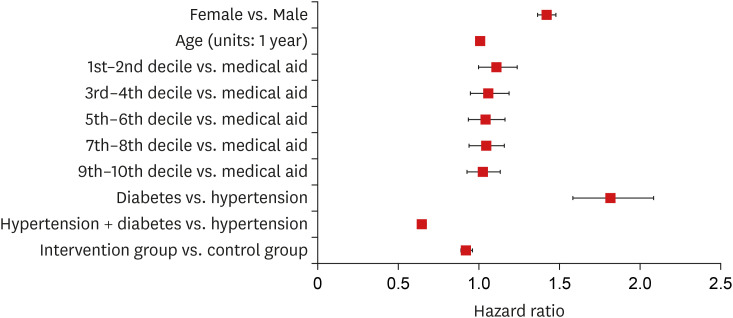
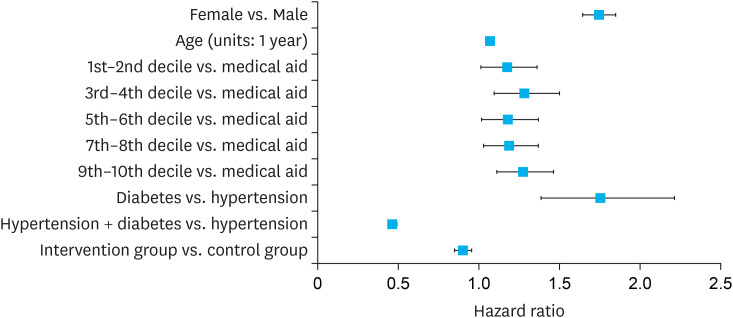
Figures 1, 2, 3 show the proportional hazards of hospitalization due to complications. Compared to the control group, the intervention group showed 0.93 times (95% CI, 0.90–0.96) lower risk of hospitalization due to cerebrovascular disease (Figure 1), 0.92 times (95% CI, 0.89–0.96) lower risk of hospitalization due to cardiac disease (Figure 2), and 0.9 times (95% CI, 0.85–0.95) lower risk of hospitalization due to kidney disease (Figure 3).
Go to :
DISCUSSION
Results demonstrated that patients who registered with the KCNPC program showed a reduced mortality risk compared to the control group. Lower risks of hospitalization due to complications and lower proportional risk of hospitalization were also seen among patients registered in the program.
This was similar to the results of Yoon et al.,14 showing that patients had a higher success rate for blood pressure control after registering and participating in a project for hypertension and diabetes (P < 0.001). Our results concur with a study by Lee et al.,15 who reported that hypertension management and education were strongly associated to the rate of hypertension control. Additionally, Macías et al.16 reported that only 15.7% of hypertensive individuals surveyed had the disease under good control prior to the program. This increased to 31% after registering with the program.
Patients registered with the KCNPC model in this study regularly visited the same primary medical institution and received continuous treatment medical care. In primary medical systems, the continuity of ambulatory care is important. Previous studies have shown that treatment effects are improved when patients receive focused medical services from a single medical provider.171819 In a Korean study assessing continuous treatment as part of a registration-based hypertension control program, the percentage of patients complying with medication for at least 80% of the prescribed days in a year (290 days) before registration was 47.3%. This percentage increased to 65.9% after one year of registration and 69.3% after two years of registration.13 In another study, a longer duration of registration was associated with more effective control of hypertension, thus continuity of patient care showed improved treatment effects.20
Improvements in policy and institutions through nationwide NCD control projects can also greatly reduce the risk of NCDs; for instance, one representative example of a successful NCD control program conducted at a national level is the U.S. National DPP. By changing the lifestyle habits of diabetes patients, this program reduced the incidence in the high diabetes risk group by up to 58%. It was found to be especially effective among elderly patients aged 60 years and above.21
The DMP in Germany provides medical services such as patient-doctor consultations (every 3 months), diabetes-related health examinations, blood tests, patient education, and treatment according to evidence-based guidelines. When the effects of the DMP were analyzed, registered patients showed statistically significant better outcomes in terms of mortality, incidence of four major diseases (diabetes, vision loss, limb amputation, and kidney disease), and medical costs, compared to unregistered patients.22 The North Karelia Project, a health improvement project in Finland, uses various community-based intervention methods. A pilot test was conducted on the 25- to 74-year-old population in North Karelia with a control group selected from the entire Finnish population outside of this region. The results showed a decrease in coronary artery and cardiac disease-related mortality, improvements in cholesterol and blood pressure, and a decrease in the male smoking rate.12
Although this study is the first evidence of diabetes patients having a lower risk of death than hypertension patients, these studies have generally included only subjects > 65 years of age. Similar associations have been observed in elderly nondiabetic populations.232425 Rönnback et al.23 showed the results that the positive association between BP and survival is limited to the elderly patient population. Nevertheless, because the negative associations between BP and mortality were confined to patients with older age or previous CVD, this study supports the view that the positive association between BP and survival is limited to the elderly patient population.
In 2006, the Korean government established a comprehensive plan for the prevention and control of cardio- and cerebrovascular disease, which were responsible for a large disease burden and a major cause of death. In 2009, the KCNPC (hypertension/diabetes) model was developed for prevention and control of these diseases.26 This model was adapted from the WHO Chronic Care Model; and utilized a community-based approach, similar to the North Karelia Project of Finland. This demonstrates that community-based health improvement and disease prevention programs are effective and that national level NCD control programs, such as those of the USA and Germany, are highly effective.
There is an urgent need for vision, experience, and impetus to implement health policies for NCD prevention and control, centered on the local community—a melting pot of health issues. Previous NCD prevention and control projects in Korea have tended to focus on vertical projects centered on individual programs. Learning from the examples of other countries, systematic efforts are now being directed towards generating personnel, facilities, equipment, and information systems through sustainable policies and community-based NCD control projects. Ultimately, it will be necessary to prepare efficient NCD prevention and control policies based on the mechanisms of models that show strengths in other countries. It is also necessary to make efforts to encourage changes in the environment for service provision in Korea, including payment systems and incentives.
This study had several limitations. First, severe disease and mortality were investigated in registered participants in the control project and compared with unregistered patients residing in the same area. However, only participation in the control project was analyzed. The level of control for hypertension and diabetes could not be examined. Second, it was also not possible to investigate differences between individuals' lifestyles, habits, and health behaviors since this information was not available in the databases used for this study. Finally, the databases used in the study did not collect data on the level of treatment such as medication and procedures. Therefore, these could not be reflected in the results.
This study compared mortality and the incidence of complications between patients who participated in the KCNPC program and a control group. This demonstrates the importance of reinforcing efficient, wide-ranging health policies (local communities, institutions, individuals) for prevention and control of NCDs. Thus, preparing policies for efficient prevention and control by linking centers with different scopes and establishing the foundations for the future nationwide expansion of the KCNPC model, may prove beneficial in the fight against NCDs in Korea.
Go to :
 XML Download