

 PDF
PDF Citation
 Print
Print


INTRODUCTION
Hochschild1 defined “emotional labor” as “the management of feeling to create a publicly observable facial and bodily display” in service work. De Castro et al.2 suggested several principal characteristics of emotional labor. First, it requires face-to-face or voice-to-voice contact with clients, and thus often occurs in settings such as small shops, shopping malls, banks, hotels, and restaurants. Second, it requires workers to produce an emotional state that is necessary for their specific jobs, and could be an essential component of their job responsibilities.
The 6th European Work Conditions Survey (EWCS) report3 concluded that emotional demands in the workplace occur when workers are expected to manage their true feelings. Thus, workers may have to hide their true emotions, interact with angry clients, or work in emotionally disturbing situations, all of which require them to manage their emotions. Previous research indicated that high emotional demands are associated with mental health problems3, but not all workers who perform emotional labor experience mental health problems. Among workers who interact with angry clients, there is limited information about the characteristics of workers who are most vulnerable to mental health problems. Such information may be helpful for developing strategies to protect the mental health of these emotional workers.
Thus, we used data of the Korea Working Conditions Survey (KWCS)4 to characterize the demographic, socioeconomic, and modifiable work-related psychosocial factors associated with subjective well-being in workers who interact with angry clients.
METHODS
Data source
This study was a secondary analysis of data from the fifth KWCS, conducted from June to September 2017 by the Korea Occupational Safety and Health Agency (KOSHA). The KWCS is a triennial survey that evaluates working conditions, exposure to hazards, and work-related health problems in workplaces. The survey population was a representative sample of individuals who were 15 years or older and were workers at the time of the survey. An individual was classified as workers if he/she worked for pay or profit for at least 1 hour during the week preceding the interview. Individuals who were retired, unemployed, homemakers, or students were excluded. The basic design was a multistage, stratified, random sampling in the enumeration districts used for the 2010 population and housing census. The fifth KWCS consisted of 50,205 in-person household interviews, and data were weighted with reference to the economically active population of Korea. The KWCS has high content validity and reliability.5
Study subjects
Among the 50,205 interviewees, foreign workers, employers, and self-employed were excluded, and the remaining 37,081 workers were initially included. To identify workers who interacted with angry clients, we asked these 37,081 workers the following question: “Does your job involve interacting with angry customer, patient or student?” The response options were: always, almost always, 75% of the time, 50% of the time, 25% of the time, almost never, and never. We defined workers with responses of “25% of the time” or more as workers who interacted with angry clients.
Measurements
The following demographic, socioeconomic, and work-related psychosocial factors were recoded: sex, age (less than 40 years, 40 to 49 years, 50 to 59 years, 60 or more years), education level (no high school graduation, high school graduation, college or more), monthly income (less than 1,000 USD, 1,000 to less than 2,000 USD, 2,000 to less than 3,000 USD, 3,000 to less than 4,000 USD, 4,000 USD or more), average weekly working time (less than 40 hours, 40 to less than 48 hours, 48 to less than 60 hours, 60 hours or more), and work duration (less than 1 year, 1 to less than 5 years, 5 to less than 10 years, 10 to less than 20 years, 20 years or more). The three types of employment status were: regular employment (having an employment contract for at least 1 year); temporary employment (having a contract for less than 1 year); and daily employment (having a contract for less than 1 month). Job categories included “managers, and professionals and related workers,” “clerks,” “service and sales workers,” “skilled manual workers,” and “unskilled manual workers.” Labor was categorized as manual or non-manual, and then manual labor was categorized as skilled or unskilled. Skilled manual workers thus include the following 3 of 9 major groups in the Korean Standard Classification of Occupations (KSOC)6 and the International Standard Classification of Occupations (ISCO)7: skilled workers related to agriculture, forestry and fisheries, craft and related trade workers, and workers related to equipment, machine operating and assembling. Elementary occupations indicate unskilled manual work. Non-manual workers were “managers, and professionals and related workers,” “clerks,” or “service and sales workers.” “Service and sales workers” mainly perform emotional labor so these individuals differ from other non-manual workers who also have jobs with cognitive demands, such as “managerial and professional work” and “clerical work.”
Subjective well-being was measured using the Well-Being Index of the World Health Organization (WHO-5).8 In a series of five questions, interviewees were asked to indicate that if over the previous two weeks they: (a) felt cheerful and in good spirits, (b) felt calm and relaxed, (c) felt active and vigorous, (d) woke up feeling fresh and rested, and (e) had a daily life that was filled with things that interested them. Each worker gave 0 to 20 points to each item, so the potential maximum was 100. A high total score indicated good subjective well-being, and a total score below 28 indicated an increased risk of mental health problems, including depression (https://www.psykiatri-regionh.dk/who-5/Pages/default.aspx).
Exposure to adverse social behaviors from clients at the workplace was measured by asking the following questions: “Over the last month, during the course of your work have you been subjected to any of the following by clients: (a) verbal abuse, (b) unwanted sexual attention, (c) threats, (d) humiliating behaviors”; and “Over the last year, during the course of your work have you been subjected to any of the following by clients: (e) physical violence, (f) sexual harassment?” The response options for each of item were “yes” and “no”, and a “yes” indicated exposure to adverse social behavior from clients.
Satisfaction with working conditions was measured by the question: “On the whole, are you very satisfied, satisfied, not very satisfied, or not at all satisfied with working conditions in your main paid job?” For analysis, responses of “very satisfied” and “satisfied” were classified as “satisfied,” and responses of “not very satisfied” and “not at all satisfied” were classified as “not satisfied.” Support from the manager was measured by asking if the manager (a) respected you as a person, (b) gave you praise and recognition when you did a good job, (c) was successful in getting people to work together, (d) was helpful in getting the job done, (e) provided useful feedback on your work, and (f) encouraged and supported your development. The social climate at work was measured by asking if: (a) employees were appreciated when they did a good job, (b) the management trusted the employees to do their work well, (c) conflicts were resolved in a fair way, (d) the work was distributed fairly, (e) there was good cooperation between you and your colleagues, and (f) employees generally trusted the management. A five-point Likert scale (1, agree strongly; 2, tend to agree; 3, neither agree nor disagree; 4, tend to disagree; 5, disagree strongly), was used to score the answers to each of the six specific topics regarding support from the manager and the social climate; a score below the median indicated “support from the manager” and “good social climate.”
Statistical analysis
The χ2 test was used to compare the different occupational and demographic characteristics of workers according to their subjective well-being. Odds ratios (ORs) and 95% confidence intervals (95% CIs) for poor subjective well-being (from the WHO-5 index) were calculated using multiple logistic regression. Multiple logistic regression was used to determine adjusted ORs (aORs) and 95% CIs after adjustment for the following covariates: demographic and socioeconomic factors (age, education, and income), work-related factors (weekly working hours, employment status, job category, and exposure to adverse social behavior by clients), and psychosocial factors (job satisfaction, support from a manager, and social climate). Gender-specific analysis was used because men and women could differ in occupational class, specific job tasks performed, and hazards to which they are exposed; physical, physiological, and psychological responses to identical risk factors; and the expression of pain and use of coping strategies to manage psychosocial stressors.910 SPSS (ver. 20) was used for all statistical analyses, and a p-value below 0.05 was considered statistically significant.
RESULTS
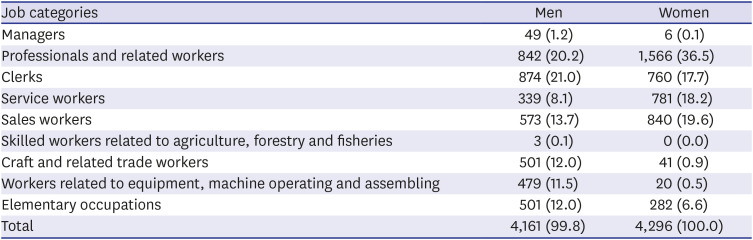
We initially examined 37,081 workers from the KWCS. Overall, 19.8% of men (n = 4,161) and 26.9% of women (n = 4,296) interacted with angry clients (Table 1). Among men who interacted with angry clients, 21.0% were “clerks,” 20.2% were “professionals and related workers,” followed by “sales workers” (13.7%), “craft and related trade workers” (12.0%), “elementary occupations” (12.0%), “workers related to equipment, machine operating and assembling” (11.5%), and “service workers” (8.1%). Among women who interacted with angry clients, 36.5% were “professionals and related workers”, followed by “sales workers” (19.6%), “service workers” (18.2%), “clerks” (17.7%), and “elementary occupations” (6.6%).
Table 1
Job categories of male and female waged workers who interact with angry clients
Overall, 9.6% of men and 7.4% of women who interacted with angry clients reported poor subjective well-being (Table 2). For both genders, the proportions of those who had poor subjective well-being were greater among those who were 60 years or older, had the least education, reported exposure to adverse social behavior by clients, had no job satisfaction, had no support from a manager, and had a bad social climate at the workplace.
Table 2
Association of poor subjective well-being with the characteristics of male and female waged workers who interact with angry clients
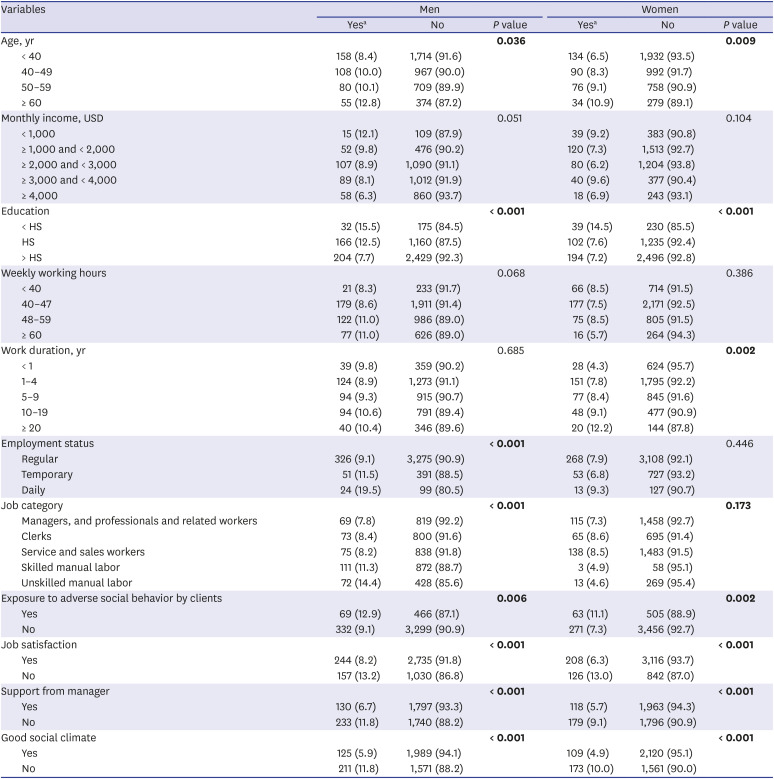
However, there were gender differences in several variables. The proportion of men who had poor subjective well-being was greater for those with daily employment and the proportion of women who had poor subjective well-being was greater for those with work durations of 20 years or more. The proportion of those who had poor subjective well-being was greater for unskilled manual worker for men only.
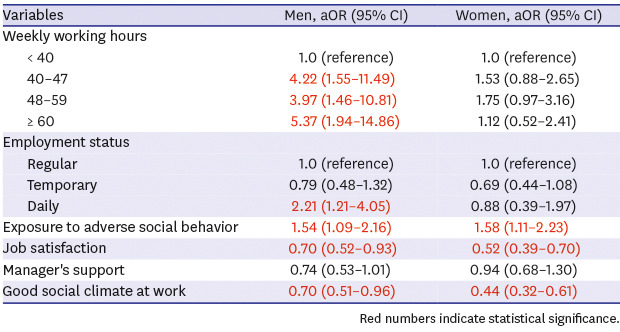
We performed a multivariate logistic regression analysis of factors associated with poor subjective well-being after adjustment for confounding factors (Table 3). Women aged 50 to 59 years were more likely to report poor subjective well-being (aOR, 1.59) and women who completed high school (aOR, 0.38), those who attended college (aOR, 0.37), and those with unskilled manual labor (aOR, 0.30) were less likely to report poor subjective well-being. Men with the highest monthly income (aOR, 0.32) were less likely to report poor subjective well-being, but men with long working hours (40 to 48 hours: aOR, 4.22; 48 to 60 hours: aOR, 3.97; more than 60 hour: OR, 5.37) and men who performed daily work (aOR, 2.21) were more likely to report poor subjective well-being.
Table 3
aORs with 95% CIs for the association of poor subjective well-being in waged male and female workers who interact with angry clients with demographic, socioeconomic, and work-related psychosocial factorsa
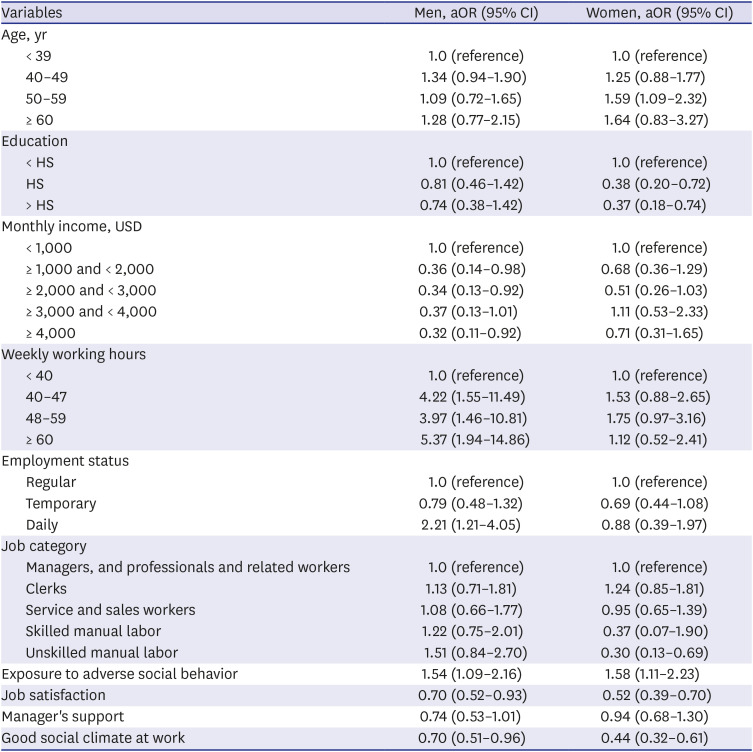
aOR = adjusted odds ratio, CI = confidence interval, HS = high school.
aAdjusted for confounding by the following covariates: demographic and socioeconomic factors (age, education, and income), work-related factors (weekly working hours, employment status, job category, and exposure to adverse social behavior by clients), and psychosocial factors (job satisfaction, support from a manager, and social climate).
Poor subjective well-being was positively associated with exposure to adverse social behavior by clients, and negatively associated with job satisfaction and good social environment at work for both genders. However, poor subjective well-being was unrelated to manager's support.
DISCUSSION
Our nationwide cross-sectional study showed that workers who interact with angry clients were widely distributed over non-manual labor and manual labor, but not limited to service and sales job. The present study found that poor subjective well-being was significantly associated with longer weekly working hours and daily employment for men and with lower educational level and clerical work for women. Poor subjective well-being was also positively associated with exposure to adverse social behavior by clients, and negatively associated with job satisfaction and good social climate at the workplace for both genders.
These findings are compatible to those of some previous studies which showed an association of long working hours with mental health problems, such as depression and anxiety.111213 Our previous studies also found that nonstandard workers—daily workers in particular—were most vulnerable to physical and mental health problems.1415 A previous paper reported an association of status as a precarious worker with depressive symptoms,16 and other study reported an association of status as a part-time, temporary, or daily worker with poorer mental health.17 Most male daily workers in Korea are forced into daily employment to support their families, whereas female daily workers are more likely to select daily employment to supplement the family income and achieve a better work–life balance in dual earner couples, especially.1819 Thus, male daily workers are considered to be typical contingent workers for whom job insecurity is common, and this could contribute to their mental health.1520 Only female unskilled manual workers were less likely to report poor subjective well-being in the present study. Female unskilled manual workers are more likely to work fewer weekly hours, have shorter work duration, have temporary or daily employment,21 and thus, less likely to be exposed to organizational psychosocial stressors. Furthermore, female workers tend to choose part-time or temporary employment to supplement the family income, whereas male workers feel greater responsibility for supporting a family.1819 Our findings regarding the effect of education on subjective well-being are in agreement with a previous study by Schütte et al.,22 who also reported that individuals with less education were less likely to have good subjective well-being.
In the present study, poor subjective well-being had negative associations with job satisfaction and a good social climate at the workplace. These results are in agreement those of previous studies,1523 which also showed that low job satisfaction was strongly associated with mental and psychological problems. Several studies, from epidemiologic studies to meta-analytic integration studies, reported that workers who experienced adverse social behaviors, such as discrimination or sexual harassment, were more vulnerable to psychological health problems.24252627 Previous studies also showed that workers in a bad social climate, in which there are organizational injustices, were more likely to have psychological health problems.282930 The EWCS3 found that failure to provide a good social climate at the workplace may be harmful for a business and for the well-being of its workers, and can result in poorer performance by workers, lower organizational commitment, and increased absenteeism. However, the present study found that managers' support was unrelated to subjective well-being, contrary to previous studies; for example, stress among service workers could be caused by poor psychosocial conditions at work, including lack of control, social support, and rewards, and by workers' individual capacities or characteristics, such as individual motivation and emotional intelligence.31 Furthermore, a previous study reported that a lack of job control and manager's support mediated the association between the performance of emotional labor and poor well-being.32 This discrepancy may be attributable to socio-cultural differences between the West and Korea; manager's support does not act as a mitigating factor, but act as interpersonal conflict (stress factor) in the vertical, authoritarian and patriarchal Korean culture.33
We measured subjective well-being using the WHO-5 index. Generally speaking, subjective well-being has at least 3 dimensions. First, it is a subjective experience3435 in that people with high scores for subjective well-being believe they are mentally healthy.36 Second, it considers the presence of positive emotions and the absence of negative emotions.37 Third, it is a global judgment, in that it is reflective of an individual's overall life.3435 Topp et al.38 concluded that the WHO-5 had adequate validity when used as a screening tool for depression and as an outcome measure in clinical trials. Recently, the screening criteria for the WHO-5 index became stricter. Originally, a score below 13 (of a maximum of 25) indicated the need to test for depression (http://www.who-5.org). Now, a score below 28 (of a maximum of 100) indicates the person is at risk of mental health problems, including depression (https://www.psykiatri-regionh.dk/who-5/Pages/default.aspx). We applied the new stricter criteria in this study. Overall, 9.6% of men and 7.4% of women who interacted with angry clients reported poor subjective well-being in the present study. Similarly, the EWCS3 showed that 6% of workers overall (7% of women and 5% of men) had a WHO-5 score of 28 or less.
The present study is the first to evaluate factors that affect the subjective well-being of workers who interact with angry clients. Our results may have important public health implications. Thus, to promote the well-being of workers who interact with angry clients, employers should develop interventions that protect their workers from adverse social behaviors by clients. Furthermore, a socio-cultural campaign to prevent clients from engaging in adverse social behaviors may help to protect the mental health of workers. To reduce the development of poor subjective well-being, employers should improve the working conditions. Employers should also make an effort to establish a good social climate at the workplace.
The present study has strength. The data were from the KWCS, a survey that implemented rigorous quality control of the procedures. Our study also has some weaknesses. First, we used a cross-sectional design, and hence, we cannot infer causality of the reported correlations because unknown intermediary factors may be responsible for the associations. A prospective study is needed to establish the causal bases for the associations identified here. Second, we partly relied on self-reported data rather than objective data. Self-reported questionnaires may have doubtful validity, so our results should not be considered definitive. Finally, the new topic on the mediation of emotional labor in the relationship between psychosocial factors and mental health is needed to be studied in further research.
In conclusion, workers who interact with angry clients were widely distributed over non-manual labor and manual labor, but not limited to service and sales job. We identified factors that affect the subjective well-being of workers who interact with angry clients. We suggest that employers provide protection to prevent adverse social behaviors by clients, and also make an effort to establish a good social climate at the workplace.
 XML Download