Journal List > J Korean Med Sci > v.35(29) > 1146079

Jang, Chung, Jang, Hwang, Lee, Hwang, Kweon, Tak, Park, Lee, Lee, Kim, Kim, Suh, and Park: Changes in Characteristics of Patients with Liver Cirrhosis Visiting a Tertiary Hospital over 15 Years: a Retrospective Multi-Center Study in Korea

Abstract

Background

Liver cirrhosis has become a heavy burden not only for patients, but also for our society. However, little is known about the recent changes in clinical outcomes and characteristics of patients with cirrhosis-related complications in Korea. Therefore, we aimed to evaluate changes in characteristics of patients with liver cirrhosis in Daegu-Gyeongbuk province in Korea over the past 15 years.

Methods

We retrospectively reviewed the medical records of 15,716 liver cirrhotic patients from 5 university hospitals in Daegu-Gyeongbuk province from 2000 to 2014. The Korean Standard Classification of Diseases-6 code associated with cirrhosis was investigated through medical records and classified according to the year of first visit.

Results

A total of 15,716 patients was diagnosed with cirrhosis. A number of patients newly diagnosed with cirrhosis has decreased each year. In 2000, patients were most likely to be diagnosed with hepatitis B virus (HBV) cirrhosis, followed by alcoholic cirrhosis. There was a significant decrease in HBV (P < 0.001), but alcohol, hepatitis C virus (HCV), and non-alcoholic fatty liver disease (NAFLD) showed a significant increase during the study period (alcohol, P = 0.036; HCV, P = 0.001; NAFLD, P = 0.001). At the time of initial diagnosis, the ratio of Child-Turcotte-Pugh (CTP) class A gradually increased from 23.1% to 32.9% (P < 0.001). The most common cause of liver-related hospitalization in 2000 was hepatocellular carcinoma (HCC) (25.5%); in 2014, gastrointestinal bleeding with esophageal and gastric varices (21.4%) was the most common cause. Cases of hospitalization with liver-related complication represented 76.4% of all cases in 2000 but 70.9% in 2014. Incidence rate of HCC has recently increased. In addition, HCC-free survival was significantly lower in CTP class A than in classes B and C. Finally, there was significant difference in HCC occurrence according to causes (P < 0.001). HBV and HCV cirrhosis had lower HCC-free survival than alcoholic and NAFLD cirrhosis.

Conclusion

In recent years, the overall number of cirrhosis patients has decreased. This study confirmed the recent trend in decrease of cirrhosis, especially of cirrhosis due to HBV, and the increase of HCV, alcoholic and NAFLD cirrhosis. Targeted screening for at-risk patients will facilitate early detection of liver diseases allowing effective intervention and may have decreased the development of cirrhosis and its complications.

Graphical Abstract

jkms-35-e233-abf001.jpg

INTRODUCTION

The liver is a major vital organ, and liver cirrhosis has become a crucial global public health concern and one of the major causes of morbidity and mortality. In Korea, according to national data, the mortality rate in relation to liver disease in 2018 was 13.4/100,000 population, and liver disease was the 7th leading cause of death. However, this rate was lower than that of 2007, which was 15.0/100,000 population.1 In addition, the mortality rate with cirrhosis had been remarkably decreased over time, from 16.8/100,000 population in 2000 to 4.5/100,000 population in 2018.2
The main etiologies of cirrhosis are hepatitis B virus (HBV), hepatitis C virus (HCV), alcoholism, and nonalcoholic steatohepatitis (NASH). In 2015, 257 million people worldwide were diagnosed with chronic HBV, with an overall prevalence greater than 8%,3 and the most common causes of cirrhosis have been related to HBV until recently.4 In addition, after clustered outbreaks of HCV infection associated with reuse of disposable syringes in Korea, the increasing diagnosis rate of HCV is an emerging concern for public health.56 Alcohol is another important risk factor for cirrhosis. From 2005 to 2015, the global age standardized prevalence of cirrhosis due to alcohol increased by 16.1%, compared with those of HBV (11.9%), HCV (14.2%), and others (9.9%).7 Finally, cirrhosis is one of the risk factors of hepatocellular carcinoma (HCC) and increases development of the disease. More than half of all patients diagnosed with liver cancer have cirrhosis. Hence, because the occurrence of cirrhosis increases the risk of complications and mortality, the presence or absence of cirrhosis in patients with chronic liver disease is an important factor in predicting prognosis.
It is likely that higher prevalence and mortality rate of cirrhosis induce a socioeconomic burden. However, through introduction of vaccines and antiviral agents for hepatitis, the causes of cirrhosis seem to be changing over time. For instance, HCV infection and NASH are the recent causes responsible for the growing burden of cirrhosis. To date, many studies from other countries have reported changes and characteristics of liver cirrhosis,8910 but no long-term, community-based study data were available in Korea. Hence, this study underpins the implication of liver cirrhosis in Korea. We described the epidemiology, complications associated with cirrhosis, and development of HCC in Daegu and Gyeongbuk provinces with various causes. Through this study, we underline several important and changing epidemiological aspects and characteristics of patients with liver cirrhosis in Korea.

METHODS

Data source and study population

We retrospectively reviewed the medical records of all patients first diagnosed with cirrhosis in 5 university hospitals in Daegu-Gyeongbuk province during the 15 years from January 2000 to December 2014 (n = 15,716) and retrospectively followed these patients until March 2016. The five university hospitals were Keimyung University, Yeungnam University, Kyungpook University, Catholic University of Daegu, and Dongguk University. The data were collected from the medical records of patients with Korean Standard Classification of Diseases (KCD)-6 codes related to liver cirrhosis, recorded even once in any inpatient or outpatient encounter for the first time and were evaluated in each group at annual intervals. The KCD-6 codes used for diagnosis were K70.30 (alcoholic cirrhosis NOS), K70.31 (alcoholic cirrhosis with ascites), K70.2 (alcoholic fibrosis and sclerosis of liver), K71.7 (toxic liver disease with fibrosis and cirrhosis of liver), K74.0 (hepatic fibrosis), K74.2 (hepatic fibrosis with hepatic sclerosis), and K74.6 (other and unspecified cirrhosis of the liver). We only included patients newly diagnosed with KCD-6 code during the study period.
To confirm the incidence of HCC in cirrhosis patients, the diagnosis of HCC was based on any record of KCD-6 code. Diagnosis of HCC during the follow-up period was set as the primary end point. The incidence of HCC excluded those with diagnosis of HCC within 6 months after initial diagnosis of cirrhosis considering the screening period of 6 months. Because patients with HCC diagnosed within 6 months almost had HCC at the time of cirrhosis diagnosis. Patients who did not develop HCC were censored at the date of last follow up or death.

Definition of cirrhosis and etiologies of cirrhosis

The diagnosis of cirrhosis was made on clinical biochemical, histological, and radiological evidence accompanied by thrombocytopenia and clinical signs of cirrhosis complications such as esophageal varices, ascites, and hepatic encephalopathy. Although cirrhosis is a clinically and pathologically defined disease, all patients in this study were diagnosed with cirrhosis according to KCD code.
Among patients with liver cirrhosis, we categorized four etiologies. First, HBV cirrhosis was defined as cirrhosis with presence of hepatitis B surface antigen (HBsAg). Alcoholic cirrhosis was defined as cirrhosis in a patient who drinks excessively, defined as an average alcohol consumption exceeding 40 g/day in male and 20 g/day in female, and no other viral hepatitis.11 HCV cirrhosis was defined as cirrhosis with anti-HCV antibody. Non-alcoholic fatty liver disease (NAFLD) was diagnosed by KCD code (K75.8, nonalcoholic steatohepatitis) in those who did not have HBV, HCV, or alcoholic liver disease defined as above. Finally, all patients not meeting the above criteria were classified as others; for example, those with autoimmune hepatitis, primary sclerosing cholangitis, and primary biliary cirrhosis.
These definitions were mutually exclusive by study design to compare the causes of cirrhosis.

Subgroup analysis for HCC incidence among cirrhosis patients

For evaluating HCC incidence, patients were divided into three groups according to time of diagnosis: 2000–2003, 2004–2008, and 2009–2012. We extracted age, sex, etiologies of cirrhosis, Child-Turcotte-Pugh (CTP) class, and performed imaging studies, then compared each periods.

Statistical analysis

All statistical analyses were performed using SPSS v. 21.0 (IBM Corp., Chicago, IL, USA). A χ2 test was used for categorical variables and Fisher's exact test when appropriate. Continuous variables with skewed distribution were analyzed using the Mann-Whitney test. P < 0.05 was considered statistically significant. We used multivariate Cox proportional hazards regression to estimate the risk of HCC in patients diagnosed with cirrhosis according to period (2000–2003, 204–2008, and 2009–2012) and based on etiology in a limited maximum follow-up of 5 years. In addition, we used multivariable Cox proportional hazards regression to compare patients with HBV to those with HCV, alcohol, or NAFLD regarding the risk of HCC after cirrhosis diagnosis.

Ethics statement

This retrospective, multi-center clinical study was approved by Keimyung University's Institutional Review Board (IRB File No. 2014-08-002). Informed consent was waived by IRB.

RESULTS

Baseline characteristics

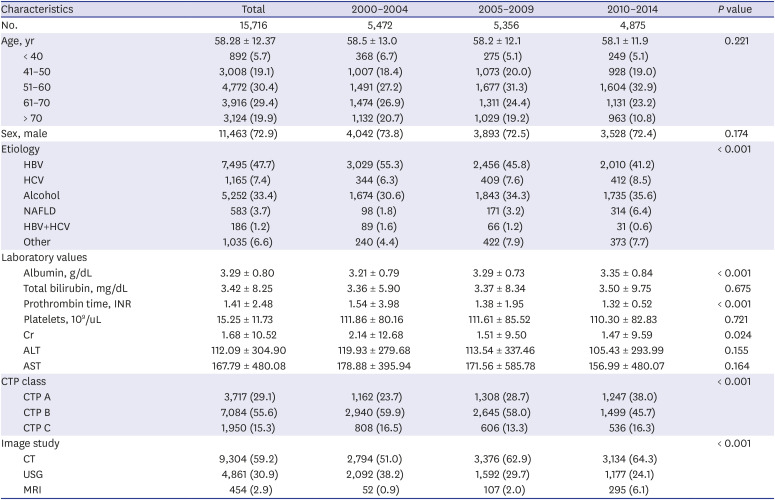
According to diagnosis code, a total of 15,716 cirrhosis patients was included in this study. Their baseline characteristics at diagnosis are summarized in Table 1. Mean age at diagnosis was 58.28 years, and males comprised 72.9% of all patients (11,463 patients).
Table 1

Baseline characteristics of patients at the time of initial diagnosis of cirrhosis

jkms-35-e233-i001
Characteristics Total 2000–2004 2005–2009 2010–2014 P value
No. 15,716 5,472 5,356 4,875
Age, yr 58.28 ± 12.37 58.5 ± 13.0 58.2 ± 12.1 58.1 ± 11.9 0.221
< 40 892 (5.7) 368 (6.7) 275 (5.1) 249 (5.1)
41–50 3,008 (19.1) 1,007 (18.4) 1,073 (20.0) 928 (19.0)
51–60 4,772 (30.4) 1,491 (27.2) 1,677 (31.3) 1,604 (32.9)
61–70 3,916 (29.4) 1,474 (26.9) 1,311 (24.4) 1,131 (23.2)
> 70 3,124 (19.9) 1,132 (20.7) 1,029 (19.2) 963 (10.8)
Sex, male 11,463 (72.9) 4,042 (73.8) 3,893 (72.5) 3,528 (72.4) 0.174
Etiology < 0.001
HBV 7,495 (47.7) 3,029 (55.3) 2,456 (45.8) 2,010 (41.2)
HCV 1,165 (7.4) 344 (6.3) 409 (7.6) 412 (8.5)
Alcohol 5,252 (33.4) 1,674 (30.6) 1,843 (34.3) 1,735 (35.6)
NAFLD 583 (3.7) 98 (1.8) 171 (3.2) 314 (6.4)
HBV+HCV 186 (1.2) 89 (1.6) 66 (1.2) 31 (0.6)
Other 1,035 (6.6) 240 (4.4) 422 (7.9) 373 (7.7)
Laboratory values
Albumin, g/dL 3.29 ± 0.80 3.21 ± 0.79 3.29 ± 0.73 3.35 ± 0.84 < 0.001
Total bilirubin, mg/dL 3.42 ± 8.25 3.36 ± 5.90 3.37 ± 8.34 3.50 ± 9.75 0.675
Prothrombin time, INR 1.41 ± 2.48 1.54 ± 3.98 1.38 ± 1.95 1.32 ± 0.52 < 0.001
Platelets, 109/uL 15.25 ± 11.73 111.86 ± 80.16 111.61 ± 85.52 110.30 ± 82.83 0.721
Cr 1.68 ± 10.52 2.14 ± 12.68 1.51 ± 9.50 1.47 ± 9.59 0.024
ALT 112.09 ± 304.90 119.93 ± 279.68 113.54 ± 337.46 105.43 ± 293.99 0.155
AST 167.79 ± 480.08 178.88 ± 395.94 171.56 ± 585.78 156.99 ± 480.07 0.164
CTP class < 0.001
CTP A 3,717 (29.1) 1,162 (23.7) 1,308 (28.7) 1,247 (38.0)
CTP B 7,084 (55.6) 2,940 (59.9) 2,645 (58.0) 1,499 (45.7)
CTP C 1,950 (15.3) 808 (16.5) 606 (13.3) 536 (16.3)
Image study < 0.001
CT 9,304 (59.2) 2,794 (51.0) 3,376 (62.9) 3,134 (64.3)
USG 4,861 (30.9) 2,092 (38.2) 1,592 (29.7) 1,177 (24.1)
MRI 454 (2.9) 52 (0.9) 107 (2.0) 295 (6.1)
Data are presented as mean ± standard deviation or number (%).
HBV = hepatitis B virus, HCV = hepatitis C virus, NAFLD = non-alcoholic fatty liver disease, INR = international normalized ratio, Cr = creatinine, ALT = alanine aminotransferase, AST = aspartate aminotransferase, CTP = Child-Turcotte-Pugh, CT = computed tomography, USG = ultrasonography, MRI = magnetic resonance imaging.
The most common etiology of cirrhotis at diagnosis was HBV (n = 6,972; 44.4%), followed by alcohol (n = 5,252; 33.4%), HCV (n = 995; 6.3%), and NAFLD (n = 583; 3.7%). According to the CTP classification, 29.2%, 55.6%, and 15.3% of patients were CTP A, B, and C, respectively. At diagnosis, the results of the liver function test in patients with cirrhosis were significantly different from normal values. In these patients, total bilirubin, prothrombin time, creatinine, ALT, and AST were significantly higher, while platelet count and albumin level were significantly lower than normal values (P = 0.001). For diagnosing cirrhosis, computed tomography (CT), ultrasonography, and magnetic resonance imaging (MRI) were used in 59.2%, 30.9%, and 2.9% of patients, respectively.
To compare changes in characteristics of cirrhosis, we divided patients into three groups according to 5-year diagnosis date range, as shown in Table 1. There was no significant difference in age and sex among the three groups (age, P = 0.221; sex, P = 0.174). HBV significantly decreased with time, whereas HCV, alcohol, and NAFLD increased (P < 0.001). Image studies such as CT and MRI were used for diagnosing cirrhosis more from 2010-2014 than from 2000-2004.
Etiology of cirrhosis differed depending on age and sex (Table 2). In male patients, the most common etiology of cirrhosis was HBV (45.7%), followed by alcohol (40.5%). On the other hand, the ratio of alcoholic liver cirrhosis in females was lower than in males. In females, NAFLD and other causes such as autoimmune hepatitis, primary sclerosing cholangitis, and primary biliary cirrhosis were more responsible for cirrhosis than in males. HCV cirrhosis patients were the oldest at diagnosis based on cause of cirrhosis.
Table 2

Analysis of the etiology of cirrhosis according to age and sex

jkms-35-e233-i002
Variables Etiologies of cirrhosis P value
HBV HCV Alcohol NAFLD HBV+HCV Others
Sex < 0.001
Male 5,237 (45.7) 675 (5.9) 4,648 (40.5) 310 (2.7) 114 (1.0) 479 (4.2)
Female 2,258 (53.1) 490 (11.5) 604 (14.2) 273 (6.4) 72 (1.7) 556 (13.1)
Age, yr 57.7 ± 11.8 63.3 ± 12.4 57.1 ± 11.7 61.7 ± 14.9 68.7 ± 12.7 58.5 ± 14.6 < 0.001
Data are presented as mean ± standard deviation or number (%).
HBV = hepatitis B virus, HCV = hepatitis C virus, NAFLD = non-alcoholic fatty liver disease.

Annual changes in characteristics of cirrhosis patients

Annual cirrhosis diagnosis rate

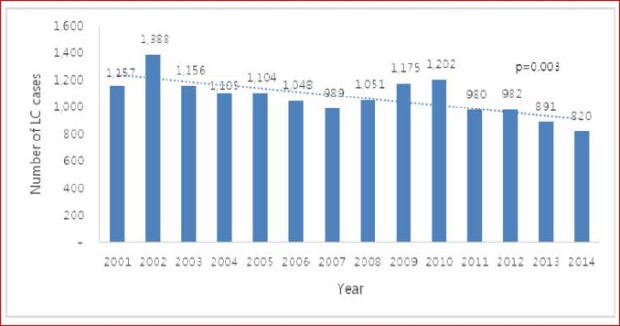
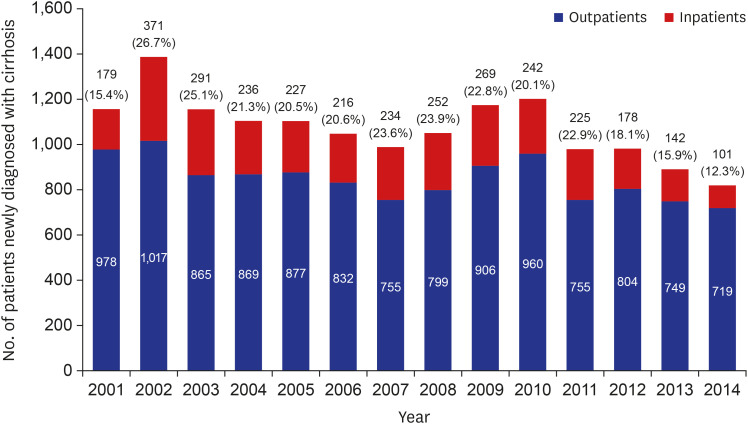
The number of patients with cirrhosis each year was divided into the number of patients who visited the internal medicine department of the digestive system in the 5 hospitals. A number of patients newly diagnosed with cirrhosis decreased every year of the study (P = 0.003), whereas the number of patients who visited outpatient clinic in a tertiary hospital increased.12 The rate of hospitalized patients newly diagnosed with relatively severe cirrhosis compared to those diagnosed at an outpatient clinic steadily decreased, as shown in Fig. 1.
Fig. 1

The decreasing trend of cirrhosis diagnosis by year.

jkms-35-e233-g001

Etiologies of cirrhosis

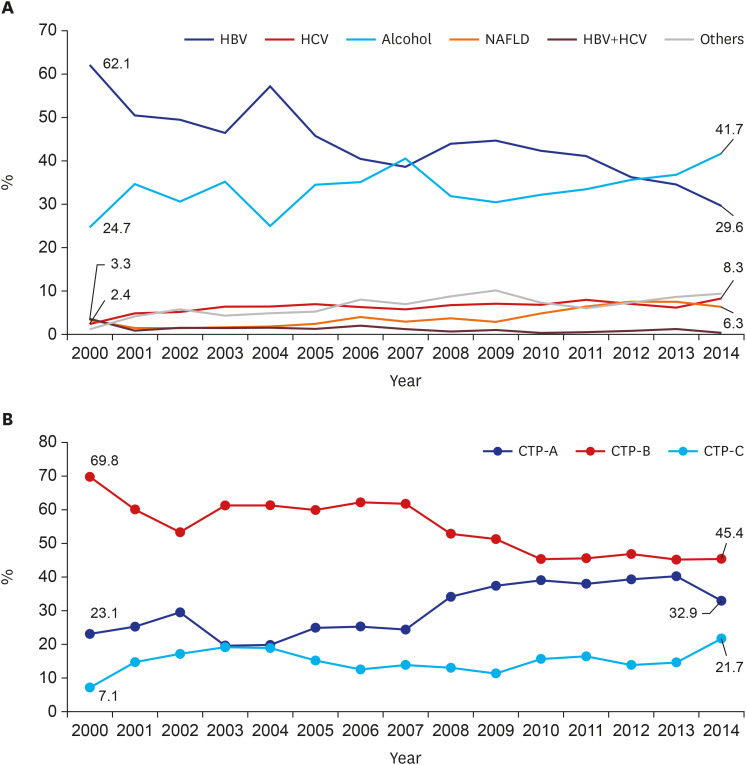
Patients diagnosed with cirrhosis in 2000 predominantly had HBV cirrhosis, followed by alcoholic cirrhosis; these rankings reversed in 2012, with alcohol being the most common cause. HBV significantly decreased as a cause of cirrhosis each year (P < 0.001), whereas alcohol, HCV, and NAFLD significantly increased, as shown in Fig. 2A (alcohol, P = 0.036; HCV, P = 0.002, and NAFLD, P = 0.001).
Fig. 2

The changing trends of cirrhosis patients by year. (A) Trend of each etiologies. (B) Trend in CTP class of cirrhosis patients at diagnosis.

CTP = Child-Turcotte-Pugh, HBV = hepatitis B virus, HCV = hepatitis C virus, NAFLD = non-alcoholic fatty liver disease.
jkms-35-e233-g002

Change in CTP class at initial diagnosis by year

According to CTP class, the baseline characteristics at cirrhosis diagnosis are shown in Table 3. The ratio of HBV cirrhosis was higher among CTP class A, whereas that of alcoholic cirrhosis was relatively higher among CTP class C.
Table 3

Baseline characteristics of patients at initial diagnosis of cirrhosis according to CTP classa

jkms-35-e233-i003
Characteristics CTP class A CTP class B CTP class C P value
No. 3,717 (29.2) 7,084 (55.6) 1,950 (15.3)
Age, yr 58.4 ± 12.5 59.0 ± 12.5 54.2 ± 11.1 < 0.001
Sex, male 2,591 (69.7) 5,231 (73.8) 1,501 (76.9) < 0.001
Etiologies of cirrhosis
HBV 1,847 (49.7) 3,306 (46.7) 794 (40.7) < 0.001
HCV 375 (10.0) 503 (7.1) 94 (4.8)
Alcohol 1,019 (27.4) 2,589 (36.6) 953 (48.9)
NAFLD 114 (3.1) 208 (2.9) 8 (0.4)
HBV+HCV 54 (1.5) 88 (1.2) 11 (0.6)
Others 308 (8.3) 390 (5.5) 90 (4.6)
Data are presented as mean ± standard deviation or number (%).
CTP = Child-Turcotte-Pugh, HBV = hepatitis B virus, HCV = hepatitis C virus, NAFLD = non-alcoholic fatty liver disease.
aTotal study population is lower than in Table 1 because of missing data of patients.
The prevalence of CTP B was highest every year among the types. However, the rate of CTP B at the time of initial cirrhosis diagnosis in 2000 was 69.8% and decrease significantly to 45.4% in 2014 (P < 0.001). At the time of initial diagnosis, the proportion of CTP A gradually increased from 23.1% to 32.9% (P < 0.001). For CTP C, the annual variation was not significant (P = 0.351), as shown in Fig. 2B.

Causes of first hospitalization among patients diagnosed with cirrhosis

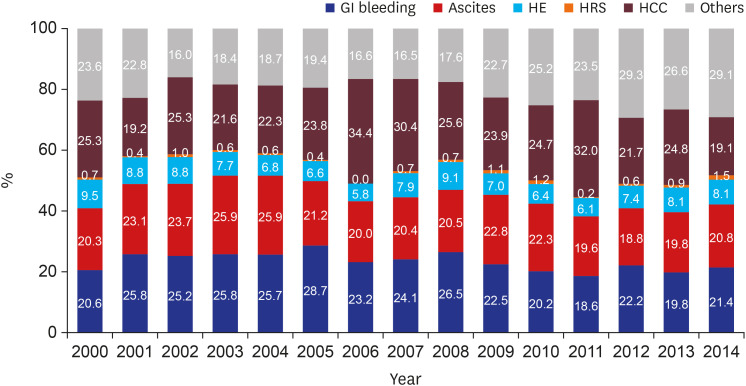
The most common cause of liver-related hospitalization in 2000 was HCC (25.5%), while that in 2014 was gastrointestinal (GI) bleeding with esophageal and gastric varies (21.4%). All causes of hospitalization with liver-related complication represented a proportion of 76.4% of all patients in 2000 but 70.9% in 2014. Other causes of initial hospitalization of cirrhosis patients significantly increased (P = 0.013). However, liver-related initial hospitalization due to causes such as GI bleeding, ascites, hepatic encephalopathy, hepatorenal syndrome, and HCC did not show a statistically significant pattern of annual variation, as shown in Fig. 3.
Fig. 3

Analysis of causes of initial hospitalization by year.

GI = gastrointestinal, HE = hepatic encephalopathy, HRS = hepatorenal syndrome, HCC = hepatocellular carcinoma.
jkms-35-e233-g003

Characteristics of patients in HCC according to subgroup

Analysis of HCC development by period

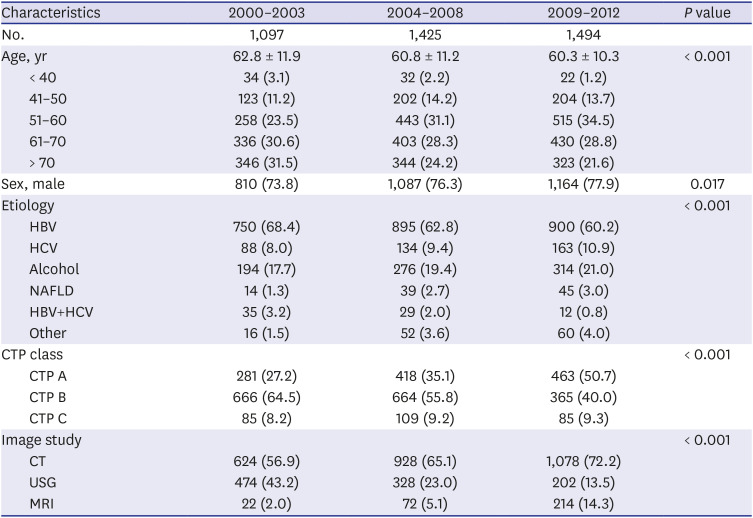
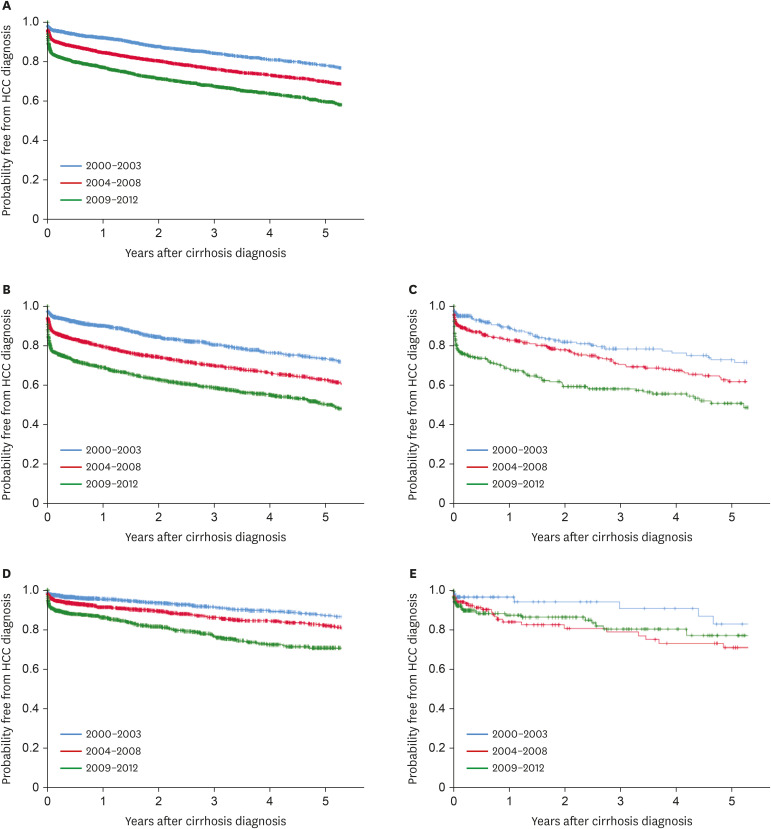
During a mean follow-up of 9.3 years, a total of 4,016 (25.6%) of the patients were newly diagnosed with HCC among 15,716 patients during the study period. We compared three periods; 2000 to 2003, 2004 to 2008, and 2009 to 2012. There was significant difference in sex among groups, with increasing male proportion (P = 0.002). In addition, there was a significant difference between ages, with a mean of 62.8 years in 2000–2003 but of only 60.3 in 2009–2012 (P < 0.001). HBV was the most common cause of the disease during 2000–2003, but it decreased during the study period; however, HCV, alcohol, and NAFLD incidence significantly increased until 2009–2012. The proportion of CTP A in 2000–2003 was 27.2%, but significantly increased in 2009–2012 to 50.7% (P < 0.001). In addition, CT and MRI were performed more often as time passed (P < 0.001). These findings are summarized in Table 4. The Kaplan-Meier survival analysis for five years showed that the diagnosis of HCC increased with time, as shown in Fig. 4 (P < 0.001).
Table 4

Baseline characteristics of patients at initial diagnosis of HCC in the three groups

jkms-35-e233-i004
Characteristics 2000–2003 2004–2008 2009–2012 P value
No. 1,097 1,425 1,494
Age, yr 62.8 ± 11.9 60.8 ± 11.2 60.3 ± 10.3 < 0.001
< 40 34 (3.1) 32 (2.2) 22 (1.2)
41–50 123 (11.2) 202 (14.2) 204 (13.7)
51–60 258 (23.5) 443 (31.1) 515 (34.5)
61–70 336 (30.6) 403 (28.3) 430 (28.8)
> 70 346 (31.5) 344 (24.2) 323 (21.6)
Sex, male 810 (73.8) 1,087 (76.3) 1,164 (77.9) 0.017
Etiology < 0.001
HBV 750 (68.4) 895 (62.8) 900 (60.2)
HCV 88 (8.0) 134 (9.4) 163 (10.9)
Alcohol 194 (17.7) 276 (19.4) 314 (21.0)
NAFLD 14 (1.3) 39 (2.7) 45 (3.0)
HBV+HCV 35 (3.2) 29 (2.0) 12 (0.8)
Other 16 (1.5) 52 (3.6) 60 (4.0)
CTP class < 0.001
CTP A 281 (27.2) 418 (35.1) 463 (50.7)
CTP B 666 (64.5) 664 (55.8) 365 (40.0)
CTP C 85 (8.2) 109 (9.2) 85 (9.3)
Image study < 0.001
CT 624 (56.9) 928 (65.1) 1,078 (72.2)
USG 474 (43.2) 328 (23.0) 202 (13.5)
MRI 22 (2.0) 72 (5.1) 214 (14.3)
Data are presented as mean ± standard deviation or number (%).
HCC = hepatocellular carcinoma, HBV = hepatitis B virus, HCV = hepatitis C virus, NAFLD = non-alcoholic fatty liver disease, CTP = Child-Turcotte-Pugh, CT = computed tomography, USG = ultrasonography, MRI = magnetic resonance imaging.
Fig. 4

Kaplan-Meier curves showing survival free from HCC after cirrhosis diagnosis. (A) Survival free from HCC for all patients according to period. (B) Survival free from HCC for HBV cirrhosis patients. (C) Survival free from HCC for HCV cirrhosis patients. (D) Survival free from HCC for alcoholic cirrhosis patients. (E) Survival free from HCC for NAFLD cirrhosis patients.

HCC = hepatocellular carcinoma, HBV = hepatitis B virus, HCV = hepatitis C virus, NAFLD = non-alcoholic fatty liver disease.
jkms-35-e233-g004
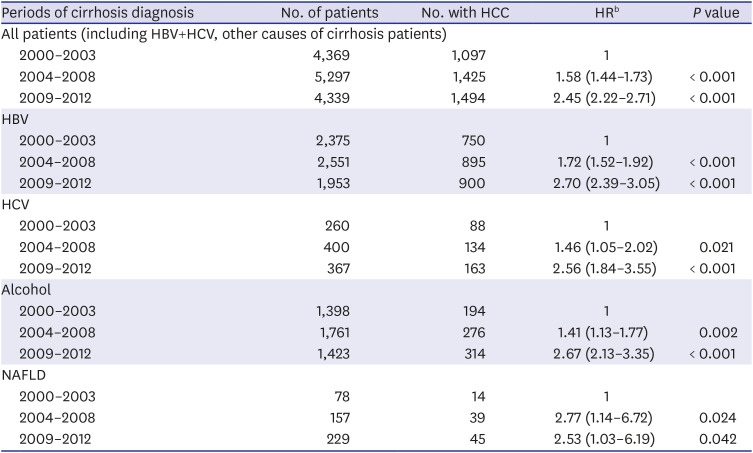
The HCC-free survival rate was lower in cirrhosis patients diagnosed in 2009-2012 than in those diagnosed in 2000–2003 or 2004–2008 (Fig. 4A). In addition, patients with HBV, HCV, or alcoholic cirrhosis had the same pattern of HCC-free survival during each period (Fig. 4B-E). An increase in risk of HCC development was seen over time among the four major etiologies of cirrhosis (Table 5). The 2004–2008 period had higher HCC risk than 2000–2003 (hazard ratio [HR], 1.58; 95% confidence interval [CI], 1.44–1.73), and the 2008–2012 period had higher HCC risk than 2000–2003 (HR, 2.45; 95% CI, 2.22–2.71).
Table 5

Comparison of risk of HCC development among cirrhosis patients according to perioda

jkms-35-e233-i005
Periods of cirrhosis diagnosis No. of patients No. with HCC HRb P value
All patients (including HBV+HCV, other causes of cirrhosis patients)
2000–2003 4,369 1,097 1
2004–2008 5,297 1,425 1.58 (1.44–1.73) < 0.001
2009–2012 4,339 1,494 2.45 (2.22–2.71) < 0.001
HBV
2000–2003 2,375 750 1
2004–2008 2,551 895 1.72 (1.52–1.92) < 0.001
2009–2012 1,953 900 2.70 (2.39–3.05) < 0.001
HCV
2000–2003 260 88 1
2004–2008 400 134 1.46 (1.05–2.02) 0.021
2009–2012 367 163 2.56 (1.84–3.55) < 0.001
Alcohol
2000–2003 1,398 194 1
2004–2008 1,761 276 1.41 (1.13–1.77) 0.002
2009–2012 1,423 314 2.67 (2.13–3.35) < 0.001
NAFLD
2000–2003 78 14 1
2004–2008 157 39 2.77 (1.14–6.72) 0.024
2009–2012 229 45 2.53 (1.03–6.19) 0.042
HCC = hepatocellular carcinoma, HR = hazard ratio, HBV = hepatitis B virus, HCV = hepatitis C virus, NAFLD = non-alcoholic fatty liver disease.
aLimited to a maximum follow-up of 5 years to make each periods more directly comparable; bAdjusted by Cox proportional hazards analysis for age, sex, etiologies of cirrhosis, decompensated cirrhosis (defined as the presence of ascites, hepatic encephalopathy, gastroesophageal varices or hepatorenal syndrome), hemoglobin, platelet count, bilirubin, albumin, and alanine aminotransferase.

HCC development according to CTP class

The HCC incidence was compared between patients according to CTP class. There was significant difference in sex between the three groups. The age of patients diagnosed with HCC in each CTP class A–C was 61.5 years, 62.3 years, and 55.7 years, respectively (P = 0.002), as summarized in Table 6.
Table 6

Baseline characteristics of patients at HCC diagnosis according to CTP class

jkms-35-e233-i006
Characteristics CTP class A CTP class B CTP class C P value
No. 1,162 1,695 279
Age, yr 61.5 ± 12.7 62.3 ± 12.4 55.7 ± 11.0 < 0.001
Sex, male 882 (75.9) 1,285 (75.8) 213 (76.3) < 0.001
Etiologies of cirrhosis
HBV 720 (62.0) 1,088 (64.1) 159 (57.0) < 0.001
HCV 134 (11.5) 154 (9.1) 23 (8.2)
Alcohol 224 (19.3) 356 (21.0) 87 (31.2)
NAFLD 12 (1.0) 35 (2.1) 1 (0.4)
HBV+HCV 28 (2.4) 29 (1.7) 4 (1.4)
Others 44 (3.8) 33 (2.0) 5 (1.8)
Data are presented as mean ± standard deviation or number (%).
HCC = hepatocellular carcinoma, CTP = Child-Turcotte-Pugh, HBV = hepatitis B virus, HCV = hepatitis C virus, NAFLD = non-alcoholic fatty liver disease.
The incidence of HCC was significantly higher in CTP class A (31.2%) compared with classes B (23.9%) and C (14.3%) (P < 0.001).

HCC development by cirrhosis etiology

There was a significant difference in cause of HCC occurrence (P < 0.001). In HBV cirrhosis patients, 34% (n = 2,545) developed HCC in the follow-up period. However, in alcoholic cirrhosis, only 14.9% (n = 784) of patients showed HCC.
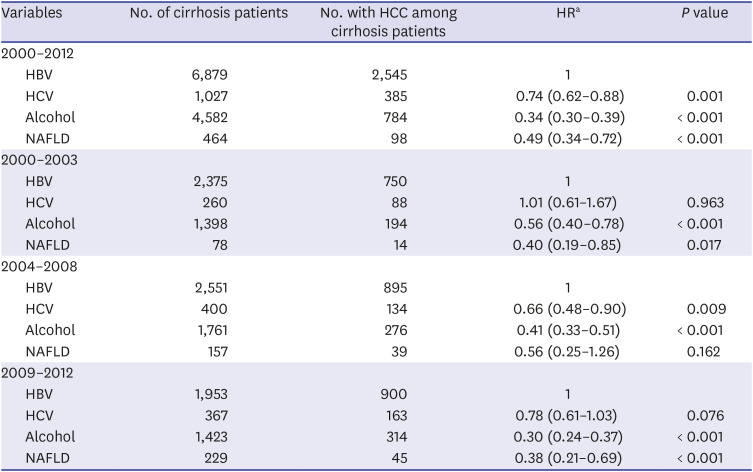
In Kaplan-Meier survival analysis, HBV and HCV cirrhosis had lower HCC-free survival than alcoholic and NAFLD cirrhosis (Fig. 5). Multivariable Cox proportional hazards analyses confirmed that, compared to patients with HBV cirrhosis, those with HCV cirrhosis (HR, 0.74; 95% CI, 0.62–0.88), alcoholic cirrhosis (HR, 0.34; 95% CI, 0.30–0.39) or NAFLD cirrhosis (HR, 0.49; 95% CI, 0.34–0.72) had significantly lower risk of HCC after cirrhosis diagnosis (Table 7).
Fig. 5

Kaplan-Meier curve showing survival free from HCC according to etiology of cirrhosis.

HCC = hepatocellular carcinoma, HBV = hepatitis B virus, HCV = hepatitis C virus, NAFLD = non-alcoholic fatty liver disease.
jkms-35-e233-g005
Table 7

Comparison of risk of HCC development after cirrhosis diagnosis, according to cause of cirrhosis

jkms-35-e233-i007
Variables No. of cirrhosis patients No. with HCC among cirrhosis patients HRa P value
2000–2012
HBV 6,879 2,545 1
HCV 1,027 385 0.74 (0.62–0.88) 0.001
Alcohol 4,582 784 0.34 (0.30–0.39) < 0.001
NAFLD 464 98 0.49 (0.34–0.72) < 0.001
2000–2003
HBV 2,375 750 1
HCV 260 88 1.01 (0.61–1.67) 0.963
Alcohol 1,398 194 0.56 (0.40–0.78) < 0.001
NAFLD 78 14 0.40 (0.19–0.85) 0.017
2004–2008
HBV 2,551 895 1
HCV 400 134 0.66 (0.48–0.90) 0.009
Alcohol 1,761 276 0.41 (0.33–0.51) < 0.001
NAFLD 157 39 0.56 (0.25–1.26) 0.162
2009–2012
HBV 1,953 900 1
HCV 367 163 0.78 (0.61–1.03) 0.076
Alcohol 1,423 314 0.30 (0.24–0.37) < 0.001
NAFLD 229 45 0.38 (0.21–0.69) < 0.001
HCC = hepatocellular carcinoma, HR = hazard ratio, HBV = hepatitis B virus, HCV = hepatitis C virus, NAFLD = non-alcoholic fatty liver disease.
aAdjusted by Cox proportional hazards analysis for age, sex, etiologies of cirrhosis, decompensated cirrhosis (defined as the presence of ascites, hepatic encephalopathy, gastroesophageal varices or hepatorenal syndrome), hemoglobin, platelet count, bilirubin, albumin, and alanine aminotransferase.

DISCUSSION

Despite an increasing total number of patients who visited an outpatient clinic in a tertiary hospital from national data,12 the number of patients diagnosed with cirrhosis significantly decreased from 2001 to 2014 in this study. This is likely the result of some significant interventions: a high rate of domestic hepatitis B vaccination, a recent improvement in the awareness of hepatitis and antiviral drugs.
In this study, we analyzed a total of 15,716 cirrhosis patients with change in etiologies. Cirrhosis patients decreased in age over the 15 study years. This is because hospital accessibility has improved, and high-quality accurate imaging allows easy and fast cirrhosis diagnosis. Hence, many younger patients with chronic liver disease visited a hospital for regular follow up, and healthy young people undergo routine medical checkups, increasing early diagnosis of cirrhosis. Among these cirrhosis patients, the most common cause of cirrhosis in this study was HBV. In Korea, the estimated prevalence of HBV infection was about 3% in the 2016 Korea National Health and Nutrition Examination Survey (KNHANES).13 Since dramatic changes have been made in the treatment of chronic HBV infection after introduction of the HBV vaccination, nationwide screening, and advances in antiviral treatment, the incidence of HBV cirrhosis has decreased over recent years. According to our expectation, development of cirrhosis and deaths due to cirrhosis associated with hepatitis B will continue to decline.
On the other hand, alcoholic cirrhosis was found to be increasing in this study. Alcohol consumption has increased in recent years in Korea. According to WHO reports, alcohol consumption per capita (15+) in Korea has risen from 24th in 2010 to 21st in 2016 among 34 OECD countries. Age-standardized death rates of cirrhosis due to alcohol in 2016 were 18.5 males and 4.5 females per 100,000 population. These values are relatively higher than those of neighboring countries, of which Japan's were 10.9/4.3, and China's were 14.6/8.3.14 The social culture of Korea may contribute to this because drinking is considered a social activity and a part of everyday business. In addition, drinking scenes and advertisements for alcohol beverages are commonly portrayed through broadcasting systems. To date, there have been reports about a significant increase in social costs due to excessive alcohol consumption, which is an important cause of cirrhosis in Korea.1516 We should increase social awareness by establishing effective frameworks for monitoring and surveillance of excessive alcohol consumption. If not, alcohol-related disease, especially cirrhosis, will continue to remain a problem and contribute to increasing economic burden.
Similar to alcoholic cirrhosis, HCV cirrhosis significantly increased over the study period. In Korea, hepatitis C was classified as a Sentinel Surveillance System infectious disease before 2017, though it was difficult to estimate the exact disease burden. During that time, the prevalence of HCV infection in Korea was reported to be 1%–2%.1718 However, the prevalence of patients diagnosed with KCD-6 codes in health care facilities was less than 0.2% compared to the prevalence of diagnoses based on antibodies.6 Before 2017, only about 25%–30% of all hepatitis C infections were diagnosed due to low recognition of the disease. To date, there is low awareness of hepatitis C in not only the general public, but also among doctors. In addition, because most HCV-infected patients have no symptoms, they are diagnosed late and already have complications such as cirrhosis or HCC. Hence, HCV was responsible for approximately 10%–15% of patients with cirrhosis and liver cancer in Korea. In this study, HCV was responsible for 8.3% of patients with cirrhosis in 2014, and the incidence is steadily increasing. Fortunately, hepatitis C has emerged as a public issue that requires a national response based on several outbreaks of HCV infection due to reuse of disposable syringes in health care facilities. After HCV infection was included in the Mandatory Surveillance System of infectious disease, diagnosis has been rapidly increasing. Therefore, strict quality control of invasive procedures in medical institutions and non-medical institutions is carried out at the national level to lower the prevalence of HCV infection and HCV cirrhosis. Moreover, if an economic evaluation of the hepatitis C screening strategy is supported in the future, the anti-HCV test should be added to the general screening test items in the population aged 40 years or older.
The proportion of CTP-A, which is difficult to diagnose, is increasing every year, although the ratio of CTP-C is relatively unchanged. This may be related to increased use of diagnostic tools such as CT and MRI. In recent years, it has been more common to perform abdominal ultrasound in patients with liver disease due to the provision of National Health Insurance in Korea, increasing interest in ultrasound. In patients with cirrhosis, surface nodular hyperplasia and relatively coarse echogenicity can be observed; additionally, when portal hypertension is present, ascites and spleen enlargement are common. Notably, one Korean study showed that it is useful to use the ultrasonographic scoring system to diagnose early alcoholic cirrhosis.19 Screening abdominal ultrasound is expected to allow early diagnosis and improved prognosis of cirrhosis patients with liver disease in Korea.
Diagnosis of HCC was divided into three groups by time period. In the period 2000-2003, HBV was the most common cause of the disease. In Korea, many studies have shown a relatively high proportion of HBV patients diagnosed with HCC in a similar period.202122 This is because HCC commonly develops in elderly adults, and the national immunization system with HBV was applied in 1995 but did not influence the occurrence of HCC. A recent study showed that antiviral treatment with nucleoside/tide analogs has significantly reduced the risk of HCC in HBV patients.23 However, paradoxically, one retrospective study has suggested that antiviral therapy against HBV infection has reduced liver disease mortality markedly, which may prolong life expectancy and increase the number of patients at risk of developing HCC, leading to a growing burden of HCC in an HBV-endemic population.24 Similarly, our study showed a noticeable increase in HCC development among cirrhotic patients in the three cohort groups analyzed. One reason for this is the increased life expectancy of chronic hepatitis and cirrhosis patients, allowing increased likelihood to develop HCC. In addition, increasing awareness of HCC over time or use of diagnostic tools such as MRI and CT might have recently led to an increase in the rate of HCC diagnosis. In our study of HCC sub-analysis, patients of CTP class A (31.2%) had higher HCC incidence rate than those of CTP class C (14.3%). In addition to early diagnosis of CTP class A patients, patients with CTP class C might have shorter survival due to cirrhosis complication such as variceal bleeding, ascites, and hepatic encephalopathy. Within the limitations of our retrospective study, we were able to obtain patient survival data for a total of 5,076 patients. Of these, 616 (73.5%) of 837 expired patients with CTP class C died of cirrhosis complications before HCC was diagnosed, which suggests a higher mortality rate than that of CTP class A (47.3%). Finally, our finding that virus (HBV, HCV)-related cirrhosis had greater risk of HCC than alcohol or NAFLD cirrhosis suggests that hepatitis B and C viruses themselves have a direct carcinogenic effect.252627
This study has many limitations due to its retrospective nature. Although the number of patients was high, the characteristics at baseline were different between the groups and were difficult to control. In addition, the results are limited by definitions of cirrhosis based on KCD-6 codes derived from medical records. These definitions of cirrhosis have been extensively validated and used in research,2428 and diagnosis of cirrhosis in this study was consistent with previous studies based on APRI, other serologic tests and imaging tests, which are easy to confirm from medical records. However, our definition might have resulted in some patients being diagnosed with cirrhosis at a local medical clinic; therefore, our study might overestimate incidence of cirrhosis. The other limitation of our study is the lack of biopsy. It is likely that early cirrhosis patients with preserved liver function and no clinical symptoms were omitted based on our definition. Hence, we likely underestimated the true prevalence of cirrhosis. Such cases of early cirrhosis are difficult to diagnose in the absence of a liver biopsy, which is not performed in most patients. Finally, we could not follow all patients until death because patients did not visit each hospital after diagnosis of cirrhosis or were transferred to primary and secondary hospitals. Hence, we were not able to further analyze competing risk factors and mortality of cirrhosis patients.
In conclusion, although this study confirmed a recent decreasing trends in cirrhosis, the burden of cirrhosis remains in Korea and is associated with increasing morbidity and mortality. HBV, alcohol, HCV, and NAFLD are common cirrhosis etiologies. Our findings can serve to guide future public health strategies. Recently, viral hepatitis with HBV and HCV can be treated with antiviral agent. Targeted screening for at-risk patients will facilitate early detection of liver diseases allowing effective intervention and may have an impact on the development of cirrhosis and its complications. Early diagnosis of cirrhosis patients with active surveillance will improve survival of patients as well. In addition, the increase of alcohol-induced cirrhosis is entirely preventable through appropriate education and the law. Public health strategies focusing on risk factors such as excessive alcohol use and obesity are required to reduce the impact of non-viral liver disease.
Notes

Funding: This research was supported by the Dae-gyung Society of Gastroenterology (2015).

Disclosure: The authors have no potential conflicts of interest to disclose.

Author Contributions:

  • Conceptualization: Chung WJ, Lee HJ, Kweon YO, Park SY, Kim BS.

  • Data curation: Jang WY, Hwang MJ, Tak WY, Lee CH, Suh JI.

  • Formal analysis: Jang WY, Lee SH.

  • Investigation: Kim SH, Park JG.

  • Supervision: Chung WJ, Hwang JS.

  • Writing - original draft: Jang WY, Chung WJ.

  • Writing - review & editing: Chung WJ, Jang BK.

References

1. Statistics Korea. Updated 2018. Accessed December 2018. http://www.kostat.go.kr/portal/korea/kor_nw/5/3/index.action.
2. Statistic Korea. Updated 2018. Accessed July 2019. http://kosis.kr/statHtml/statHtml.do?orgId=101&tblId=DT_1B34E07&conn_path=I2.
3. Wong MC, Huang J. The growing burden of liver cirrhosis: implications for preventive measures. Hepatol Int. 2018; 12(3):201–203. PMID: 29679258.
crossref
4. Yim SY, Kim JH. The epidemiology of hepatitis B virus infection in Korea. Korean J Intern Med. 2019; 34(5):945–953. PMID: 30919608.
crossref
5. Kim BK, Jang ES, Kim JH, Park SY, Ahn SV, Kim HJ, et al. Current status of and strategies for hepatitis C control in South Korea. Clin Mol Hepatol. 2017; 23(3):212–218. PMID: 28942625.
crossref
6. Jeong SH, Jang ES, Choi HY, Kim KA, Chung W, Ki M. Current status of hepatitis C virus infection and countermeasures in South Korea. Epidemiol Health. 2017; 39:e2017017. PMID: 28774165.
crossref
7. Rehm J, Taylor B, Mohapatra S, Irving H, Baliunas D, Patra J, et al. Alcohol as a risk factor for liver cirrhosis: a systematic review and meta-analysis. Drug Alcohol Rev. 2010; 29(4):437–445. PMID: 20636661.
crossref
8. Mokdad AA, Lopez AD, Shahraz S, Lozano R, Mokdad AH, Stanaway J, et al. Liver cirrhosis mortality in 187 countries between 1980 and 2010: a systematic analysis. BMC Med. 2014; 12(1):145. PMID: 25242656.
crossref
9. Hsiang JC, Bai WW, Raos Z, Stableforth W, Upton A, Selvaratnam S, et al. Epidemiology, disease burden and outcomes of cirrhosis in a large secondary care hospital in South Auckland, New Zealand. Intern Med J. 2015; 45(2):160–169. PMID: 25371019.
crossref
10. Scaglione S, Kliethermes S, Cao G, Shoham D, Durazo R, Luke A, et al. The epidemiology of cirrhosis in the United States: a population-based study. J Clin Gastroenterol. 2015; 49(8):690–696. PMID: 25291348.
11. Korean Association for the Study of the Liver (KASL). KASL clinical practice guidelines: management of alcoholic liver disease. Clin Mol Hepatol. 2013; 19(3):216–254. PMID: 24133661.
12. Statistics Korea. Updated 2015. Accessed August 2019. http://kosis.kr/statHtml/statHtml.do?orgId=358&tblId=DT_358N_H402101&conn_path=I2.
13. Cho EJ, Kim SE, Suk KT, An J, Jeong SW, Chung WJ, et al. Current status and strategies for hepatitis B control in Korea. Clin Mol Hepatol. 2017; 23(3):205–211. PMID: 28942624.
crossref
14. WHO statistical information system. Updated 2018. Accessed August 2019. http://www.who.int/substance_abuse/publications/global_alcohol_report/en/.
15. Chung WJ, Chun HJ, Lee SM. Socioeconomic costs of alcohol drinking in Korea. J Prev Med Public Health. 2006; 39(1):21–29. PMID: 16613068.
16. Lee JK, Kim YI, Yoon SJ, Lee JY, Lee H, Park JH, et al. Estimating the burden of diseases due to high alcohol consumption in Korea. J Prev Med Public Health. 2005; 38(2):175–181. PMID: 16315755.
17. Kim DY, Kim IH, Jeong SH, Cho YK, Lee JH, Jin YJ, et al. A nationwide seroepidemiology of hepatitis C virus infection in South Korea. Liver Int. 2013; 33(4):586–594. PMID: 23356674.
crossref
18. Shin HR, Hwang SY, Nam CM. The prevalence of hepatitis C virus infection in Korea: pooled analysis. J Korean Med Sci. 2005; 20(6):985–988. PMID: 16361809.
crossref
19. Moon KM, Baik SK. Usefulness of ultrasonographic scoring system in diagnosis of alcoholic cirrhosis. Clin Ultrasound. 2016; 1(2):92–100.
crossref
20. Kim BK, Kim SU, Park JY, Kim DY, Ahn SH, Park MS, et al. Applicability of BCLC stage for prognostic stratification in comparison with other staging systems: single centre experience from long-term clinical outcomes of 1717 treatment-naïve patients with hepatocellular carcinoma. Liver Int. 2012; 32(7):1120–1127. PMID: 22524688.
crossref
21. Kim BH, Lim YS, Kim EY, Kong HJ, Won YJ, Han S, et al. Temporal improvement in survival of patients with hepatocellular carcinoma in a hepatitis B virus-endemic population. J Gastroenterol Hepatol. 2018; 33(2):475–483. PMID: 28612951.
crossref
22. Kwak HW, Park JW, Nam BH, Yu A, Woo SM, Kim TH, et al. Clinical outcomes of a cohort series of patients with hepatocellular carcinoma in a hepatitis B virus-endemic area. J Gastroenterol Hepatol. 2014; 29(4):820–829. PMID: 24325272.
crossref
23. Sung JJ, Tsoi KK, Wong VW, Li KC, Chan HL. Meta-analysis: Treatment of hepatitis B infection reduces risk of hepatocellular carcinoma. Aliment Pharmacol Ther. 2008; 28(9):1067–1077. PMID: 18657133.
crossref
24. Choi J, Han S, Kim N, Lim YS. Increasing burden of liver cancer despite extensive use of antiviral agents in a hepatitis B virus-endemic population. Hepatology. 2017; 66(5):1454–1463. PMID: 28628942.
crossref
25. Cougot D, Neuveut C, Buendia MA. HBV induced carcinogenesis. J Clin Virol. 2005; 34 Suppl 1:S75–8.
crossref
26. Fung J, Lai CL, Yuen MF. Hepatitis B and C virus-related carcinogenesis. Clin Microbiol Infect. 2009; 15(11):964–970. PMID: 19874379.
crossref
27. Lemon SM, McGivern DR. Is hepatitis C virus carcinogenic? Gastroenterology. 2012; 142(6):1274–1278. PMID: 22537433.
crossref
28. Ioannou GN, Green P, Lowy E, Mun EJ, Berry K. Differences in hepatocellular carcinoma risk, predictors and trends over time according to etiology of cirrhosis. PLoS One. 2018; 13(9):e0204412. PMID: 30260995.
crossref
TOOLS
Similar articles