Journal List > J Korean Med Sci > v.35(27) > 1146067

Kim, Jo, Park, Oh, Yoon, Pyo, and Ock: Updating Disability Weights for Measurement of Healthy Life Expectancy and Disability-adjusted Life Year in Korea

Abstract

Background

The present study aimed to update the methodology to estimate cause-specific disability weight (DW) for the calculation of disability adjusted life year (DALY) and health-adjusted life expectancy (HALE) based on the opinion of medical professional experts. Furthermore, the study also aimed to compare and assess the size of DW according to two analytical methods and estimate the most valid DW from the perspective of years lost due to disability and HALE estimation.

Methods

A self-administered web-based survey was conducted ranking five causes of disease. A total of 901 participants started the survey and response data of 806 participants were used in the analyses. In the process of rescaling predicted probability to DW on a scale from 0 to 1, two models were used for two groups: Group 1 (physicians and medical students) and Group 2 (nurses and oriental medical doctors). In Model 1, predicted probabilities were rescaled according to the normal distribution of DWs. In Model 2, the natural logarithms of predicted probabilities were rescaled according to the asymmetric distribution of DWs.

Results

We estimated DWs for a total of 313 causes of disease in each model and group. The mean of DWs according to the models in each group was 0.490 (Model 1 in Group 1), 0.378 (Model 2 in Group 1), 0.506 (Model 1 in Group 2), and 0.459 (Model 2 in Group 2), respectively. About two-thirds of the causes of disease had DWs of 0.2 to 0.4 in Model 2 in Group 1. In Group 2, but not in Group 1, there were some cases where the DWs had a reversed order of severity.

Conclusion

We attempted to calculate DWs of 313 causes of disease based on the opinions of various types of medical professionals using the previous analysis methods as well as the revised analysis method. The DWs from this study can be used to accurately estimate DALY and health life expectancy, such as HALE, in the Korean population.

Graphical Abstract

jkms-35-e219-abf001.jpg

INTRODUCTION

In healthcare policy and research, summary measures regarding the burden of disease and injuries are needed for priority setting and rational allocation of limited resources (including budget).12 In this context, during the 1990s, Alan D Lopez and Christopher J.L. Murray developed disability adjusted life year (DALY), an indicator that can comprehensively measure the health status of a population. DALY is the sum of years of life lost due to premature death (YLL) and years lost due to disability (YLD).2 DALY is meaningful in that it expresses the health status of a population as a comprehensive quantitative indicator, rather than segmenting it by morbidity and mortality. It is being used as the representative indicator for measuring the global burden of disease in the Global Burden of Disease (GBD) study. In particular, the World Health Organization used YLD, a component of DALY, to estimate health-adjusted life expectancy (HALE), which is used as key evidence when prioritizing policies or allocating budget.
To combine YLL and YLD into the indicator of DALY, YLD must be estimated by the disability weight (DW). DW represents a measured value of specific health status and severity of the disease, with values ranging between 0 (perfect health) and 1 (equivalent to death). Therefore, DW acts as a bridge between disease morbidity and mortality.3 In this context, DW of a specific disease must be set to accurately reflect the average characteristics of that disease. In other words, the relative severity of diseases must be well reflected in DW.
Research on DW has evolved along with the GBD study. In the 1990 GBD study, investigation using visual analogue scale (VAS) and person trade off (PTO) with 10 public health specialists produced DWs for 483 health conditions corresponding to 131 diseases and injuries.4 Since 1996, several studies have been conducted to estimate DW in a variety of countries.35678 However, the methodology, validity, and universality of DW estimation are not adequately clear.910 DWs used in the 2010 GBD study were estimated based on a household questionnaire and online surveys administered to 30,230 people in 5 countries (the United States, Peru, Tanzania, Bangladesh, and Indonesia). Paired comparison and population health equivalence (modified from a PTO) were used as valuation methodologies.11 As an upgrade, the 2013 GBD study used DWs that reflected those from studies conducted in 4 European countries (the Netherlands, Sweden, Hungary, and Italy).12 However, despite such attempts at a methodological upgrade, many scholars still question the validity of methodology for estimating DWs.131415 Nord13 criticized that the agreement between countries for DWs used in the 2010 GBD study was exaggerated. The DW associated with each health condition is currently fixed across all social, cultural, and environmental contexts.16
In this context, there is an ongoing effort since 2000 to estimate DW that reflects the unique social and cultural context of Korea.3171819 Most DW studies conducted in Korea have targeted people who received medical education to allow more objective and broader assessment of disease characteristics.31718 Although reflecting preferences of the general population is required for priority setting and rational allocation of limited resources, the general population may have biases about disease status and may not be able to determine the severity of the diseases that are not very well-known. Therefore, careful consideration of the target population for estimating DWs is important.
Moreover, the issue of the size of DW needs to be studied as well. Although a direct comparison may be difficult, the DWs used in the 2015 Korean National Burden of Disease (KNBD) study showed regular distribution around the value of 0.5 (normal distribution), whereas the DWs used in the GBD study were lower than those of the 2015 KNBD study. For example, Alzheimer disease and other dementias had DW of 0.069, 0.377, and 0.449 for mild, moderate, and severe cases in the GBD study,12 respectively, whereas the DW used in the 2015 KNBD study had the value of 0.736.18 Such a difference can significantly affect the size of YLD and even influence HALE.
The present study aimed to estimate cause-specific DWs based on the opinion of medical professional experts and discuss the differences found. Furthermore, the study also aimed to compare and assess the size of DW according to two analytical methods and estimate the most reasonable DW from the YLD and HALE estimation perspective. Accordingly, the study aimed to derive the Korean version DW update by estimating DWs according to the severity of major diseases.

METHODS

Study design and participants

A self-administered web-based survey was conducted based on the methodology of previous studies for estimating DWs.318 The survey was performed from November 2018 to December 2018. In order to explore the possibility of expanding the participants in the survey, we included nurses and oriental medical doctors as well as physicians and medical students (third or fourth grade of a regular course). Participants were recruited through the promotion of the survey in the online community site for medical professionals and by word-of-mouth from other participants.

Valuation method and causes of disease

First, participants responded to their age group, sex, occupation, and specialty. Next, the participants assessed the severity of the causes of disease by using a ranking method. We used the complete ranking method listing five alternatives in view of the effectiveness and feasibility demonstrated in previous studies.31820 The participants ranked the five listed causes of disease in order of good health, considering the seriousness of the physical and mental problems caused by the diseases. The descriptions of the causes of disease were not presented to the participants and they judged the severity by looking at the names of the presented causes of disease.
A total of 313 causes of disease were used in this survey. The list of causes of disease utilized in this study is based on the GBD 2016 study.21 In the GBD 2016 study, DALY and YLD were calculated for 333 and 328 causes of disease, respectively. After reviewing the list of the causes of disease from GBD 2016 study, 277 causes of disease were selected after considering duplication of causes of disease and the possibility of emerging causes of disease in Korea. Among the 277 causes of disease, 14 causes of diseases were subdivided by the degree of severity. For example, major depressive disorder was subdivided into ‘major depressive disorder (mild),’ ‘major depressive disorder (moderate),’ and ‘major depressive disorder (severe).’ In the case of diabetes mellitus, the severity was classified as the presence (‘diabetes mellitus with complications’) or absence of complications (‘diabetes mellitus without complications’). Furthermore, ‘allergic rhinitis,’ ‘atopic dermatitis,’ and ‘metabolic syndrome,’ which were not included in the GBD 2016 study, were included in the list to calculate the magnitude of the problem in Korean National Burden of Disease study. ‘Full health’ and ‘being dead’ were also included in the list to identify participants who made illogical responses and to use them as anchor points in the analyses.
Participants conducted a total of 20 ranking methods to evaluate five alternatives. Among the 311 causes of disease (excluding ‘full health’ and ‘being dead’), 5 randomly selected causes of disease were given to participants in each ranking method question. However, ‘full health’ was fixed as the first cause of disease in question 1 and the fifth cause of disease in question 11. Similarly, ‘being dead’ was fixed as the first cause of disease in question 5, fifth cause of disease in question 10, the first cause of disease in question 15, and the fifth cause of disease in question 20.

Analysis

Descriptive analyses were performed to determine the socio-demographic characteristics of the participants. Before proceeding with the analyses of DWs, only the responses of participants who answered ‘full health’ in questions 1 and 11 with the best health state were included in the analyses. Then, the ranked data were converted into paired comparison data in accordance with previous studies.31820 For example, if the response of a participant was in the order of C1-C2-C3-C4-C5, it was converted to C1-C2, C1-C3, C1-C4, C1-C5, C2-C3, C2-C4, C2-C5, C3-C4, C3-C5, and C4-C5. Thus, paired comparison data were obtained by ranking method listing five alternatives. Probit regression analysis was conducted with these paired comparison data. The stated preference of the first cause of disease in the paired comparison was regarded as the dependent variable. The two causes of disease that were compared were considered as independent variables and ‘being dead’ was treated as a reference of the dummy variable. Using the coefficient estimates of the probit regression, the predicted probabilities of causes of disease were calculated.
In the process of rescaling predicted probability to DW on a scale from 0 to 1, two models were used. Model 1 was to rescale considering the normal distribution of DWs as in previous studies.318 In Model 2, predicted probabilities taking the natural logarithm were rescaled considering the asymmetric distribution of DWs. ‘Being dead (1)’ and ‘full health (0)’ were used as anchor points in both Models. Subgroup analyses were also performed according to the occupation of participants. Group 1 comprised physicians and medical students as in the previous studies,318 whereas Group 2 comprised nurses and oriental medical doctors. We determined the frequency distributions of the DWs from the models and calculated the Pearson correlation coefficients to compare the DWs from the models to those obtained in the most recent Korean DWs study.18
We used Stata 13.1 software (StataCorp, College Station, TX, USA) for all statistical analyses. In this study, P value less than 0.05 was regarded as statistically significant.

Ethics statement

This study was approved by the Institutional Review Board (IRB) of the Ulsan University Hospital (IRB No. 2018-11-034). All participants were informed about the purpose and process of the study and only those who agreed to participate joined this survey. Each participant received a 9,000 won coffee coupon.

RESULTS

A total of 901 participants started the survey and 872 participants completed the survey. Among 872 participants, 66 participants were excluded from the analyses due to illogical responses such as ‘full health’ was not listed as the best health state. Table 1 summarized the details of the socio-demographic characteristics of 806 participants used in the analyses. Most participants were in the 30s and about 70% were male. About two-thirds of the participants were specialists and there were more medical specialists than surgical specialists. Group 1 comprised only physicians and medical students and group 2 comprised only nurses and oriental medical doctors and included were 682 and 124 participants, respectively.
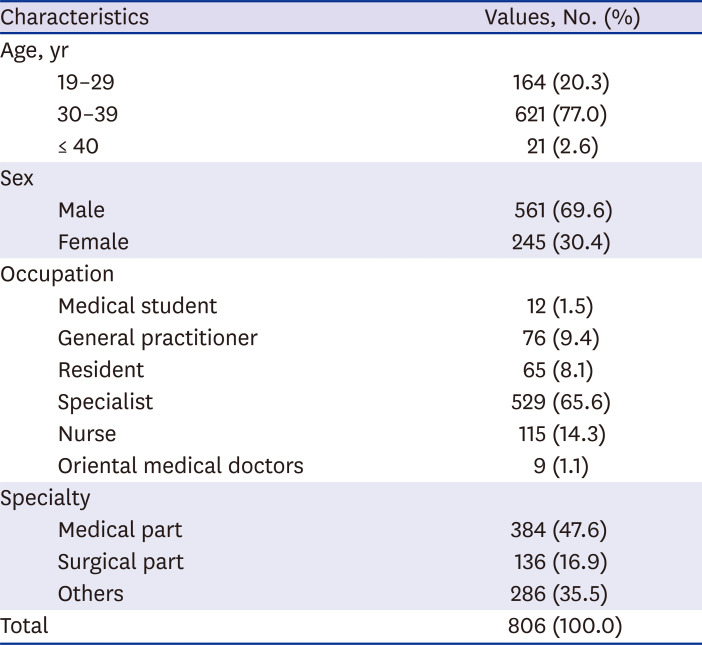
Table 1

Characteristics of the study participants

jkms-35-e219-i001
Characteristics Values, No. (%)
Age, yr
19–29 164 (20.3)
30–39 621 (77.0)
≤ 40 21 (2.6)
Sex
Male 561 (69.6)
Female 245 (30.4)
Occupation
Medical student 12 (1.5)
General practitioner 76 (9.4)
Resident 65 (8.1)
Specialist 529 (65.6)
Nurse 115 (14.3)
Oriental medical doctors 9 (1.1)
Specialty
Medical part 384 (47.6)
Surgical part 136 (16.9)
Others 286 (35.5)
Total 806 (100.0)
Table 2 shows the DWs by the model of analysis for each group. The mean of the DWs according to the models in each group was 0.490 (Model 1 in Group 1), 0.378 (Model 2 in Group 1), 0.506 (Model 1 in Group 2), and 0.459 (Model 2 in Group 2), respectively. In all analyses, ‘Pancreatic cancer’ had the highest DW as follows: 0.929 (Model 1 in Group 1), 0.724 (Model 2 in Group 1), 0.996 (Model 1 in Group 2), and 0.986 (Model 2 in Group 2). On the other hand, the cause of the disease with the lowest DW was acne vulgaris in Model 1 in Group 1 (0.059) and Model 2 in Group 1 (0.229). Cause of disease with the lowest DW differed according to the analysis method. Acne vulgaris, caries of deciduous teeth, and allergic rhinitis had low DWs overall.
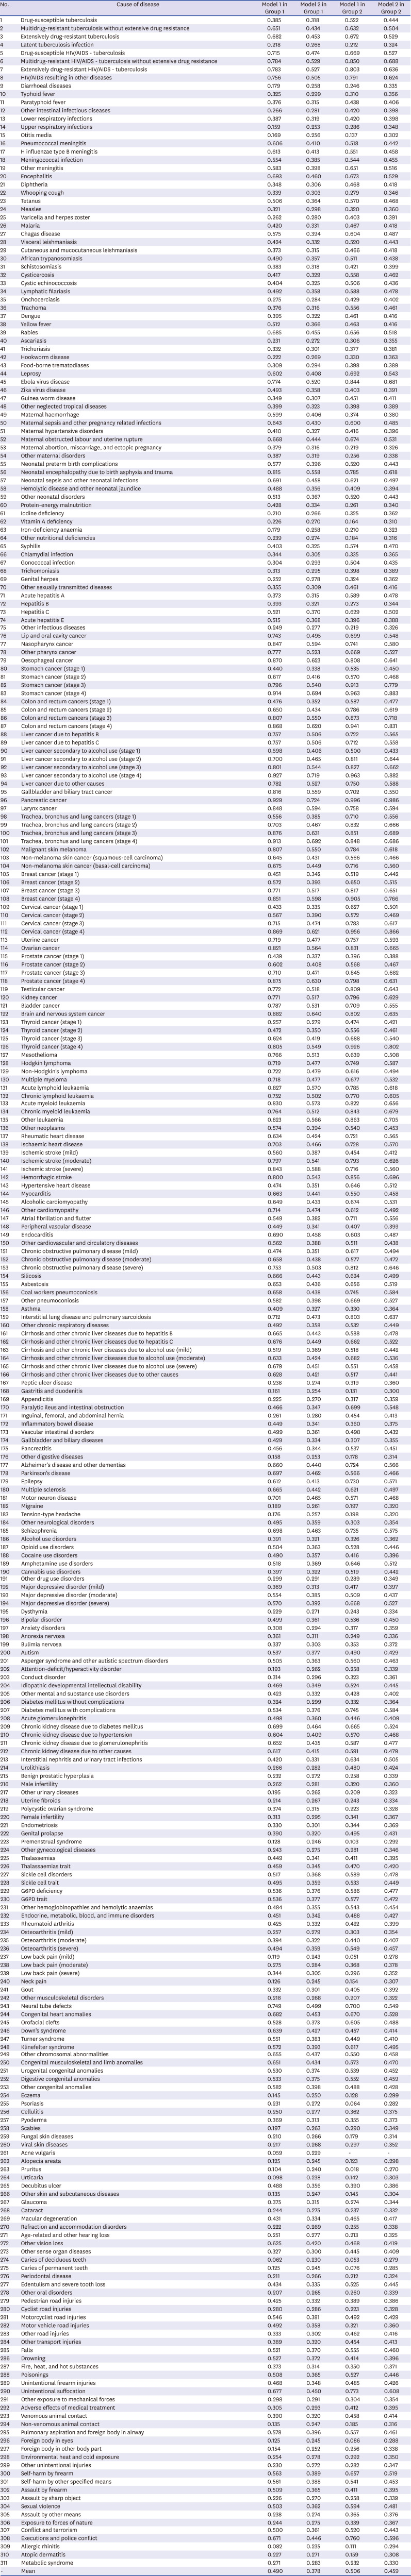
Table 2

Disability weights from each model for the subgroups

jkms-35-e219-i002
No. Cause of disease Model 1 in Group 1 Model 2 in Group 1 Model 1 in Group 2 Model 2 in Group 2
1 Drug-susceptible tuberculosis 0.385 0.318 0.522 0.444
2 Multidrug-resistant tuberculosis without extensive drug resistance 0.651 0.434 0.632 0.504
3 Extensively drug-resistant tuberculosis 0.682 0.453 0.672 0.529
4 Latent tuberculosis infection 0.218 0.268 0.212 0.324
5 Drug-susceptible HIV/AIDS - tuberculosis 0.715 0.474 0.669 0.527
6 Multidrug-resistant HIV/AIDS - tuberculosis without extensive drug resistance 0.784 0.529 0.850 0.688
7 Extensively drug-resistant HIV/AIDS - tuberculosis 0.783 0.527 0.803 0.636
8 HIV/AIDS resulting in other diseases 0.756 0.505 0.791 0.624
9 Diarrhoeal diseases 0.179 0.258 0.246 0.335
10 Typhoid fever 0.325 0.299 0.310 0.356
11 Paratyphoid fever 0.376 0.315 0.438 0.406
12 Other intestinal infectious diseases 0.266 0.281 0.420 0.398
13 Lower respiratory infections 0.387 0.319 0.420 0.398
14 Upper respiratory infections 0.159 0.253 0.286 0.348
15 Otitis media 0.169 0.256 0.137 0.302
16 Pneumococcal meningitis 0.606 0.410 0.518 0.442
17 H influenzae type B meningitis 0.613 0.413 0.551 0.458
18 Meningococcal infection 0.554 0.385 0.544 0.455
19 Other meningitis 0.583 0.398 0.651 0.516
20 Encephalitis 0.693 0.460 0.673 0.529
21 Diphtheria 0.348 0.306 0.468 0.418
22 Whooping cough 0.339 0.303 0.279 0.346
23 Tetanus 0.506 0.364 0.570 0.468
24 Measles 0.321 0.298 0.320 0.360
25 Varicella and herpes zoster 0.262 0.280 0.403 0.391
26 Malaria 0.420 0.331 0.467 0.418
27 Chagas disease 0.575 0.394 0.604 0.487
28 Visceral leishmaniasis 0.424 0.332 0.520 0.443
29 Cutaneous and mucocutaneous leishmaniasis 0.373 0.315 0.466 0.418
30 African trypanosomiasis 0.490 0.357 0.511 0.438
31 Schistosomiasis 0.383 0.318 0.421 0.399
32 Cysticercosis 0.417 0.329 0.558 0.462
33 Cystic echinococcosis 0.404 0.325 0.506 0.436
34 Lymphatic filariasis 0.492 0.358 0.588 0.478
35 Onchocerciasis 0.275 0.284 0.429 0.402
36 Trachoma 0.376 0.316 0.556 0.461
37 Dengue 0.395 0.322 0.461 0.416
38 Yellow fever 0.512 0.366 0.463 0.416
39 Rabies 0.685 0.455 0.656 0.518
40 Ascariasis 0.231 0.272 0.306 0.355
41 Trichuriasis 0.332 0.301 0.377 0.381
42 Hookworm disease 0.222 0.269 0.330 0.363
43 Food-borne trematodiases 0.309 0.294 0.398 0.389
44 Leprosy 0.602 0.408 0.692 0.543
45 Ebola virus disease 0.774 0.520 0.844 0.681
46 Zika virus disease 0.493 0.358 0.403 0.391
47 Guinea worm disease 0.349 0.307 0.451 0.411
48 Other neglected tropical diseases 0.399 0.323 0.398 0.389
49 Maternal haemorrhage 0.599 0.406 0.374 0.380
50 Maternal sepsis and other pregnancy related infections 0.643 0.430 0.600 0.485
51 Maternal hypertensive disorders 0.410 0.327 0.416 0.396
52 Maternal obstructed labour and uterine rupture 0.668 0.444 0.674 0.531
53 Maternal abortion, miscarriage, and ectopic pregnancy 0.379 0.316 0.219 0.326
54 Other maternal disorders 0.387 0.319 0.256 0.338
55 Neonatal preterm birth complications 0.577 0.396 0.520 0.443
56 Neonatal encephalopathy due to birth asphyxia and trauma 0.815 0.558 0.785 0.618
57 Neonatal sepsis and other neonatal infections 0.691 0.458 0.621 0.497
58 Hemolytic disease and other neonatal jaundice 0.488 0.356 0.409 0.394
59 Other neonatal disorders 0.513 0.367 0.520 0.443
60 Protein-energy malnutrition 0.428 0.334 0.261 0.340
61 Iodine deficiency 0.210 0.266 0.325 0.362
62 Vitamin A deficiency 0.226 0.270 0.164 0.310
63 Iron-deficiency anaemia 0.179 0.258 0.210 0.323
64 Other nutritional deficiencies 0.239 0.274 0.184 0.316
65 Syphilis 0.403 0.325 0.574 0.470
66 Chlamydial infection 0.344 0.305 0.335 0.365
67 Gonococcal infection 0.304 0.293 0.504 0.435
68 Trichomoniasis 0.313 0.295 0.398 0.389
69 Genital herpes 0.252 0.278 0.324 0.362
70 Other sexually transmitted diseases 0.355 0.309 0.461 0.416
71 Acute hepatitis A 0.373 0.315 0.589 0.478
72 Hepatitis B 0.393 0.321 0.273 0.344
73 Hepatitis C 0.521 0.370 0.629 0.502
74 Acute hepatitis E 0.515 0.368 0.396 0.388
75 Other infectious diseases 0.249 0.277 0.219 0.326
76 Lip and oral cavity cancer 0.743 0.495 0.699 0.548
77 Nasopharynx cancer 0.847 0.594 0.741 0.580
78 Other pharynx cancer 0.777 0.523 0.669 0.527
79 Oesophageal cancer 0.870 0.623 0.808 0.641
80 Stomach cancer (stage 1) 0.440 0.338 0.535 0.450
81 Stomach cancer (stage 2) 0.617 0.416 0.570 0.468
82 Stomach cancer (stage 3) 0.796 0.540 0.913 0.779
83 Stomach cancer (stage 4) 0.914 0.694 0.963 0.883
84 Colon and rectum cancers (stage 1) 0.476 0.352 0.587 0.477
85 Colon and rectum cancers (stage 2) 0.650 0.434 0.786 0.619
86 Colon and rectum cancers (stage 3) 0.807 0.550 0.873 0.718
87 Colon and rectum cancers (stage 4) 0.868 0.620 0.941 0.831
88 Liver cancer due to hepatitis B 0.757 0.506 0.722 0.565
89 Liver cancer due to hepatitis C 0.757 0.506 0.712 0.558
90 Liver cancer secondary to alcohol use (stage 1) 0.598 0.406 0.500 0.433
91 Liver cancer secondary to alcohol use (stage 2) 0.700 0.465 0.811 0.644
92 Liver cancer secondary to alcohol use (stage 3) 0.801 0.544 0.827 0.662
93 Liver cancer secondary to alcohol use (stage 4) 0.927 0.719 0.963 0.882
94 Liver cancer due to other causes 0.782 0.527 0.750 0.588
95 Gallbladder and biliary tract cancer 0.816 0.559 0.702 0.550
96 Pancreatic cancer 0.929 0.724 0.996 0.986
97 Larynx cancer 0.848 0.594 0.758 0.594
98 Trachea, bronchus and lung cancers (stage 1) 0.556 0.385 0.710 0.556
99 Trachea, bronchus and lung cancers (stage 2) 0.703 0.467 0.832 0.666
100 Trachea, bronchus and lung cancers (stage 3) 0.876 0.631 0.851 0.689
101 Trachea, bronchus and lung cancers (stage 4) 0.913 0.692 0.848 0.686
102 Malignant skin melanoma 0.807 0.550 0.784 0.618
103 Non-melanoma skin cancer (squamous-cell carcinoma) 0.645 0.431 0.566 0.466
104 Non-melanoma skin cancer (basal-cell carcinoma) 0.675 0.449 0.716 0.560
105 Breast cancer (stage 1) 0.451 0.342 0.519 0.442
106 Breast cancer (stage 2) 0.572 0.393 0.650 0.515
107 Breast cancer (stage 3) 0.771 0.517 0.817 0.651
108 Breast cancer (stage 4) 0.851 0.598 0.905 0.766
109 Cervical cancer (stage 1) 0.433 0.335 0.627 0.501
110 Cervical cancer (stage 2) 0.567 0.390 0.572 0.469
111 Cervical cancer (stage 3) 0.715 0.474 0.783 0.617
112 Cervical cancer (stage 4) 0.869 0.621 0.956 0.866
113 Uterine cancer 0.719 0.477 0.757 0.593
114 Ovarian cancer 0.821 0.564 0.831 0.665
115 Prostate cancer (stage 1) 0.439 0.337 0.396 0.388
116 Prostate cancer (stage 2) 0.602 0.408 0.568 0.467
117 Prostate cancer (stage 3) 0.710 0.471 0.845 0.682
118 Prostate cancer (stage 4) 0.875 0.630 0.798 0.631
119 Testicular cancer 0.772 0.518 0.809 0.643
120 Kidney cancer 0.771 0.517 0.796 0.629
121 Bladder cancer 0.787 0.531 0.709 0.555
122 Brain and nervous system cancer 0.882 0.640 0.802 0.635
123 Thyroid cancer (stage 1) 0.257 0.279 0.474 0.421
124 Thyroid cancer (stage 2) 0.472 0.350 0.556 0.461
125 Thyroid cancer (stage 3) 0.624 0.419 0.688 0.540
126 Thyroid cancer (stage 4) 0.805 0.549 0.926 0.802
127 Mesothelioma 0.766 0.513 0.639 0.508
128 Hodgkin lymphoma 0.719 0.477 0.749 0.587
129 Non-Hodgkin's lymphoma 0.722 0.479 0.616 0.494
130 Multiple myeloma 0.718 0.477 0.677 0.532
131 Acute lymphoid leukaemia 0.827 0.570 0.785 0.618
132 Chronic lymphoid leukaemia 0.752 0.502 0.770 0.605
133 Acute myeloid leukaemia 0.830 0.573 0.822 0.656
134 Chronic myeloid leukaemia 0.764 0.512 0.843 0.679
135 Other leukaemia 0.823 0.566 0.863 0.705
136 Other neoplasms 0.574 0.394 0.540 0.453
137 Rheumatic heart disease 0.634 0.424 0.721 0.565
138 Ischaemic heart disease 0.703 0.466 0.728 0.570
139 Ischemic stroke (mild) 0.560 0.387 0.454 0.412
140 Ischemic stroke (moderate) 0.797 0.541 0.793 0.626
141 Ischemic stroke (severe) 0.843 0.588 0.716 0.560
142 Hemorrhagic stroke 0.800 0.543 0.856 0.696
143 Hypertensive heart disease 0.474 0.351 0.646 0.512
144 Myocarditis 0.663 0.441 0.550 0.458
145 Alcoholic cardiomyopathy 0.649 0.433 0.674 0.531
146 Other cardiomyopathy 0.714 0.474 0.612 0.492
147 Atrial fibrillation and flutter 0.549 0.382 0.711 0.556
148 Peripheral vascular disease 0.449 0.341 0.407 0.393
149 Endocarditis 0.690 0.458 0.603 0.487
150 Other cardiovascular and circulatory diseases 0.562 0.388 0.511 0.438
151 Chronic obstructive pulmonary disease (mild) 0.474 0.351 0.617 0.494
152 Chronic obstructive pulmonary disease (moderate) 0.658 0.438 0.577 0.472
153 Chronic obstructive pulmonary disease (severe) 0.753 0.503 0.812 0.646
154 Silicosis 0.666 0.443 0.624 0.499
155 Asbestosis 0.653 0.436 0.656 0.519
156 Coal workers pneumoconiosis 0.658 0.438 0.745 0.584
157 Other pneumoconiosis 0.582 0.398 0.669 0.527
158 Asthma 0.409 0.327 0.330 0.364
159 Interstitial lung disease and pulmonary sarcoidosis 0.712 0.473 0.803 0.637
160 Other chronic respiratory diseases 0.492 0.358 0.532 0.449
161 Cirrhosis and other chronic liver diseases due to hepatitis B 0.665 0.443 0.588 0.478
162 Cirrhosis and other chronic liver diseases due to hepatitis C 0.676 0.449 0.662 0.522
163 Cirrhosis and other chronic liver diseases due to alcohol use (mild) 0.519 0.369 0.518 0.442
164 Cirrhosis and other chronic liver diseases due to alcohol use (moderate) 0.633 0.424 0.682 0.536
165 Cirrhosis and other chronic liver diseases due to alcohol use (severe) 0.679 0.451 0.551 0.458
166 Cirrhosis and other chronic liver diseases due to other causes 0.628 0.421 0.517 0.441
167 Peptic ulcer disease 0.238 0.274 0.319 0.360
168 Gastritis and duodenitis 0.161 0.254 0.131 0.300
169 Appendicitis 0.225 0.270 0.317 0.359
170 Paralytic ileus and intestinal obstruction 0.466 0.347 0.699 0.548
171 Inguinal, femoral, and abdominal hernia 0.261 0.280 0.454 0.413
172 Inflammatory bowel disease 0.449 0.341 0.360 0.375
173 Vascular intestinal disorders 0.499 0.361 0.498 0.432
174 Gallbladder and biliary diseases 0.429 0.334 0.307 0.355
175 Pancreatitis 0.456 0.344 0.537 0.451
176 Other digestive diseases 0.158 0.253 0.178 0.314
177 Alzheimer's disease and other dementias 0.660 0.440 0.724 0.566
178 Parkinson's disease 0.697 0.462 0.566 0.466
179 Epilepsy 0.612 0.413 0.730 0.571
180 Multiple sclerosis 0.665 0.442 0.621 0.497
181 Motor neuron disease 0.701 0.465 0.571 0.468
182 Migraine 0.189 0.261 0.197 0.320
183 Tension-type headache 0.176 0.257 0.198 0.320
184 Other neurological disorders 0.495 0.359 0.303 0.354
185 Schizophrenia 0.698 0.463 0.735 0.575
186 Alcohol use disorders 0.391 0.321 0.326 0.362
187 Opioid use disorders 0.504 0.363 0.528 0.446
188 Cocaine use disorders 0.490 0.357 0.416 0.396
189 Amphetamine use disorders 0.518 0.369 0.646 0.512
190 Cannabis use disorders 0.397 0.322 0.519 0.442
191 Other drug use disorders 0.299 0.291 0.289 0.349
192 Major depressive disorder (mild) 0.369 0.313 0.417 0.397
193 Major depressive disorder (moderate) 0.554 0.385 0.509 0.437
194 Major depressive disorder (severe) 0.570 0.392 0.668 0.527
195 Dysthymia 0.229 0.271 0.243 0.334
196 Bipolar disorder 0.499 0.361 0.536 0.450
197 Anxiety disorders 0.308 0.294 0.317 0.359
198 Anorexia nervosa 0.361 0.311 0.249 0.336
199 Bulimia nervosa 0.337 0.303 0.353 0.372
200 Autism 0.537 0.377 0.490 0.429
201 Asperger syndrome and other autistic spectrum disorders 0.505 0.363 0.560 0.463
202 Attention-deficit/hyperactivity disorder 0.193 0.262 0.258 0.339
203 Conduct disorder 0.314 0.296 0.323 0.361
204 Idiopathic developmental intellectual disability 0.469 0.349 0.524 0.445
205 Other mental and substance use disorders 0.423 0.332 0.428 0.402
206 Diabetes mellitus without complications 0.324 0.299 0.332 0.364
207 Diabetes mellitus with complications 0.534 0.376 0.745 0.584
208 Acute glomerulonephritis 0.498 0.360 0.446 0.409
209 Chronic kidney disease due to diabetes mellitus 0.699 0.464 0.665 0.524
210 Chronic kidney disease due to hypertension 0.604 0.409 0.570 0.468
211 Chronic kidney disease due to glomerulonephritis 0.652 0.435 0.587 0.477
212 Chronic kidney disease due to other causes 0.617 0.415 0.591 0.479
213 Interstitial nephritis and urinary tract infections 0.420 0.331 0.634 0.505
214 Urolithiasis 0.266 0.282 0.480 0.424
215 Benign prostatic hyperplasia 0.232 0.272 0.258 0.339
216 Male infertility 0.262 0.281 0.320 0.360
217 Other urinary diseases 0.195 0.262 0.209 0.323
218 Uterine fibroids 0.214 0.267 0.243 0.334
219 Polycystic ovarian syndrome 0.374 0.315 0.223 0.328
220 Female infertility 0.313 0.295 0.341 0.367
221 Endometriosis 0.330 0.301 0.344 0.369
222 Genital prolapse 0.390 0.320 0.495 0.431
223 Premenstrual syndrome 0.128 0.246 0.103 0.292
224 Other gynecological diseases 0.243 0.275 0.281 0.346
225 Thalassemias 0.449 0.341 0.411 0.395
226 Thalassaemias trait 0.459 0.345 0.470 0.420
227 Sickle cell disorders 0.517 0.368 0.589 0.478
228 Sickle cell trait 0.495 0.359 0.533 0.449
229 G6PD deficiency 0.536 0.376 0.586 0.477
230 G6PD trait 0.536 0.377 0.577 0.472
231 Other hemoglobinopathies and hemolytic anaemias 0.484 0.355 0.543 0.454
232 Endocrine, metabolic, blood, and immune disorders 0.451 0.342 0.488 0.427
233 Rheumatoid arthritis 0.425 0.332 0.422 0.399
234 Osteoarthritis (mild) 0.257 0.279 0.303 0.354
235 Osteoarthritis (moderate) 0.394 0.322 0.440 0.407
236 Osteoarthritis (severe) 0.494 0.359 0.549 0.457
237 Low back pain (mild) 0.119 0.243 0.051 0.278
238 Low back pain (moderate) 0.275 0.284 0.368 0.378
239 Low back pain (severe) 0.344 0.305 0.296 0.352
240 Neck pain 0.126 0.245 0.154 0.307
241 Gout 0.332 0.301 0.405 0.392
242 Other musculoskeletal disorders 0.218 0.268 0.207 0.322
243 Neural tube defects 0.749 0.499 0.700 0.549
244 Congenital heart anomalies 0.682 0.453 0.670 0.528
245 Orofacial clefts 0.528 0.373 0.605 0.488
246 Down's syndrome 0.639 0.427 0.457 0.414
247 Turner syndrome 0.551 0.383 0.449 0.410
248 Klinefelter syndrome 0.572 0.393 0.617 0.495
249 Other chromosomal abnormalities 0.655 0.437 0.550 0.458
250 Congenital musculoskeletal and limb anomalies 0.651 0.434 0.573 0.470
251 Urogenital congenital anomalies 0.530 0.374 0.539 0.452
252 Digestive congenital anomalies 0.533 0.375 0.552 0.459
253 Other congenital anomalies 0.582 0.398 0.488 0.428
254 Eczema 0.145 0.250 0.128 0.299
255 Psoriasis 0.231 0.272 0.064 0.282
256 Cellulitis 0.250 0.277 0.362 0.375
257 Pyoderma 0.369 0.313 0.355 0.373
258 Scabies 0.197 0.263 0.290 0.349
259 Fungal skin diseases 0.210 0.266 0.179 0.314
260 Viral skin diseases 0.217 0.268 0.297 0.352
261 Acne vulgaris 0.059 0.229 - -
262 Alopecia areata 0.125 0.245 0.123 0.298
263 Pruritus 0.104 0.240 0.018 0.270
264 Urticaria 0.098 0.238 0.142 0.303
265 Decubitus ulcer 0.488 0.356 0.390 0.386
266 Other skin and subcutaneous diseases 0.135 0.247 0.145 0.304
267 Glaucoma 0.375 0.315 0.274 0.344
268 Cataract 0.244 0.275 0.237 0.332
269 Macular degeneration 0.431 0.334 0.465 0.417
270 Refraction and accommodation disorders 0.222 0.269 0.255 0.338
271 Age-related and other hearing loss 0.251 0.277 0.213 0.325
272 Other vision loss 0.625 0.420 0.468 0.419
273 Other sense organ diseases 0.327 0.300 0.445 0.409
274 Caries of deciduous teeth 0.062 0.230 0.053 0.279
275 Caries of permanent teeth 0.125 0.245 0.076 0.285
276 Periodontal disease 0.211 0.266 0.212 0.324
277 Edentulism and severe tooth loss 0.434 0.335 0.525 0.445
278 Other oral disorders 0.207 0.265 0.260 0.339
279 Pedestrian road injuries 0.425 0.332 0.389 0.386
280 Cyclist road injuries 0.280 0.286 0.223 0.328
281 Motorcyclist road injuries 0.546 0.381 0.492 0.429
282 Motor vehicle road injuries 0.492 0.358 0.321 0.360
283 Other road injuries 0.333 0.302 0.462 0.416
284 Other transport injuries 0.389 0.320 0.454 0.413
285 Falls 0.521 0.370 0.555 0.460
286 Drowning 0.527 0.372 0.414 0.396
287 Fire, heat, and hot substances 0.373 0.314 0.350 0.371
288 Poisonings 0.508 0.365 0.527 0.446
289 Unintentional firearm injuries 0.468 0.348 0.485 0.426
290 Unintentional suffocation 0.677 0.450 0.773 0.608
291 Other exposure to mechanical forces 0.298 0.291 0.304 0.354
292 Adverse effects of medical treatment 0.305 0.293 0.412 0.395
293 Venomous animal contact 0.390 0.320 0.458 0.414
294 Non-venomous animal contact 0.135 0.247 0.185 0.316
295 Pulmonary aspiration and foreign body in airway 0.578 0.396 0.557 0.461
296 Foreign body in eyes 0.125 0.245 0.086 0.288
297 Foreign body in other body part 0.154 0.252 0.256 0.338
298 Environmental heat and cold exposure 0.254 0.278 0.292 0.350
299 Other unintentional injuries 0.230 0.272 0.282 0.347
300 Self-harm by firearm 0.563 0.389 0.657 0.519
301 Self-harm by other specified means 0.561 0.388 0.541 0.453
302 Assault by firearm 0.509 0.365 0.411 0.395
303 Assault by sharp object 0.226 0.270 0.258 0.339
304 Sexual violence 0.503 0.362 0.594 0.481
305 Assault by other means 0.238 0.274 0.365 0.376
306 Exposure to forces of nature 0.244 0.275 0.339 0.367
307 Conflict and terrorism 0.500 0.361 0.520 0.443
308 Executions and police conflict 0.671 0.446 0.760 0.596
309 Allergic rhinitis 0.082 0.235 0.111 0.294
310 Atopic dermatitis 0.227 0.271 0.159 0.308
311 Metabolic syndrome 0.271 0.283 0.232 0.330
- Mean 0.490 0.378 0.506 0.459
HIV/AIDS = Human immunodeficiency virus infection and acquired immune deficiency syndrome.
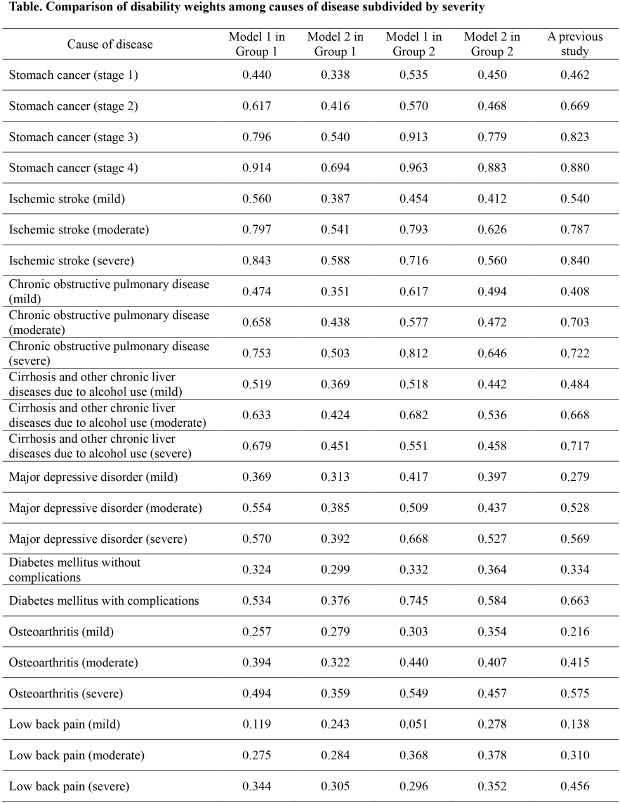
The DWs of causes of disease that were classified by severity are shown in Table 3. Furthermore, Table 3 also shows the DWs calculated from a previous study for comparison.3 In the results of Group 1, there was no case where the DWs were reversed according to severity. However, in Group 2, there were some cases in which DWs were reversed according to severity. For example, among the results of ‘Model 2 in Group 2,’ the DW of ‘Ischemic stroke (moderate)’ was 0.626, but that of ‘Ischemic stroke (severe)’ was 0.560. In addition, the results of Model 2 showed that the DWs were generally low in causes of disease with high severity, compared with those from a previous study. For example, in the case of ‘trachea, bronchus, and lung cancers (stage 4),’ the DW of the previous study was 0.906, but that of ‘Model 2 in Group 1’ was estimated to be 0.692.
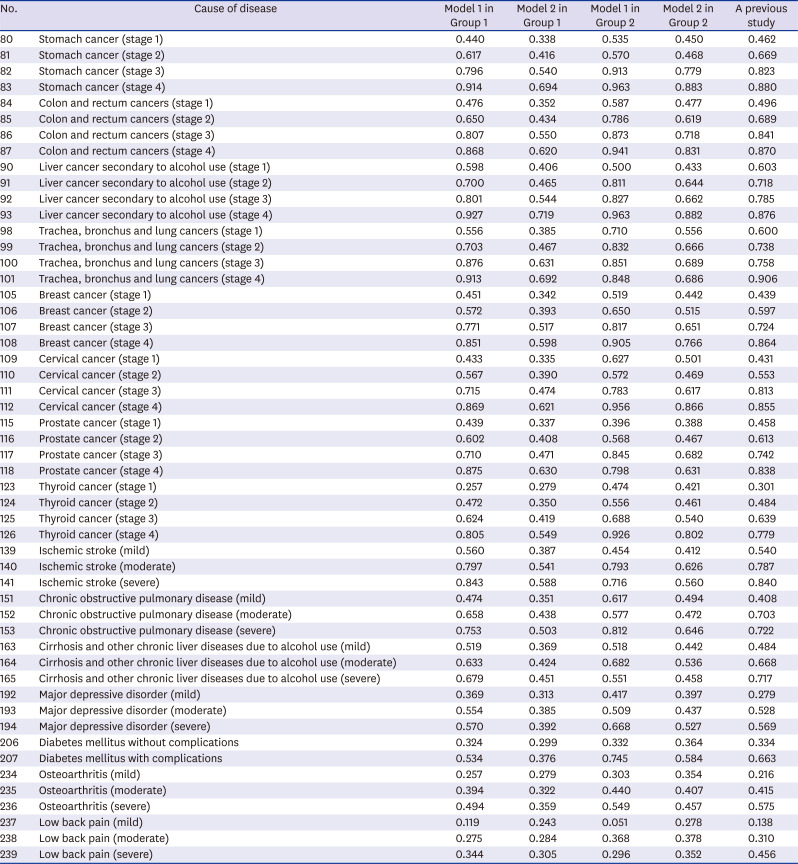
Table 3

Comparison of disability weights among causes of disease subdivided by severity

jkms-35-e219-i003
No. Cause of disease Model 1 in Group 1 Model 2 in Group 1 Model 1 in Group 2 Model 2 in Group 2 A previous study
80 Stomach cancer (stage 1) 0.440 0.338 0.535 0.450 0.462
81 Stomach cancer (stage 2) 0.617 0.416 0.570 0.468 0.669
82 Stomach cancer (stage 3) 0.796 0.540 0.913 0.779 0.823
83 Stomach cancer (stage 4) 0.914 0.694 0.963 0.883 0.880
84 Colon and rectum cancers (stage 1) 0.476 0.352 0.587 0.477 0.496
85 Colon and rectum cancers (stage 2) 0.650 0.434 0.786 0.619 0.689
86 Colon and rectum cancers (stage 3) 0.807 0.550 0.873 0.718 0.841
87 Colon and rectum cancers (stage 4) 0.868 0.620 0.941 0.831 0.870
90 Liver cancer secondary to alcohol use (stage 1) 0.598 0.406 0.500 0.433 0.603
91 Liver cancer secondary to alcohol use (stage 2) 0.700 0.465 0.811 0.644 0.718
92 Liver cancer secondary to alcohol use (stage 3) 0.801 0.544 0.827 0.662 0.785
93 Liver cancer secondary to alcohol use (stage 4) 0.927 0.719 0.963 0.882 0.876
98 Trachea, bronchus and lung cancers (stage 1) 0.556 0.385 0.710 0.556 0.600
99 Trachea, bronchus and lung cancers (stage 2) 0.703 0.467 0.832 0.666 0.738
100 Trachea, bronchus and lung cancers (stage 3) 0.876 0.631 0.851 0.689 0.758
101 Trachea, bronchus and lung cancers (stage 4) 0.913 0.692 0.848 0.686 0.906
105 Breast cancer (stage 1) 0.451 0.342 0.519 0.442 0.439
106 Breast cancer (stage 2) 0.572 0.393 0.650 0.515 0.597
107 Breast cancer (stage 3) 0.771 0.517 0.817 0.651 0.724
108 Breast cancer (stage 4) 0.851 0.598 0.905 0.766 0.864
109 Cervical cancer (stage 1) 0.433 0.335 0.627 0.501 0.431
110 Cervical cancer (stage 2) 0.567 0.390 0.572 0.469 0.553
111 Cervical cancer (stage 3) 0.715 0.474 0.783 0.617 0.813
112 Cervical cancer (stage 4) 0.869 0.621 0.956 0.866 0.855
115 Prostate cancer (stage 1) 0.439 0.337 0.396 0.388 0.458
116 Prostate cancer (stage 2) 0.602 0.408 0.568 0.467 0.613
117 Prostate cancer (stage 3) 0.710 0.471 0.845 0.682 0.742
118 Prostate cancer (stage 4) 0.875 0.630 0.798 0.631 0.838
123 Thyroid cancer (stage 1) 0.257 0.279 0.474 0.421 0.301
124 Thyroid cancer (stage 2) 0.472 0.350 0.556 0.461 0.484
125 Thyroid cancer (stage 3) 0.624 0.419 0.688 0.540 0.639
126 Thyroid cancer (stage 4) 0.805 0.549 0.926 0.802 0.779
139 Ischemic stroke (mild) 0.560 0.387 0.454 0.412 0.540
140 Ischemic stroke (moderate) 0.797 0.541 0.793 0.626 0.787
141 Ischemic stroke (severe) 0.843 0.588 0.716 0.560 0.840
151 Chronic obstructive pulmonary disease (mild) 0.474 0.351 0.617 0.494 0.408
152 Chronic obstructive pulmonary disease (moderate) 0.658 0.438 0.577 0.472 0.703
153 Chronic obstructive pulmonary disease (severe) 0.753 0.503 0.812 0.646 0.722
163 Cirrhosis and other chronic liver diseases due to alcohol use (mild) 0.519 0.369 0.518 0.442 0.484
164 Cirrhosis and other chronic liver diseases due to alcohol use (moderate) 0.633 0.424 0.682 0.536 0.668
165 Cirrhosis and other chronic liver diseases due to alcohol use (severe) 0.679 0.451 0.551 0.458 0.717
192 Major depressive disorder (mild) 0.369 0.313 0.417 0.397 0.279
193 Major depressive disorder (moderate) 0.554 0.385 0.509 0.437 0.528
194 Major depressive disorder (severe) 0.570 0.392 0.668 0.527 0.569
206 Diabetes mellitus without complications 0.324 0.299 0.332 0.364 0.334
207 Diabetes mellitus with complications 0.534 0.376 0.745 0.584 0.663
234 Osteoarthritis (mild) 0.257 0.279 0.303 0.354 0.216
235 Osteoarthritis (moderate) 0.394 0.322 0.440 0.407 0.415
236 Osteoarthritis (severe) 0.494 0.359 0.549 0.457 0.575
237 Low back pain (mild) 0.119 0.243 0.051 0.278 0.138
238 Low back pain (moderate) 0.275 0.284 0.368 0.378 0.310
239 Low back pain (severe) 0.344 0.305 0.296 0.352 0.456
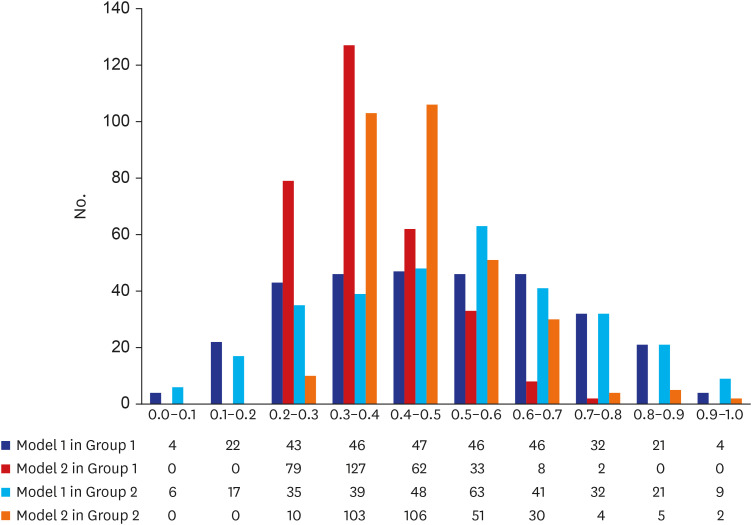
Fig. 1 shows the distributions of DWs in all analyzes. The distributions of DWs for ‘Model 1 in Group 1’ and ‘Model 1 in Group 2’ were close to normal distribution. However, the distributions of DWs for ‘Model 2 in Group 1’ and ‘Model 2 in Group 2’ were right skewed. About two-thirds of the causes of disease had DWs of 0.2 to 0.4 in ‘Model 2 in Group 1.’ Furthermore, in ‘Model 2 in Group 1,’ there was no cause of disease with a DW of more than 0.8 or less than 0.2.
Fig. 1

Distribution of disability weights in each analytical method.

jkms-35-e219-g001
The correlations between the DWs for 200 overlapping causes of disease from a previous study18 and this study are shown in Fig. 2. The Pearson correlation coefficient was highest in ‘Model 1 in Group 1 (0.975)’ and lowest in ‘Model 2 in Group 2 (0.867).’ When the DWs of Model 1 in Group 1 were compared with those of the previous study, a total of 96 causes of disease had decreased DW, but 104 causes had increased DW (Supplementary Table 1). However, when the DWs of ‘Model 2 in Group 1’ were compared to the previous study, a total of 155 causes had decreased the DW, but 45 causes had increased DW. In particular, the DW of the ‘Cervical cancer (stage 3)’ in ‘Model 2 in Group 1 (0.474)’ decreased by 0.338 compared to the previous study (0.813). However, the DW of ‘Falls’ in ‘Model 2 in Group 1 (0.370)’ increased by 0.205 compared to the previous study (0.165).
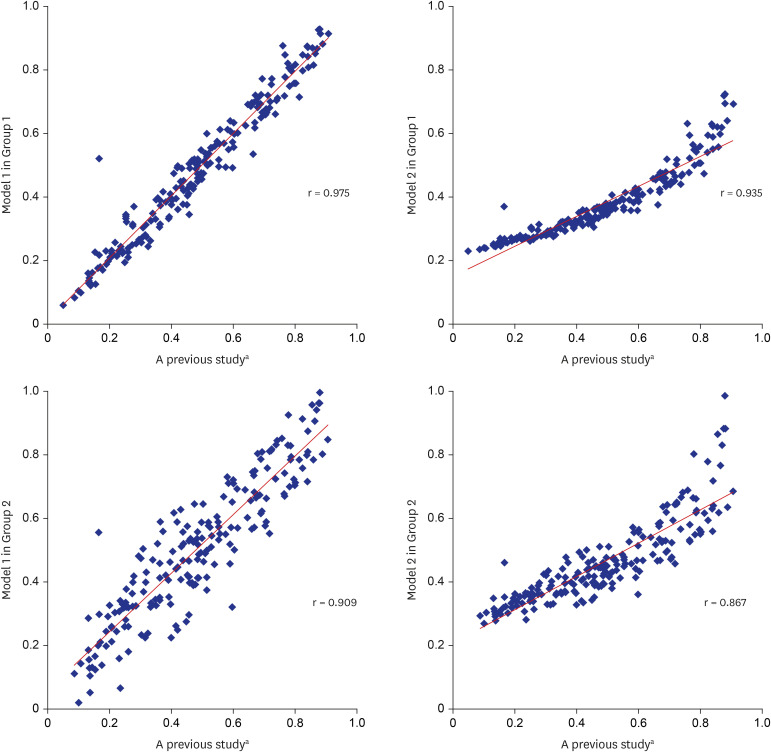
Fig. 2

Correlation of disability weights between a previous study and this study.

aData from the most recent Korean disability weights study.18
jkms-35-e219-g002

DISCUSSION

In this study, we updated the methodology to obtain reasonable DWs for the calculation of DALY and HALE. Specifically, we attempted to determine whether DWs could be calculated for physicians and medical students as well as nurses and oriental medical doctors. In addition, we attempted to identify an optimal model for calculating valid DWs through evaluating the size and distribution of DWs as well as correlation with previous research results and reversal of DW according to the severity of diseases. The survey method and the analytical model for the calculation of DWs, which have been proved through this study, can be used in the calculation of the DW in other countries.
Above all, it is significant because a large number of medical professionals participated in this DW study. Most of the studies on DW conducted for medical professionals were performed by dozens of participants.22 A total of 901 medical professionals participated in the survey and responses of 806 medical professionals were utilized in the analyses. The number of participants was higher than that in the most recent DW study in Korea involving 605 physicians and medical students. Although healthcare professionals have a wealth of knowledge about a variety of health conditions and diseases and can objectively compare and evaluate diseases, questions can arise as to whether they can objectively compare and evaluate diseases as the area of expertise of healthcare professionals becomes increasingly fragmented.23 This limitation may be overcome by more healthcare professionals with diverse specializations participating in DW survey.
In this study, we included nurses and oriental medical doctors as participants of this study. A total of 115 nurses and 9 oriental medical doctors participated in the survey and the results of these responses were analyzed in Group 2. In Group 2, there were some cases in which DWs were reversed according to severity, while there was no case where the DWs were reversed according to the severity in Group 1. Nurses and oriental medical doctors who participated in this study were still unfamiliar with the DW study and seem to have an inconsistent response. In previous studies, healthcare professionals or medical experts have been used extensively in DW studies, but few have specifically identified who will be healthcare professionals or medical experts.2223 Based on the results of this study, it is difficult to make a quick judgment on whether nurses or oriental medicine doctors are not worthy of participating in DW study. However, careful attention should be paid to including medical professionals unconditionally in DW survey, simply because they have medical qualifications. In the DW study, it will be important to educate participants to understand the significance of DW and to make a consistent assessment of the disease during the survey.24
In this study, we attempted to revise the analysis method to obtain valid DWs. The DWs estimated in the previous KNBD studies showed normal distribution,318 whereas the DWs calculated in the GBD studies showed right-skewed distribution. Accordingly, the estimated DWs in KNBD studies were somewhat higher than those in the GBD study. For example, the DWs for ‘anorexia nervosa’ and ‘bulimia nervosa’ were 0.224 and 0.223 in the GBD 2013 study,12 respectively, but 0.420 and 0.392 in the most recent KNBD study,18 respectively. In fact, it is not easy to assess which DWs are valid, but such difference can significantly affect the size of YLD and even influence HALE in KNBD studies. Therefore, this study attempted to revise the method of calculating the DWs considering the distribution assumption of the DWs in the GBD study. In other words, we compared the results of the analytical model assuming a normal distribution of DWs (Model 1) and the results of an analytical model assuming a right-skewed distribution of DWs (Model 2).
As a result, it was confirmed that the DWs in Model 2 was estimated to be smaller than those in Model 1. For example, the DW of ‘Pancreatic cancer’ was 0.929 in Model 1 (Group 1), but 0.724 in Model 2 (Group 1). In Model 2 (Group 1), however, most of the DWs were distributed between 0.2 and 0.4, and there was no cause of disease with DWs of more than 0.8 or less than 0.2. For example, the DW of ‘Otitis media’ was 0.169 in Model 1 (Group 1) but 0.256 in Model 2 (Group 1). It was confirmed that the variance of the DWs between causes of disease estimated in Model 2 was smaller than that of Model 1. Therefore, efforts should continue to be made to produce valid disability weights that can increase the discrimination between causes of disease while meeting distribution assumptions. It is necessary to try to have multiple anchor points and to give constant values using data from health-related quality of life.
Assessing the validity of DWs is not an easy task.2224 This is because there is no gold standard for DWs, and we estimate DWs for hundreds of causes of disease at once. Therefore, in this study, various methods were used to evaluate the validity of DWs. We examined whether there was a reversal in DWs of causes of disease with other severity levels and we also checked the distribution of DWs and compared them with previous results. Although not used in this study, it is also possible to compare EQ-5D's DWs with utility weights.1925 Considering these points together, we conclude that ‘Model 2 in Group 1’ has several advantages over others. However, due to the emergence of new diseases, changes in characteristics of the disease, development of new drugs and treatment techniques, and changes in social perspectives on disability, the DWs calculated in the past may not be valid presently, so that it is necessary to evaluate and revise DWs continuously.
One limitation of this study is that the number of participating nurses or oriental medical doctors was relatively small compared to physicians. Although the number of participants does not seem to be small compared to other studies, the participation of more people in the DW survey can help to reasonably estimate the DWs of a variety of causes of disease. Future studies should include a higher number of nurses and oriental medical doctors for examining the possibility of calculating the DW.
In conclusion, we attempted to calculate DWs by surveying various types of medical professionals using the previous analysis methods as well as the revised analysis method. Finally, we estimated DWs for a total of 313 causes of disease for the KNBD study. The DWs from this study can be used to estimate accurate DALY and health life expectancy, such as HALE, in Korea.

ACKNOWLEDGMENTS

The authors would like to thank the individuals who responded to the survey.

Notes

Funding: This research was supported by a grant of the Korea Health Technology R&D Project through the Korea Health Industry Development Institute (KHIDI), funded by the Ministry of Health & Welfare, Republic of Korea (Grant No. HI18C0446).

Disclosure: The authors have no potential conflicts of interest to disclose.

Author Contributions:

  • Conceptualization: Kim YE, Jo MW, Park H, Oh IH, Yoon SJ, Pyo J, Ock M.

  • Data curation: Kim YE, Jo MW, Pyo J, Ock M.

  • Formal analysis: Jo MW, Ock M.

  • Methodology: Jo MW, Ock M.

  • Validation: Kim YE, Jo MW, Park H, Oh IH, Yoon SJ, Ock M.

  • Writing - original draft: Kim YE, Jo MW, Ock M.

  • Writing - review & editing: Kim YE, Jo MW, Park H, Oh IH, Yoon SJ, Pyo J, Ock M.

References

1. Mundial B. World Development Report 1993; Investing in Health. Oxford: Oxford University Press;1993.
2. Murray CJ, Salomon JA, Mathers CD, Lopez AD, Organization WH. Summary Measures of Population Health: Concepts, Ethics, Measurement and Applications. Geneva: World Health Organization;2002.
3. Ock M, Lee JY, Oh IH, Park H, Yoon SJ, Jo MW. Disability weights measurement for 228 causes of disease in the Korean Burden of Disease study 2012. J Korean Med Sci. 2016; 31(Suppl 2):S129–38. PMID: 27775250.
crossref
4. Murray CJ, Lopez AD, Organization WH. The global burden of disease: a comprehensive assessment of mortality and disability from diseases, injuries, and risk factors in 1990 and projected to 2020: summary. Updated 1997. Accessed March 8, 2020. https://apps.who.int/iris/handle/10665/41864.
5. Stouthard ME, Essink-Bot M, Bonsel G, Barendregt J, Kramers P, Van de Water H, et al. Disability Weights for Diseases in the Netherlands. Amsterdam: Instituut voor Sociale Geneeskunde;1997.
6. Schwarzinger M, Stouthard ME, Burström K, Nord E. Cross-national agreement on disability weights: the European Disability Weights Project. Popul Health Metr. 2003; 1(1):9. PMID: 14633276.
crossref
7. Jelsma J, Chivaura VG, Mhundwa K, De Weerdt W, de Cock P. The global burden of disease disability weights. Lancet. 2000; 355(9220):2079–2080. PMID: 10885386.
crossref
8. Haagsma JA, Polinder S, van Beeck EF, Mulder S, Bonsel GJ. Alternative approaches to derive disability weights in injuries: do they make a difference? Qual Life Res. 2009; 18(5):657–665. PMID: 19421894.
crossref
9. Groce NE. Disability in cross-cultural perspective: rethinking disability. Lancet. 1999; 354(9180):756–757. PMID: 10475203.
crossref
10. Ustün TB, Rehm J, Chatterji S, Saxena S, Trotter R, Room R, et al. Multiple-informant ranking of the disabling effects of different health conditions in 14 countries. Lancet. 1999; 354(9173):111–115. PMID: 10408486.
11. Salomon JA, Vos T, Hogan DR, Gagnon M, Naghavi M, Mokdad A, et al. Common values in assessing health outcomes from disease and injury: disability weights measurement study for the Global Burden of Disease study 2010. Lancet. 2012; 380(9859):2129–2143. PMID: 23245605.
12. Salomon JA, Haagsma JA, Davis A, de Noordhout CM, Polinder S, Havelaar AH, et al. Disability weights for the Global Burden of Disease 2013 study. Lancet Glob Health. 2015; 3(11):e712–23. PMID: 26475018.
crossref
13. Nord E. Disability weights in the Global Burden of Disease 2010: unclear meaning and overstatement of international agreement. Health Policy. 2013; 111(1):99–104. PMID: 23608637.
crossref
14. Taylor HR, Jonas JB, Keeffe J, Leasher J, Naidoo K, Pesudovs K, et al. Disability weights for vision disorders in Global Burden of Disease study. Lancet. 2013; 381(9860):23.
crossref
15. Voigt K, King NB. Disability weights in the global burden of disease 2010 study: two steps forward, one step back? Bull World Health Organ. 2014; 92(3):226–228. PMID: 24700983.
crossref
16. Reidpath DD, Allotey PA, Kouame A, Cummins RA. Measuring health in a vacuum: examining the disability weight of the DALY. Health Policy Plan. 2003; 18(4):351–356. PMID: 14654511.
crossref
17. Yoon SJ, Kwon YD, Kim BY. Estimating the disability weight of major cancers in Korea using Delphi method. Korean J Prev Med. 2000; 33(4):409–414.
18. Ock M, Park B, Park H, Oh IH, Yoon SJ, Cho B, et al. Disability weights measurement for 289 causes of disease considering disease severity in Korea. J Korean Med Sci. 2019; 34(Suppl 1):e60. PMID: 30923484.
crossref
19. Ock M, Ahn J, Yoon SJ, Jo MW. Estimation of disability weights in the general population of South Korea using a paired comparison. PLoS One. 2016; 11(9):e0162478. PMID: 27606626.
crossref
20. Ock M, Yi N, Ahn J, Jo MW. How many alternatives can be ranked? A comparison of the paired comparison and ranking methods. Value Health. 2016; 19(5):655–660. PMID: 27565283.
crossref
21. GBD 2016 Disease and Injury Incidence and Prevalence Collaborators. Global, regional, and national incidence, prevalence, and years lived with disability for 328 diseases and injuries for 195 countries, 1990-2016: a systematic analysis for the Global Burden of Disease Study 2016. Lancet. 2017; 390(10100):1211–1259. PMID: 28919117.
22. Haagsma JA, Polinder S, Cassini A, Colzani E, Havelaar AH. Review of disability weight studies: comparison of methodological choices and values. Popul Health Metr. 2014; 12(1):20. PMID: 26019690.
crossref
23. Poenaru D, Pemberton J, Frankfurter C, Cameron BH, Stolk E. Establishing disability weights for congenital pediatric surgical conditions: a multi-modal approach. Popul Health Metr. 2017; 15(1):8. PMID: 28259148.
crossref
24. Ock M, Ko S, Lee HJ, Jo MW. Review of issues for disability weight studies. Health Policy Manag. 2016; 26(4):352–358.
crossref
25. Maertens de Noordhout C, Devleesschauwer B, Gielens L, Plasmans MH, Haagsma JA, Speybroeck N. Mapping EQ-5D utilities to GBD 2010 and GBD 2013 disability weights: results of two pilot studies in Belgium. Arch Public Health. 2017; 75(1):6. PMID: 28191312.
crossref

SUPPLEMENTARY MATERIAL

Supplementary Table 1

Comparison of disability weights between a previous study and the present study
jkms-35-e219-s001.doc
TOOLS
Similar articles