Journal List > J Korean Med Sci > v.35(23) > 1146066

Jang, Jang, and Lee: Social Distancing and Transmission-reducing Practices during the 2019 Coronavirus Disease and 2015 Middle East Respiratory Syndrome Coronavirus Outbreaks in Korea

Abstract

Background

The absence of effective antiviral medications and vaccines increased the focus on non-pharmaceutical preventive behaviors for mitigating against the coronavirus disease 2019 (COVID-19) pandemic. To examine the current status of non-pharmaceutical preventive behaviors practiced during the COVID-19 outbreak and factors affecting behavioral activities, we compared to the 2015 Middle East respiratory syndrome coronavirus (MERS-CoV) outbreak in Korea.

Methods

This was a serial cross-sectional population-based study in Korea with four surveys conducted on June 2 and 25, 2015 (MERS-CoV surveys), and February 4, and April 2, 2020 (COVID-19 surveys). Of 25,711 participants selected using random digit dialing numbers, 4,011 participants (aged ≥ 18 years) were successfully interviewed, for the 2020 COVID-19 (n = 2,002) and 2015 MERS-CoV (n = 2,009) epidemics were included. Participants were selected post-stratification by sex, age, and province. The total number of weighted cases in this survey equaled the total number of unweighted cases at the national level. We measured the levels of preventive behaviors (social distancing [avoiding physical contact with others]), and practicing transmission-reducing behaviors such as wearing face mask and handwashing.

Results

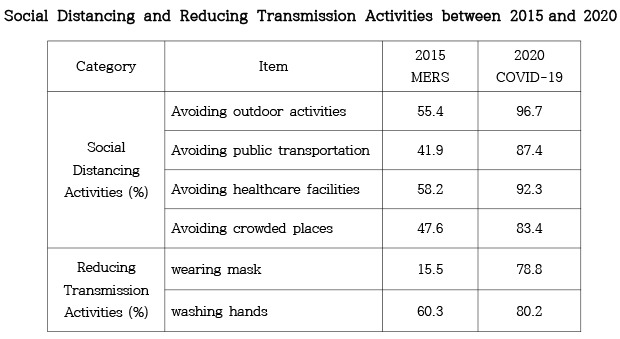
Between the surveys, respondents who reported practicing social distancing increased from 41.9%–58.2% (MERS-CoV) to 83.4%–92.3% (COVID-19). The response rate for the four surveys ranged between 13.7% and 17.7%. Practicing transmission-reducing behaviors (wearing face masks and handwashing) at least once during COVID-19 (78.8%, 80.2%) also increased compared to that during MERS-CoV (15.5%, 60.3%). The higher affective risk perception groups were more likely to practice transmission-reducing measures (adjusted odds ratio, 3.24–4.81; 95 confidence interval, 1.76–6.96) during both COVID-19 and MERS-CoV.

Conclusion

The study findings suggest markedly increased proportions of non-pharmaceutical behavioral practices evenly across all subgroups during the two different novel virus outbreaks in Korea. Strategic interventions are needed to attempt based on preventive behavior works.

Graphical Abstract

jkms-35-e220-abf001.jpg

INTRODUCTION

Many countries are battling with the coronavirus disease 2019 (COVID-19) pandemic because of the absence of effective antiviral medications and vaccines. To control the spread of COVID-19, social distancing, wearing of face masks, and washing of hands, which are transmission-reducing behaviors, are being recommended as some of the most important measures.123 Because early transmission of the severe acute respiratory syndrome coronavirus 2 (SARS-CoV-2) is caused by pre-symptomatic- or pauci-symptomatic-infected individuals, these non-pharmaceutical preventive behaviors are getting more attention for the containment of the COVID-19 pandemic.456 These attempts at behavioral change are aimed at slowing down the spread of emerging infectious diseases and to flatten the epidemic curve. Thus, the healthcare system resource capacity can be conserved while allowing time for the development of drugs and vaccines. Social distancing (or spatial distancing), including avoidance of outdoor activities, public transportation, healthcare facilities, and crowded places with potential for physical contact between individuals, reduced the number of infections.23 Wearing of face masks and washing of hands are also associated with reduced propensity of transmission.5678
Periodically, Korea has experienced outbreaks including the severe acute respiratory syndrome (SARS), influenza H1N1, Middle East respiratory syndrome coronavirus (MERS-CoV), and COVID-19 outbreaks in 2003, 2009, 2015, and 2020, respectively.91011 Differences occurred in epidemiologic outcomes (number of cases, fatality rates) of these novel infectious disease outbreaks in Korea. Only 3 confirmed cases and no death during SARS, more than 100,000 confirmed cases and 260 deaths during influenza H1N1, and 185 confirmed cases and 36 deaths during MERS-CoV occurred.9 Since diagnosing the first COVID-19 case in Korea on 20 January, 2020, 10,738 cases have been confirmed, 243 deaths occurred, and 3,246 patients were isolated until 27 April, 2020.12 In February 2020, Korea became the worst affected country, aside from China, for a while, and had several surges in the number of cases.13 However, the Korea epidemic curve flattened without coercive restrictions following rapid interventions beginning in March 2020.14 One possible explanation for the mitigation of the surge was the strong efforts implemented by the Korean government and the citizens of Korea to practice social distancing and transmission-reducing behaviors.
Resurgence in the emerging infectious disease provides opportunity for comparing individual's levels of practicing non-pharmaceutical preventive behaviors. However, no study has compared the proportion of practicing non-pharmaceutical preventive behaviors between COVID-19 and 2015 MERS-CoV outbreaks.23715161718 The current study aimed to quantify and compare the individuals' adherence to social distancing and transmission-reducing behavioral practices during the COVID-19 and MERS-CoV outbreaks in Korea. Factors influencing these practices were also determined. We hypothesized that there would be differences in the rate of adherence to the non-pharmaceutical preventive behaviors and the factors affecting these behaviors between the 2020 COVID-19 and 2015 MERS-CoV outbreaks.

METHODS

Participants

This study, which was conducted between 2015 and 2020, used the results of 4 surveys with a total of 4,011 participants. A sample size of each survey participants was estimated to ensure the 95% confidence interval (CI), 0.025 desired margin of error, 0.2 behavioral response proportion of population. The 4,011 participants included 2,009 participants older than 19 years who were monitored during the MERS-CoV outbreak between June 2 and 25, 2015; and 2,002 participants, older than 18 years, who were investigated during COVID-19 outbreak between February 4 and April 2, 2020. All surveys were conducted using mobile (85%) or landline (15%) random digit dialing numbers in 8 regions (nationally representative). Participants were selected post-stratification by sex, age, and province and chosen independently by each survey. The total number of weighted cases in this survey equaled the total number of unweighted cases at the national level. The weights were normalized to calculate the proportions and ratios but not for estimating the subtotal populations. Trained interviewers conducted all interviews using computer assisted telephone interviewing. Surveys 3 and 4 began approximately 2 weeks after the index case occurred, while surveys 1 and 2 were conducted approximately a month after surveys 3 and 4. Survey 1 was conducted just 10 days before the last confirmed patient of MERS-CoV on July 4, 2015. However, survey 2 was conducted when there were more than 100 confirmed cases. The surveys were conducted by Gallup Korea, an affiliation of Gallup International. Details, including period, number of respondents successfully interviewed, and response rate for each of the four surveys are provided in Table 1.
Table 1

Details of the surveys conducted on the SARS-CoV-2 and MERS-CoV outbreaks in Korea

jkms-35-e220-i001
Type of behaviors Pathogen in the outbreak Survey Period No. of participants sampled No. of participants successfully interviewed Response rate, %
Social distancing MERS-CoV 1 23–25 Jun, 2015 5,680 1,004 17.7
SARS-CoV-2 2 31 Mar–2 Apr, 2020 7,304 1,002 13.7
Reducing transmission MERS-CoV 3 2–4 Jun, 2015 6,494 1,005 15.5
SARS-CoV-2 4 4–6 Feb, 2020 6,233 1,000 16.0
SARS-CoV-2 = severe acute respiratory syndrome coronavirus 2, MERS-CoV = Middle East respiratory syndrome coronavirus.
Sex, age, occupation, self-reported household economic status, residential area, presidential job approval rating, party identification, and affective risk perception as participants' characteristics, were investigated to identify factors influencing non-pharmaceutical preventive behaviors. Age was classified into 5 levels (19–29, 30s, 40s, 50s, and 60 years and older). Occupation was classified into five levels (unemployed, self-employed including farming/forestry/fishery, blue-collar worker, white-collar worker, and full-time homemaker or student). Self-reported household economic status was classified into five levels (lower, lower middle, middle, upper middle, and upper). Participants were classified as either metropolitan or non-metropolitan residents. Presidential job approval rating was assessed using the following options: “approval,” “disapproval,” or “no opinion.” Support for party identification was assessed based on alignment either with the ruling party, opposition party, or no opinion. Affective risk perception was assessed using the options “worried” or “not worried.”19

Survey instruments

The interviews were conducted on the two aspects of the non-pharmaceutical preventive behaviors, which are social distancing measures and transmission-reducing practices (Supplementary Data 1 and 2). Social distancing was assessed using the following four questions: 1) “Did you reduce or avoid outdoor activities or attend meetings this week because of MERS-CoV or COVID-19?”; 2) “Did you reduce or avoid using public transportation such as the bus or the subway this week because of MERS-CoV or COVID-19?”; 3) “Did you reduce or avoid using healthcare facilities such as the hospitals or public health centers this week because of MERS-CoV or COVID-19?”; and 4) “Did you reduce or avoid visiting crowded markets, departmental stores, or large discount stores this week because of MERS-CoV or COVID-19?” Transmission-reducing practice was assessed using the following two questions: 1) “Do you wash your hands more often than usual because of MERS-CoV or COVID-19?” and 2) “Have you ever worn a face mask because of MERS-CoV or COVID-19?” All the questions about the non-pharmaceutical preventive behaviors required “yes/no” responses. The development of the questionnaires on preventive behaviors had not gone through a validity procedure due to the urgency of the outbreak. We also imposed the survey items on existing questionnaire developed by Gallup Korea, an affiliation of Gallup International.

Statistical analysis

Response rates according to preventive behaviors were calculated according to participants' characteristics. Univariable analyses using χ2 test were performed in the four surveys, entirely and respectively, to identify the relationships between practicing preventive behaviors and each demographic variable. Missing values of any outcome variable were ≤ 3.6%. Multivariable logistic regression analysis was performed to explore factors influencing preventive behaviors in the four surveys, entirely and respectively. We performed multivariable logistic regression model adjusted for sex, age, occupation, self-reported household economic status, residential area, presidential job approval, and party identification.15 Affective risk perception was excluded from survey 1 and survey 2 logistic regression models to attain comparability because no data existed for it in survey 2. On the avoidance of outdoors activities, extremely large number of events made the odds ratios (ORs) in survey 2 logistic regression model unstable; therefore, surveys 1 and 2 logistic models were not reported. Using logistic regression analysis for transmission-reducing measures and social distancing measures, “y = 1” was used when “yes” for preventive behaviors, otherwise “y = 0” was used. We analyzed with a 2-sided P value of less than 0.05 considered significant using SAS version 9.4 (SAS Institute Inc, Cary, NC, USA).

Ethics statement

This study was reviewed and approved by the Institutional Review Board (IRB) of Seoul Metropolitan Government-Seoul National University Boramae Medical Center (IRB No. 20200403/07 - 2020 - 12/043). The need for informed consent was waived by the board.

RESULTS

Demographic factors and social distancing behaviors

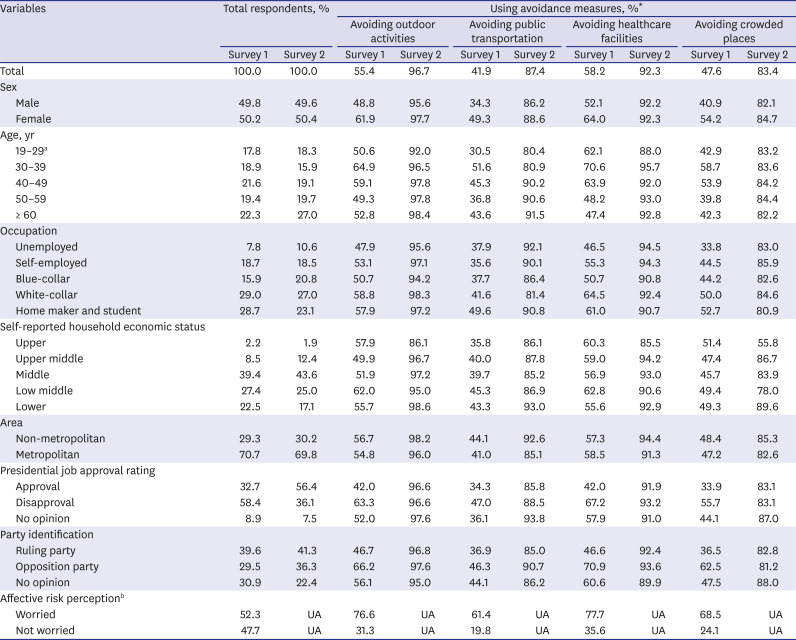
Differences in participants' general characteristics between surveys 1 and 2 are shown in Table 2. Overall, the practice rate of avoiding outdoor activities in survey 2 increased 1.7-fold compared to that in survey 1. Depending on the general characteristic, avoiding outdoor activities' practice rate differed by as little as 28.2% (upper economic status) and as much as 54.6% (presidential job approval). Overall, avoiding public transportation practice rate in survey 2 increased 2.1-fold compared to that in survey 1. Depending on the general characteristic, avoiding public transportation' practice rate differed by as little as 29.3% (aged 30–39 years) and as much as 57.6% (no opinion of presidential job approval). Overall, avoiding healthcare facilities' practice rate in survey 2 increased 1.6-fold compared to that in survey 1. Depending on the general characteristic, avoiding healthcare facilities' practice rate differed by as little as 22.7% (opposition party identification) and as much as 49.9% (presidential job approval). Overall avoiding crowded places' practice rate in survey 2 increased 1.8-fold compared to that in survey 1. Depending on the general characteristic, avoiding crowded places' practice rate differed by as little as 4.4% (upper economic status) and as much as 49.3% (presidential job approval). There were no statistically significant differences between surveys with participants' characteristics except with occupation, self-reported household economic status, presidential job approval rating, and party identification. With occupation, higher proportions occurred in the unemployed and blue-collar workers in survey 2, while lower proportions occurred in white-collar workers and home makers or students. Of the self-reported household economic status, survey 4 had higher proportions in the ‘upper middle’ and ‘middle’ status, while lower proportions occurred in ‘low middle’ and ‘lower’ status. With respect to the presidential job approval rating, the percentage of participants who reported obtaining ‘approval’ increased in survey 2 compared to survey 1. Of the party identification, the proportion in the ‘ruling party’ in survey 2 were higher than that in survey 1.
Table 2

General characteristics of the participants and the use of social distancing measures (surveys 1 and 2)

jkms-35-e220-i002
Variables Total respondents, % Using avoidance measures, %*
Avoiding outdoor activities Avoiding public transportation Avoiding healthcare facilities Avoiding crowded places
Survey 1 Survey 2 Survey 1 Survey 2 Survey 1 Survey 2 Survey 1 Survey 2 Survey 1 Survey 2
Total 100.0 100.0 55.4 96.7 41.9 87.4 58.2 92.3 47.6 83.4
Sex
Male 49.8 49.6 48.8 95.6 34.3 86.2 52.1 92.2 40.9 82.1
Female 50.2 50.4 61.9 97.7 49.3 88.6 64.0 92.3 54.2 84.7
Age, yr
19–29a 17.8 18.3 50.6 92.0 30.5 80.4 62.1 88.0 42.9 83.2
30–39 18.9 15.9 64.9 96.5 51.6 80.9 70.6 95.7 58.7 83.6
40–49 21.6 19.1 59.1 97.8 45.3 90.2 63.9 92.0 53.9 84.2
50–59 19.4 19.7 49.3 97.8 36.8 90.6 48.2 93.0 39.8 84.4
≥ 60 22.3 27.0 52.8 98.4 43.6 91.5 47.4 92.8 42.3 82.2
Occupation
Unemployed 7.8 10.6 47.9 95.6 37.9 92.1 46.5 94.5 33.8 83.0
Self-employed 18.7 18.5 53.1 97.1 35.6 90.1 55.3 94.3 44.5 85.9
Blue-collar 15.9 20.8 50.7 94.2 37.7 86.4 50.7 90.8 44.2 82.6
White-collar 29.0 27.0 58.8 98.3 41.6 81.4 64.5 92.4 50.0 84.6
Home maker and student 28.7 23.1 57.9 97.2 49.6 90.8 61.0 90.7 52.7 80.9
Self-reported household economic status
Upper 2.2 1.9 57.9 86.1 35.8 86.1 60.3 85.5 51.4 55.8
Upper middle 8.5 12.4 49.9 96.7 40.0 87.8 59.0 94.2 47.4 86.7
Middle 39.4 43.6 51.9 97.2 39.7 85.2 56.9 93.0 45.7 83.9
Low middle 27.4 25.0 62.0 95.0 45.3 86.9 62.8 90.6 49.4 78.0
Lower 22.5 17.1 55.7 98.6 43.3 93.0 55.6 92.9 49.3 89.6
Area
Non-metropolitan 29.3 30.2 56.7 98.2 44.1 92.6 57.3 94.4 48.4 85.3
Metropolitan 70.7 69.8 54.8 96.0 41.0 85.1 58.5 91.3 47.2 82.6
Presidential job approval rating
Approval 32.7 56.4 42.0 96.6 34.3 85.8 42.0 91.9 33.9 83.1
Disapproval 58.4 36.1 63.3 96.6 47.0 88.5 67.2 93.2 55.7 83.1
No opinion 8.9 7.5 52.0 97.6 36.1 93.8 57.9 91.0 44.1 87.0
Party identification
Ruling party 39.6 41.3 46.7 96.8 36.9 85.0 46.6 92.4 36.5 82.8
Opposition party 29.5 36.3 66.2 97.6 46.3 90.7 70.9 93.6 62.5 81.2
No opinion 30.9 22.4 56.1 95.0 44.1 86.2 60.6 89.9 47.5 88.0
Affective risk perceptionb
Worried 52.3 UA 76.6 UA 61.4 UA 77.7 UA 68.5 UA
Not worried 47.7 UA 31.3 UA 19.8 UA 35.6 UA 24.1 UA
UA = unavailable.
*P < 0.05.
aData were reported for those aged 18–29 years in surveys 3 and 4; bNot asked in survey.

Demographic factors and transmission-reducing behaviors

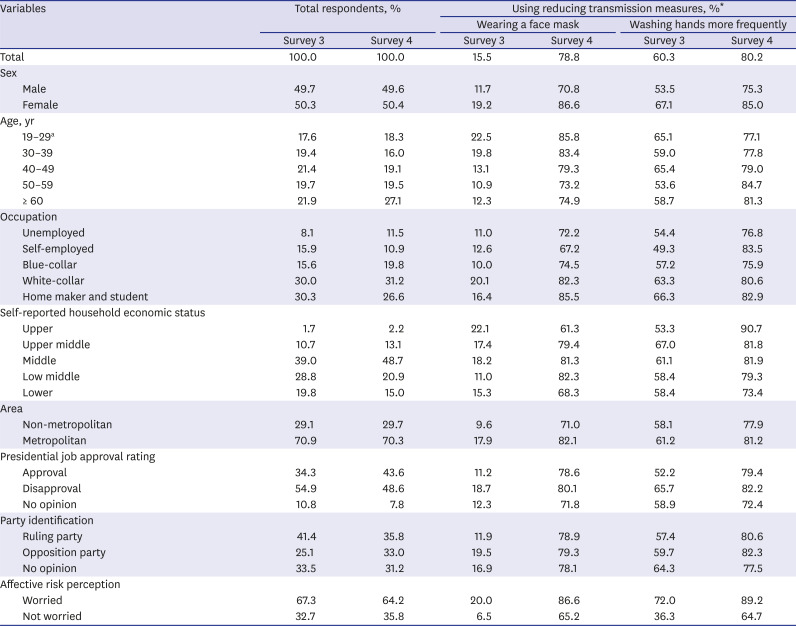
Comparison of the general characteristics of the participants between surveys 3 and 4 are shown in Table 3. Overall, wearing of face mask rate in survey 4 had increased by more than 5-fold compared to that in survey 3. Depending on the general characteristic, the wearing of face mask rate differed by as little as 39.2% (upper economic status) and as much as 71.3% low middle economic status). Overall, the washing of hands rate in survey 4 increased by 1.3-fold compared to that in survey 3. Depending on the general characteristic, washing of hands rate differed by as little as 12.0% (aged 19–29 years) and as much as 37.5% (upper economic status). There were definitively, statistically significant differences in the wearing of face masks rate in all subgroups between surveys 3 and 4. No significant differences occurred in participants' proportions between surveys, except with occupation, self-reported household economic status, presidential job approval rating, and party identification. With occupation, survey 4 had higher proportions of the unemployed and blue-collar workers, while had lower proportions of the self-employed and home makers or students. Of the self-reported household economic status, survey 4 had a higher proportion of those in the ‘middle’ status, while had a lower proportion of those in the ‘low middle.’ With respect to presidential job approval rating, the percentage of participants who reported ‘approval’ increased when survey 4 was compared with survey 3. Of the party identification, the proportion in the ‘ruling party’ in survey 4 were higher than that in survey 3.
Table 3

Basic characteristics of the participants and use of reducing transmission measures (surveys 3 and 4)

jkms-35-e220-i003
Variables Total respondents, % Using reducing transmission measures, %*
Wearing a face mask Washing hands more frequently
Survey 3 Survey 4 Survey 3 Survey 4 Survey 3 Survey 4
Total 100.0 100.0 15.5 78.8 60.3 80.2
Sex
Male 49.7 49.6 11.7 70.8 53.5 75.3
Female 50.3 50.4 19.2 86.6 67.1 85.0
Age, yr
19–29a 17.6 18.3 22.5 85.8 65.1 77.1
30–39 19.4 16.0 19.8 83.4 59.0 77.8
40–49 21.4 19.1 13.1 79.3 65.4 79.0
50–59 19.7 19.5 10.9 73.2 53.6 84.7
≥ 60 21.9 27.1 12.3 74.9 58.7 81.3
Occupation
Unemployed 8.1 11.5 11.0 72.2 54.4 76.8
Self-employed 15.9 10.9 12.6 67.2 49.3 83.5
Blue-collar 15.6 19.8 10.0 74.5 57.2 75.9
White-collar 30.0 31.2 20.1 82.3 63.3 80.6
Home maker and student 30.3 26.6 16.4 85.5 66.3 82.9
Self-reported household economic status
Upper 1.7 2.2 22.1 61.3 53.3 90.7
Upper middle 10.7 13.1 17.4 79.4 67.0 81.8
Middle 39.0 48.7 18.2 81.3 61.1 81.9
Low middle 28.8 20.9 11.0 82.3 58.4 79.3
Lower 19.8 15.0 15.3 68.3 58.4 73.4
Area
Non-metropolitan 29.1 29.7 9.6 71.0 58.1 77.9
Metropolitan 70.9 70.3 17.9 82.1 61.2 81.2
Presidential job approval rating
Approval 34.3 43.6 11.2 78.6 52.2 79.4
Disapproval 54.9 48.6 18.7 80.1 65.7 82.2
No opinion 10.8 7.8 12.3 71.8 58.9 72.4
Party identification
Ruling party 41.4 35.8 11.9 78.9 57.4 80.6
Opposition party 25.1 33.0 19.5 79.3 59.7 82.3
No opinion 33.5 31.2 16.9 78.1 64.3 77.5
Affective risk perception
Worried 67.3 64.2 20.0 86.6 72.0 89.2
Not worried 32.7 35.8 6.5 65.2 36.3 64.7
*P < 0.05.
aData were reported for those aged 18–29 years in surveys 1 and 2.

Factors associated with the use of preventive behaviors

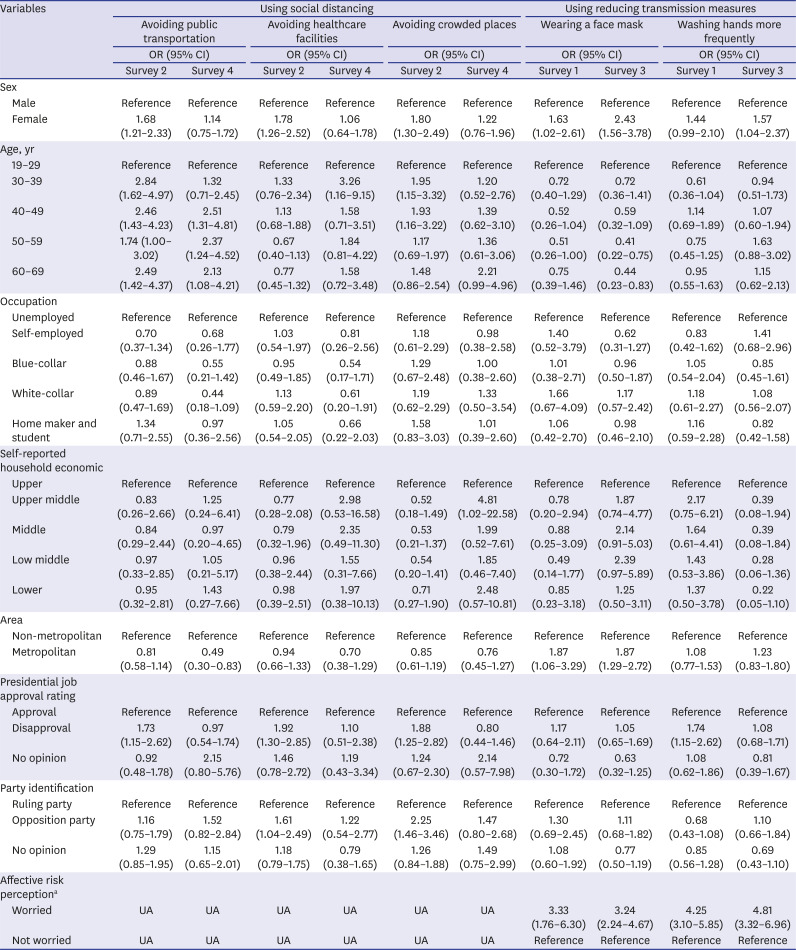
Table 4 reports the association between variables and non-pharmaceutical preventive behaviors, social distancing and transmission-reducing behaviors.
Table 4

Association between personal characteristics and non-pharmaceutical preventive behaviors against MERS-CoV and SARS-COV-2

jkms-35-e220-i004
Variables Using social distancing Using reducing transmission measures
Avoiding public transportation Avoiding healthcare facilities Avoiding crowded places Wearing a face mask Washing hands more frequently
OR (95% CI) OR (95% CI) OR (95% CI) OR (95% CI) OR (95% CI)
Survey 2 Survey 4 Survey 2 Survey 4 Survey 2 Survey 4 Survey 1 Survey 3 Survey 1 Survey 3
Sex
Male Reference Reference Reference Reference Reference Reference Reference Reference Reference Reference
Female 1.68 (1.21–2.33) 1.14 (0.75–1.72) 1.78 (1.26–2.52) 1.06 (0.64–1.78) 1.80 (1.30–2.49) 1.22 (0.76–1.96) 1.63 (1.02–2.61) 2.43 (1.56–3.78) 1.44 (0.99–2.10) 1.57 (1.04–2.37)
Age, yr
19–29 Reference Reference Reference Reference Reference Reference Reference Reference Reference Reference
30–39 2.84 (1.62–4.97) 1.32 (0.71–2.45) 1.33 (0.76–2.34) 3.26 (1.16–9.15) 1.95 (1.15–3.32) 1.20 (0.52–2.76) 0.72 (0.40–1.29) 0.72 (0.36–1.41) 0.61 (0.36–1.04) 0.94 (0.51–1.73)
40–49 2.46 (1.43–4.23) 2.51 (1.31–4.81) 1.13 (0.68–1.88) 1.58 (0.71–3.51) 1.93 (1.16–3.22) 1.39 (0.62–3.10) 0.52 (0.26–1.04) 0.59 (0.32–1.09) 1.14 (0.69–1.89) 1.07 (0.60–1.94)
50–59 1.74 (1.00–3.02) 2.37 (1.24–4.52) 0.67 (0.40–1.13) 1.84 (0.81–4.22) 1.17 (0.69–1.97) 1.36 (0.61–3.06) 0.51 (0.26–1.00) 0.41 (0.22–0.75) 0.75 (0.45–1.25) 1.63 (0.88–3.02)
60–69 2.49 (1.42–4.37) 2.13 (1.08–4.21) 0.77 (0.45–1.32) 1.58 (0.72–3.48) 1.48 (0.86–2.54) 2.21 (0.99–4.96) 0.75 (0.39–1.46) 0.44 (0.23–0.83) 0.95 (0.55–1.63) 1.15 (0.62–2.13)
Occupation
Unemployed Reference Reference Reference Reference Reference Reference Reference Reference Reference Reference
Self-employed 0.70 (0.37–1.34) 0.68 (0.26–1.77) 1.03 (0.54–1.97) 0.81 (0.26–2.56) 1.18 (0.61–2.29) 0.98 (0.38–2.58) 1.40 (0.52–3.79) 0.62 (0.31–1.27) 0.83 (0.42–1.62) 1.41 (0.68–2.96)
Blue-collar 0.88 (0.46–1.67) 0.55 (0.21–1.42) 0.95 (0.49–1.85) 0.54 (0.17–1.71) 1.29 (0.67–2.48) 1.00 (0.38–2.60) 1.01 (0.38–2.71) 0.96 (0.50–1.87) 1.05 (0.54–2.04) 0.85 (0.45–1.61)
White-collar 0.89 (0.47–1.69) 0.44 (0.18–1.09) 1.13 (0.59–2.20) 0.61 (0.20–1.91) 1.19 (0.62–2.29) 1.33 (0.50–3.54) 1.66 (0.67–4.09) 1.17 (0.57–2.42) 1.18 (0.61–2.27) 1.08 (0.56–2.07)
Home maker and student 1.34 (0.71–2.55) 0.97 (0.36–2.56) 1.05 (0.54–2.05) 0.66 (0.22–2.03) 1.58 (0.83–3.03) 1.01 (0.39–2.60) 1.06 (0.42–2.70) 0.98 (0.46–2.10) 1.16 (0.59–2.28) 0.82 (0.42–1.58)
Self-reported household economic
Upper Reference Reference Reference Reference Reference Reference Reference Reference Reference Reference
Upper middle 0.83 (0.26–2.66) 1.25 (0.24–6.41) 0.77 (0.28–2.08) 2.98 (0.53–16.58) 0.52 (0.18–1.49) 4.81 (1.02–22.58) 0.78 (0.20–2.94) 1.87 (0.74–4.77) 2.17 (0.75–6.21) 0.39 (0.08–1.94)
Middle 0.84 (0.29–2.44) 0.97 (0.20–4.65) 0.79 (0.32–1.96) 2.35 (0.49–11.30) 0.53 (0.21–1.37) 1.99 (0.52–7.61) 0.88 (0.25–3.09) 2.14 (0.91–5.03) 1.64 (0.61–4.41) 0.39 (0.08–1.84)
Low middle 0.97 (0.33–2.85) 1.05 (0.21–5.17) 0.96 (0.38–2.44) 1.55 (0.31–7.66) 0.54 (0.20–1.41) 1.85 (0.46–7.40) 0.49 (0.14–1.77) 2.39 (0.97–5.89) 1.43 (0.53–3.86) 0.28 (0.06–1.36)
Lower 0.95 (0.32–2.81) 1.43 (0.27–7.66) 0.98 (0.39–2.51) 1.97 (0.38–10.13) 0.71 (0.27–1.90) 2.48 (0.57–10.81) 0.85 (0.23–3.18) 1.25 (0.50–3.11) 1.37 (0.50–3.78) 0.22 (0.05–1.10)
Area
Non-metropolitan Reference Reference Reference Reference Reference Reference Reference Reference Reference Reference
Metropolitan 0.81 (0.58–1.14) 0.49 (0.30–0.83) 0.94 (0.66–1.33) 0.70 (0.38–1.29) 0.85 (0.61–1.19) 0.76 (0.45–1.27) 1.87 (1.06–3.29) 1.87 (1.29–2.72) 1.08 (0.77–1.53) 1.23 (0.83–1.80)
Presidential job approval rating
Approval Reference Reference Reference Reference Reference Reference Reference Reference Reference Reference
Disapproval 1.73 (1.15–2.62) 0.97 (0.54–1.74) 1.92 (1.30–2.85) 1.10 (0.51–2.38) 1.88 (1.25–2.82) 0.80 (0.44–1.46) 1.17 (0.64–2.11) 1.05 (0.65–1.69) 1.74 (1.15–2.62) 1.08 (0.68–1.71)
No opinion 0.92 (0.48–1.78) 2.15 (0.80–5.76) 1.46 (0.78–2.72) 1.19 (0.43–3.34) 1.24 (0.67–2.30) 2.14 (0.57–7.98) 0.72 (0.30–1.72) 0.63 (0.32–1.25) 1.08 (0.62–1.86) 0.81 (0.39–1.67)
Party identification
Ruling party Reference Reference Reference Reference Reference Reference Reference Reference Reference Reference
Opposition party 1.16 (0.75–1.79) 1.52 (0.82–2.84) 1.61 (1.04–2.49) 1.22 (0.54–2.77) 2.25 (1.46–3.46) 1.47 (0.80–2.68) 1.30 (0.69–2.45) 1.11 (0.68–1.82) 0.68 (0.43–1.08) 1.10 (0.66–1.84)
No opinion 1.29 (0.85–1.95) 1.15 (0.65–2.01) 1.18 (0.79–1.75) 0.79 (0.38–1.65) 1.26 (0.84–1.88) 1.49 (0.75–2.99) 1.08 (0.60–1.92) 0.77 (0.50–1.19) 0.85 (0.56–1.28) 0.69 (0.43–1.10)
Affective risk perceptiona
Worried UA UA UA UA UA UA 3.33 (1.76–6.30) 3.24 (2.24–4.67) 4.25 (3.10–5.85) 4.81 (3.32–6.96)
Not worried UA UA UA UA UA UA Reference Reference Reference Reference
MERS-CoV = Middle East respiratory syndrome coronavirus, SARS-CoV-2 = severe acute respiratory syndrome coronavirus 2, OR = odds ratio, CI = confidence interval, UA = unavailable.
aNot asked in survey 4.
Of social distancing behaviors, generally, none of the factors (characteristics) consistently affected any kinds of social distancing behaviors (avoiding public transportation, healthcare facilities, and crowded places) in both surveys 1 and 2. The results showed that sex, presidential job approval rating, and party identification were significantly associated with social distancing behaviors in survey 1, but not in survey 2. Those aged 30 years and older were more likely to avoid public transportation in both surveys 1 and 2. Participants aged 30–39 years were more likely to avoid healthcare facilities in survey 2 only. Those aged 30–49 years were more likely to avoid crowded places in survey 1 only. Only in survey 2 were residents of metropolitan cities identified to have practiced avoidance of public transportation behaviors less.
In transmission-reducing behaviors, both surveys 3 and 4 reported that females were more likely to practice preventive behaviors (adjusted OR [aOR], 1.57–2.43; 95% CI, 1.04–3.78), which tended to be stronger in survey 4. The association of affective risk perception with transmission-reducing behaviors was also observed in both surveys 3 and 4. Participants who reported being ‘worried’ were more likely to practice both the wearing of face masks and handwashing (aOR, 3.24–4.81; 95% CI, 1.76–6.96). Those living in metropolitan cities more frequently wore face masks in both surveys 3 and 4. Participants aged 50 years and older practiced less wearing of face masks in survey 4 only. The results showed that presidential job approval rating and washing of hands were significant in survey 3, but not in survey 4.

DISCUSSION

Possibly, the current study is the first to explore changes in individuals' non-pharmaceutical preventive behaviors during two different consecutive emerging infectious disease outbreaks in Korea.237151617202122
First, our study showed a marked increase in non-pharmaceutical preventive behaviors such as social distancing, wearing of face masks, and washing of hands, evenly, across all subgroups during COVID-19 compared to 2015 MERS-CoV. During the previous 2003 SARS outbreak in Hong Kong, the level of preventive behavioral practice increased over time, but differences in level was not compared between outbreaks.23 A possible explanation for the increase of preventive behavioral practices during COVID-19 in Korea could be due to previous experience of emerging infectious disease epidemic, intensifying the practice.24 Additional study is needed to examine why the preventive behavioral practice increased during COVID-19 outbreak, and to understand how differences in preventive behavioral practices affected the transmission during repeated and different emerging infectious disease outbreaks.
Second, affective risk perception consistently influenced transmission-reducing behavioral practice during the 2020 COVID-19 and 2015 MERS-CoV. This is similar to previous studies' results showing that risk perception is associated with non-pharmaceutical preventive behaviors.1516202225 However, there is need to investigate for further understanding, the association between risk perception (affective and cognitive) and preventive behaviors.19
Third, our results, showing that low level of trust in the president and identification of opposition party influenced preventive behavioral practice during 2015 MERS-CoV but not during 2020 COVID-19 are inconsistent with those of previous studies.1517 Differences in the Korean government's responses to the two different emerging infectious disease epidemics could have affected how the public perceived the image of the president and the ruling party, as well as the trust in the government.9141926272829303132 Further research is needed to understand the conditions of trust in the president and identification of a party that could affect preventive behavioral practices.
However, this study has some limitations. First, that this study used surveys on self-reported practices could mean that the data could be different from those obtained through observed practices. Therefore, there could have been measurement errors. (i.e., social desirability bias, ‘Yes-saying’ bias) However, surveys of observed practices are difficult to conduct during health crisis. Second, this study used a cross-sectional design; hence, it could not establish causal relations. Third, risk perception (affective and cognitive reactions) was not fully surveyed during the outbreaks, limiting the interpretation of findings. Fourth, the current study could not evaluate the intensity of the preventive behaviors. Finally, because of the unexpected rapidly evolving outbreak, this study could not examine the validity of the questionnaire using a test-retest design.
In conclusion, the present study suggests, for the first time, the level of the practice rate of non-pharmaceutical preventive behaviors and influencing factors during 2020 COVID-19 and 2015 MERS-CoV in Korea. Affective risk perception can increase practicing reducing transmission measures and it can be used to prevent the failure of preventive behavior management. To understand the mechanism of behavioral immunity, further exertions are needed behind the citizens, the governmental public health sector, as well as the academic society. Strategic interventions to suppress the spread of infectious diseases based on preventive behaviors works through cooperation of individuals with regulations and will be a salient contribution to a quick end to COVID-19 pandemic. Thus, policies to guide such strategic interventions need to be developed.

ACKNOWLEDGMENTS

We would like to thank Gallup Korea, an affiliation of Gallup International, for supporting surveys and data collection for this manuscript.

Notes

Disclosure: The authors have no potential conflicts of interest to disclose.

Author Contributions:

  • Conceptualization: Jang WM, Lee JY.

  • Data curation: Jang DH, Lee JY.

  • Formal analysis: Jang DH.

  • Investigation: Jang DH.

  • Methodology: Jang WM, Jang DH.

  • Supervision: Lee JY.

  • Writing - original draft: Jang WM, Lee JY.

  • Writing - review & editing: Jang WM, Jang DH, Lee JY.

References

1. World Health Organization. Basic protective measures against the new coronavirus. Updated 2020. Accessed April 10, 2020. https://www.who.int/emergencies/diseases/novel-coronavirus-2019/advice-for-public.
2. Cowling BJ, Ali ST, Ng TWY, Tsang TK, Li JCM, Fong MW, et al. Impact assessment of non-pharmaceutical interventions against coronavirus disease 2019 and influenza in Hong Kong: an observational study. Lancet Public Health. 2020; 5(5):e279–e288. PMID: 32311320.
crossref
3. Prem K, Liu Y, Russell TW, Kucharski AJ, Eggo RM, Davies N, et al. The effect of control strategies to reduce social mixing on outcomes of the COVID-19 epidemic in Wuhan, China: a modelling study. Lancet Public Health. 2020; 5(5):e261–70. PMID: 32220655.
4. Wölfel R, Corman VM, Guggemos W, Seilmaier M, Zange S, Müller MA, et al. Virological assessment of hospitalized patients with COVID-2019. Nature. 2020; 581(7809):465–469. PMID: 32235945.
crossref
5. Noh JY, Seong H, Yoon JG, Song JY, Cheong HJ, Kim WJ. Social distancing against COVID-19: implication for the control of influenza. J Korean Med Sci. 2020; 35(19):e182. PMID: 32419400.
crossref
6. Na BJ, Park Y, Huh IS, Kang CR, Lee J, Lee JY. Seventy-two hours, targeting time from first COVID-19 symptom onset to hospitalization. J Korean Med Sci. 2020; 35(20):e192. PMID: 32449328.
crossref
7. Fung IC, Cairncross S. Effectiveness of handwashing in preventing SARS: a review. Trop Med Int Health. 2006; 11(11):1749–1758. PMID: 17054756.
crossref
8. Tracht SM, Del Valle SY, Hyman JM. Mathematical modeling of the effectiveness of facemasks in reducing the spread of novel influenza A (H1N1). PLoS One. 2010; 5(2):e9018. PMID: 20161764.
crossref
9. Park EC. Central government reform to improve national disease control. J Korean Med Assoc. 2015; 58(8):714–722.
crossref
10. Song DY, Lee WK. Severe acute respiratory syndrome, SARS. Korean J Clin Microbiol. 2005; 8(2):105–112.
11. Choi JK, Lee SW, Choi BY. Epidemiological characteristics of imported influenza A (H1N1) cases during the 2009 pandemic in Korea. Epidemiol Health. 2012; 34:e2012009. PMID: 23316418.
crossref
12. Korea Centers for Disease Control and Prevention. Updates on COVID-19 in Korea. Updated 2020. Accessed April 28, 2020. http://ncov.mohw.go.kr/en/tcmBoardView.do?brdId=12&brdGubun=125&dataGubun=&ncvContSeq=2069&contSeq=2069&board_id=&gubun=.
13. Day M. Covid-19: surge in cases in Italy and South Korea makes pandemic look more likely. BMJ. 2020; 368:m751. PMID: 32098875.
crossref
14. Korean Society of Infectious Diseases. Korean Society of Pediatric Infectious Diseases. Korean Society of Epidemiology. Korean Society for Antimicrobial Therapy. Korean Society for Healthcare-associated Infection Control and Prevention. Korea Centers for Disease Control and Prevention. Report on the epidemiological features of coronavirus disease 2019 (COVID-19) outbreak in the Republic of Korea from January 19 to March 2, 2020. J Korean Med Sci. 2020; 35(10):e112. PMID: 32174069.
15. Jang WM, Cho S, Jang DH, Kim UN, Jung H, Lee JY, et al. Preventive behavioral responses to the 2015 Middle East respiratory syndrome coronavirus outbreak in Korea. Int J Environ Res Public Health. 2019; 16(12):2161.
crossref
16. Lee SY, Yang HJ, Kim G, Cheong HK, Choi BY. Preventive behaviors by the level of perceived infection sensitivity during the Korea outbreak of Middle East respiratory syndrome in 2015. Epidemiol Health. 2016; 38:e2016051. PMID: 28092927.
17. Lee KM, Jung K. Factors influencing the response to infectious diseases: Focusing on the case of SARS and MERS in South Korea. Int J Environ Res Public Health. 2019; 16(8):1432.
crossref
18. Machida M, Nakamura I, Saito R, Nakaya T, Hanibuchi T, Takamiya T, et al. Adoption of personal protective measures by ordinary citizens during the COVID-19 outbreak in Japan. Int J Infect Dis. 2020; 94:139–144. PMID: 32283285.
crossref
19. Jang WM, Kim UN, Jang DH, Jung H, Cho S, Eun SJ, et al. Influence of trust on two different risk perceptions as an affective and cognitive dimension during Middle East respiratory syndrome coronavirus (MERS-CoV) outbreak in South Korea: serial cross-sectional surveys. BMJ Open. 2020; 10(3):e033026.
crossref
20. Bults M, Beaujean DJ, de Zwart O, Kok G, van Empelen P, van Steenbergen JE, et al. Perceived risk, anxiety, and behavioural responses of the general public during the early phase of the Influenza A (H1N1) pandemic in the Netherlands: results of three consecutive online surveys. BMC Public Health. 2011; 11(1):2. PMID: 21199571.
crossref
21. Heo JY, Chang SH, Go MJ, Kim YM, Gu SH, Chun BC. Risk perception, preventive behaviors, and vaccination coverage in the Korean population during the 2009–2010 pandemic influenza A (H1N1): comparison between high-risk group and non-high-risk group. PLoS One. 2013; 8(5):e64230. PMID: 23691175.
crossref
22. Kim SJ, Han JA, Lee TY, Hwang TY, Kwon KS, Park KS, et al. Community-based risk communication survey: risk prevention behaviors in communities during the H1N1 crisis, 2010. Osong Public Health Res Perspect. 2014; 5(1):9–19. PMID: 24955307.
crossref
23. Lau JT, Yang X, Tsui H, Kim JH. Monitoring community responses to the SARS epidemic in Hong Kong: from day 10 to day 62. J Epidemiol Community Health. 2003; 57(11):864–870. PMID: 14600111.
crossref
24. Chen H, Xu W, Paris C, Reeson A, Li X, et al. Social distance and SARS memory: impact on the public awareness of 2019 novel coronavirus (COVID-19) outbreak. medRxiv. Forthcoming. 2020.
crossref
25. Jones JH, Salathé M. Early assessment of anxiety and behavioral response to novel swine-origin influenza A(H1N1). PLoS One. 2009; 4(12):e8032. PMID: 19997505.
crossref
26. Vinck P, Pham PN, Bindu KK, Bedford J, Nilles EJ. Institutional trust and misinformation in the response to the 2018–19 Ebola outbreak in North Kivu, DR Congo: a population-based survey. Lancet Infect Dis. 2019; 19(5):529–536. PMID: 30928435.
crossref
27. Siegrist M, Cvetkovich G. Perception of hazards: the role of social trust and knowledge. Risk Anal. 2000; 20(5):713–719. PMID: 11110217.
28. Choi JW, Kim KH, Moon JM, Kim MS. Public health crisis response and establishment of a crisis communication system in South Korea: lessons learned from the MERS outbreak. J Korean Med Assoc. 2015; 58(7):624–634.
crossref
29. Choe SH. MERS tarnishes Korean president's image as leader. Updated 2015. Accessed April 9, 2020. https://www.nytimes.com/2015/06/13/world/mers-tarnishes-korean-presidents-image-as-leader.html.
30. Kim EY, Liao Q, Yu ES, Kim JH, Yoon SW, Lam WW, et al. Middle East respiratory syndrome in South Korea during 2015: Risk-related perceptions and quarantine attitudes. Am J Infect Control. 2016; 44(11):1414–1416. PMID: 27130900.
crossref
31. Bicker L. Coronavirus in South Korea: how ‘trace, test and treat’ may be saving lives. Updated 2020. Accessed April 11, 2020. https://www.bbc.com/news/world-asia-51836898.
32. Fisher M, Choe SH. How South Korea flattened the curve. Updated 2020. Accessed April 14, 2020. https://www.nytimes.com/2020/03/23/world/asia/coronavirus-south-korea-flatten-curve.html.

SUPPLEMENTARY MATERIALS

Supplementary Data 1

Questionnaire.
jkms-35-e220-s001.doc

Supplementary Data 2

Questionnaire (Korean).
jkms-35-e220-s002.doc
TOOLS
Similar articles