

 PDF
PDF Citation
 Print
Print


INTRODUCTION
The prevalence of major depressive disorder in patients with end-stage renal disease (ESRD) is higher than in patients with diabetes mellitus (DM) or congestive heart failure.1 However, it is difficult to prescribe antidepressants because of concerns about the potential adverse effects in patients with chronic kidney disease (CKD).123
Repetitive transcranial magnetic stimulation (rTMS) has emerged as an effective and safe alternative to treat depression in patients who have difficulty taking antidepressants.45 rTMS involves a noninvasive device that generates a magnetic field with an electromagnetic coil and transmits a repetitive magnetic pulse to the cerebral cortex 1 to 2 cm below the coil.6 This stimulation not only increases or decreases cortical excitability in certain brain regions but also induces changes in the associated neuronal networks.6 rTMS of the dorsolateral prefrontal cortex (DLPFC) improves depression symptoms by affecting the functional connectivity between the brain networks related to depression.78 Of several protocols that stimulate the DLPFC, previous studies have specifically demonstrated the anti-depressive effects of high-frequency (> 1 Hz) rTMS of the left DLPFC.9
Frontal alpha asymmetry (FAA) measurement can be used to evaluate the functions of the prefrontal cortex, as it is known to be related to mood and anxiety.10 Lower left prefrontal alpha activity may reflect greater relative left prefrontal activation, because alpha activity is considered as an idle rhythm.11 Greater relative left prefrontal activity is related to positive mood and approach motivations. On the contrary, lower right prefrontal alpha activity may reflect greater relative right prefrontal activation, which is related to anxiety and negative mood.12 While alpha activity may have a trait-like nature,13 studies have reported a change in alpha asymmetry during therapeutic interventions. FAA values have therefore been used in previous studies to evaluate the effects of therapeutic interventions on mood and anxiety disorders.141516
To date, cognitive behavioral therapy and exercise therapy have been considered as nonpharmacologic treatments for patients with depression and CKD or ESRD.17 No studies have investigated the effect of rTMS in depressed patients with CKD or ESRD. We studied the therapeutic effect of rTMS as a nonpharmacologic treatment in depressed hemodialysis patients. We hypothesized that rTMS would improve the mental health and clinical outcomes in depressed hemodialysis patients. In addition, we hypothesized that these improvements would be associated with improved quantitative electroencephalography (EEG) parameters, i.e., FAA values reflecting an increase in relative left prefrontal activation.
Go to : 
METHODS
Study participants
We recruited ESRD patients in the Chung-Ang University Hospital who 1) were receiving maintenance hemodialysis between April and June 2017 and 2) scored ≥ 5 on the Patient Health Questionnaire-9 (PHQ-9), indicating mild to severe depression.18 The PHQ-9 is a nine-item instrument designed to screen the presence and severity of depression in a primary care setting.18 All participants were screened by psychiatrists using the Structured Clinical Interview for DSM-5 Disorders: Clinician Version (SCID-5-CV).19 Hemodialysis patients diagnosed with major depressive disorder based on the SCID-5-CV were included. The exclusion criteria were as follows: 1) past or current psychiatric diagnosis, other than major depressive disorder, 2) conductive metal around the head, 3) prescription of antidepressants, anticonvulsants, or other psychiatric drugs within the previous month, 4) self-reported left-handedness, and 5) history of epilepsy, head trauma, or neurocognitive disorder. Of the 81 patients undergoing hemodialysis in the hemodialysis unit of the Chung-Ang University Hospital, 51 responded to the PHQ-9. Two respondents were excluded because they had a major neurocognitive disorder (Alzheimer's disease). Of the remaining 49 patients, 32 were diagnosed with major depressive disorder; 17 patients agreed to participate in the final rTMS study and were randomized. We performed a per-protocol analysis of the 13 randomized patients who completed the protocol. The sample size was calculated with a two-sided 5% significance level, a power of 80%, and a sample size of 7 patients per group.
We collected and analyzed clinical indices, including laboratory data, before and after rTMS. We also collected quantitative EEG data and results from various psychiatric questionnaires (Beck Depression Inventory-II [BDI-II],3 Beck Anxiety Inventory [BAI],20 Symptom Checklist-90-Revised Somatization Subscale [SCL-90R-SOM],21 and Perceived Stress Scale [PSS]22).
Demographic and laboratory data collection
Demographic variables of age, sex, CKD cause (DM vs. non-DM), dialysis vintage, smoking status, and comorbidities (Charlson Comorbidity Index [CCI])23 were collected. The CCI has been well validated in populations with various chronic diseases, including dialysis and ESRD.242526
The following parameters were collected at baseline and 1 month after rTMS: interdialytic weight gain (IDWG), systolic and diastolic blood pressure at pre-/post-dialysis, and laboratory blood tests (hemoglobin/hematocrit, blood urea nitrogen/creatinine, calcium, phosphorus, potassium, total cholesterol, albumin, iron/total iron binding capacity, ferritin, and intact parathyroid hormone [iPTH]; and for DM patients, glucose and hemoglobin A1c [HbA1c]). Among these parameters, serum phosphorus, potassium, and HbA1c levels were considered to be indicative of patient compliance.27
TMS protocol and psychological data collection
The rTMS group was stimulated with a 110% motor threshold and 10 Hz on the left DLPFC for 20 minutes, three times a week, for 4 weeks. In the sham group, the “1-wing 90 degree method” was used to prevent the effective magnetic field from being transmitted to the subjects.2829 We collected and analyzed clinical indices before and after rTMS, gathered data using quantitative EEG, and tabulated the results of various psychiatric questionnaires (BDI-II, BAI, SCL-90R-SOM, and PSS). BDI-II and BAI results were used to assess depression symptoms and anxiety, respectively. Previous studies have established the high internal consistency and validity of both these tools.2030 The SCL-90R evaluates various symptoms of psychopathology.21 The somatization subscale (SCL-90R-SOM) includes 12 items rated using a five-point Likert scale to measure distress arising from the perception of physical complaints pertaining to autonomic control and muscle pain.31 The PSS is a commonly used 10-item instrument that measures the degree to which a responder feels stress.22
EEG data collection and EEG preprocessing
EEG recordings were performed by EEG technicians in an electromagnetically shielded room. Using the 21-channel CMXL-P230 EEG system (Grass-Telefactor, West Warwick, RI, USA), EEG activity was recorded for 10 minutes while participants' eyes were closed. Participants were asked to relax and stay awake during the recording. Based on the International 10/20 system, EEG data were obtained from 19 electrodes placed on the scalp at Fp1, Fp2, F3, F4, F7, F8, Fz, C3, C4, Cz, T3, T4, T5, T6, P3, P4, Pz, O1, and O2. Two additional electrodes were positioned on the ear lobe with A2 as the reference and A1 as the ground. EEG signal was band-pass filtered at 0.5 to 46.0 Hz, with a 60-Hz notch, and electrode impedances were < 5 kΩ. Data were sampled at a frequency of 256 Hz.
EEG data analysis was conducted using NeuroSpeed software (Alpha Trace Medical Systems, Vienna, Austria). For EEG analyses, artifact-free 300-second periods were extracted from raw EEG data. Epochs containing artifacts were removed by visual inspection. Next, FAA values were estimated over the frontal area by subtracting the natural log of the alpha power (7.5–12.5 Hz) of the left frontal electrode from that of the right frontal electrode. Based on previous studies,32 we chose electrodes for the mid-frontal (F3 and F4) and mid-lateral (F7 and F8) regions. Thus, a high score meant relatively high right alpha activity, reflecting greater activation of the left frontal region than the right frontal region.
Statistical analysis
Categorical data were compared using χ2 or Fisher's exact tests, and continuous variables were analyzed through an independent t-test or the Mann-Whitney U test according to the normality test. The normality test was performed using the Shapiro-Wilk test. The change in laboratory and psychological parameters between baseline and 1 month post-rTMS were evaluated by repeated measures analysis of variance.
All reported P values were two-sided, and P values < 0.05 were considered statistically significant. Data manipulation and statistical analyses were conducted using R version 3.4.4 (R Foundation for Statistical Computing, Vienna, Austria) and the SPSS 20 Statistical Package (SPSS Inc., Chicago, IL, USA).
Ethics statement
The present study is a randomized clinical trial and is registered at the Clinical Research Information Service (CRIS, http://cris.nih.go.kr; number KCT0004082). All clinical investigations were conducted in accordance with the 2013 Declaration of Helsinki and the guidelines of good clinical practice. The Institutional Review Board of Chung-Ang University Hospital reviewed and approved the study protocol (approval No. 1730-003-272). Written informed consent was obtained from all patients before their inclusion in the study.
Go to :
RESULTS
Patients' demographic and clinical characteristics
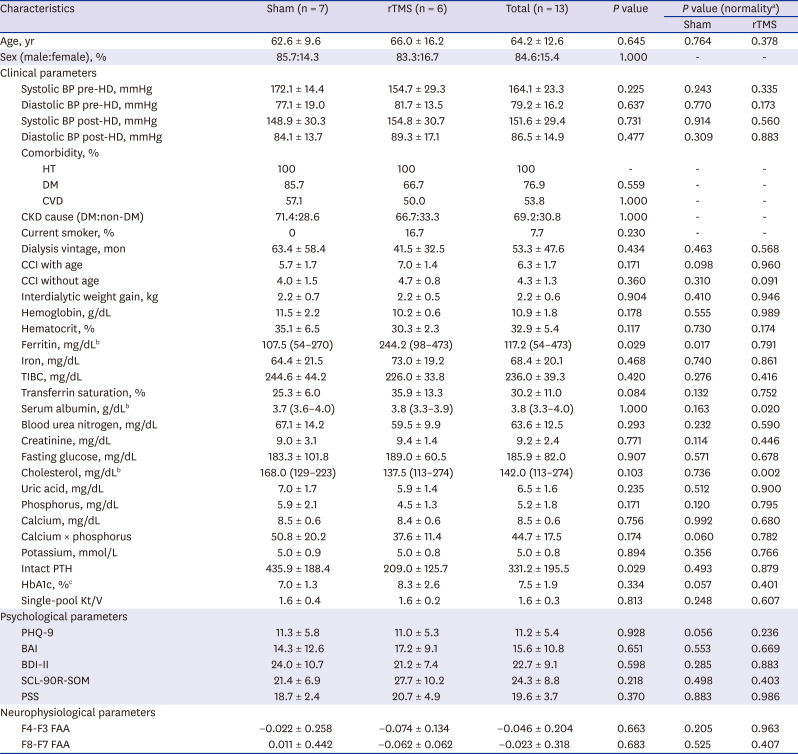
In this study, 14 patients were randomized: 7 to the sham group and 7 to the rTMS group. One patient in the rTMS group withdrew consent after five rTMS sessions; thus, 13 patients were included in the final analyses (Fig. 1). The characteristics of the study population are summarized in Table 1. The sham group patients had lower ferritin and higher iPTH levels than the rTMS group patients. Although not statistically significant, the rTMS group patients were older and had shorter dialysis durations, higher CCIs, and lower serum phosphorus and higher HbA1c levels. No differences were found in other profiles, such as serum potassium level, dialysis efficiency (single-pool Kt/V), psychological scale scores (BDI-II, BAI, SCL-90R-SOM, and PSS), and FAA values on quantitative EEG.
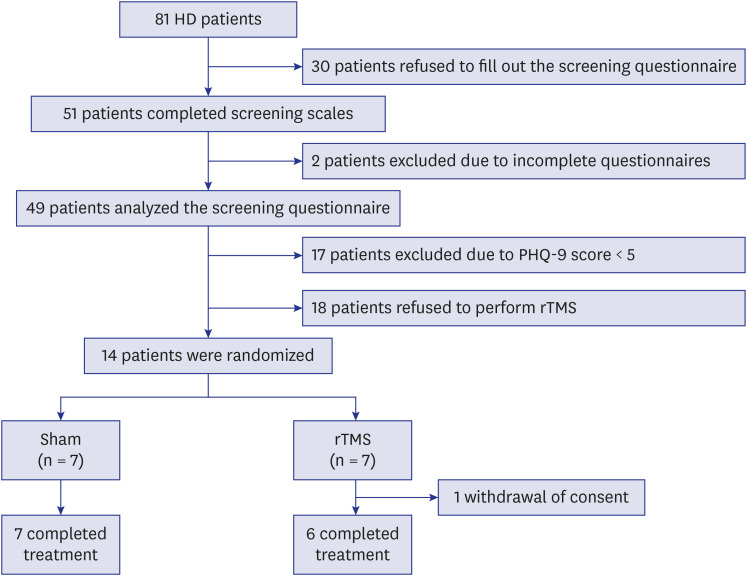 | Fig. 1Study flow chart.HD = hemodialysis, PHQ-9 = Patient Health Questionnaire-9, rTMS = repetitive transcranial magnetic stimulation.
|
Table 1
Baseline characteristics of the sham and rTMS groups
BAI = Beck Anxiety Inventory, BDI-II = Beck Depression Inventory-II, BP = blood pressure, CCI = Charlson comorbidity Index, CKD = chronic kidney disease, CVD = cardiovascular disease, DM = diabetes mellitus, FAA = frontal alpha asymmetry, HbA1c = hemoglobin A1c, HD = hemodialysis, HT = hypertension, K = dialyzer clearance of urea, t = dialysis time, V = urea distribution volume, TIBC = total iron binding capacity, PHQ-9 = Patient Health Questionnaire-9, PSS = Perceived Stress Scale, PTH = parathyroid hormone, rTMS = repetitive transcranial magnetic stimulation, SCL-90R-SOM = Symptom Checklist-90-Revised Somatization Subscale.
aNormality test performed by Shapiro-Wilk test; bMann-Whitney tests for ferritin, serum albumin, and cholesterol did not satisfy the normality test; cHbA1c examined only in DM patients (n = 6 for the sham group, n = 4 for the rTMS group).
![]()
Differences in demographics, clinical characteristics, and psychological scale scores after rTMS among the study groups
When laboratory findings were compared 1 month after rTMS, HbA1c levels significantly improved in the rTMS group (8.3% to 7.1%, P = 0.046) (Table 2). The changes in HbA1c levels in the rTMS group were significantly greater than those in the sham group (F = 6.687, P = 0.032).
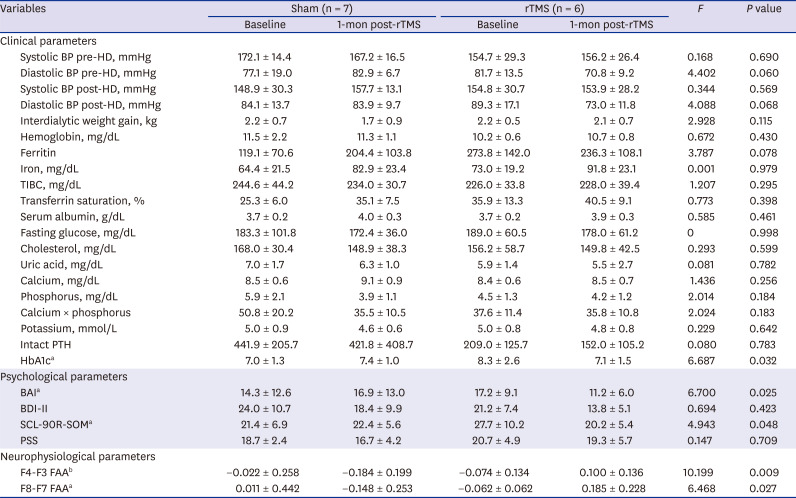
Table 2
One-month post-rTMS outcomes
rTMS = repetitive transcranial magnetic stimulation, BAI = Beck Anxiety Inventory, BDI-II = Beck Depression Inventory-II, BP = blood pressure, FAA = frontal alpha asymmetry, HbA1c = hemoglobin A1c, HD = hemodialysis, TIBC = total iron binding capacity, PSS = Perceived Stress Scale, PTH = parathyroid hormone, SCL-90R-SOM = Symptom Checklist-90-Revised Somatization Subscale.
aP < 0.05; bP < 0.01.
![]()
BDI-II scores improved both in the sham group (24.0 to 18.4, P = 0.009) and rTMS group (21.2 to 13.8, P = 0.005), but there was no statistically significant difference in the changes between the groups (Figs. 2 and 3). The changes in BAI scores in the rTMS group were significantly greater than those in the sham group (F = 6.700, P = 0.025), and the changes in SCL-90R-SOM scores in the rTMS group were greater than those in the sham group (F = 4.943, P = 0.048).
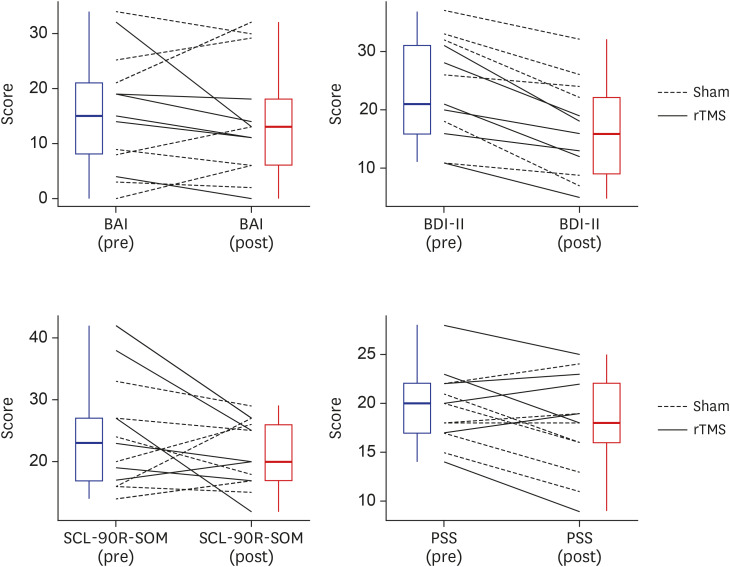 | Fig. 2Changes in psychological scale scores pre- and post-rTMS.BAI = Beck Anxiety Inventory, BDI-II = Beck Depression Inventory-II, PSS = Perceived Stress Scale, rTMS = repetitive transcranial magnetic stimulation, SCL-90R-SOM = Symptom Checklist-90-Revised Somatization Subscale.
|
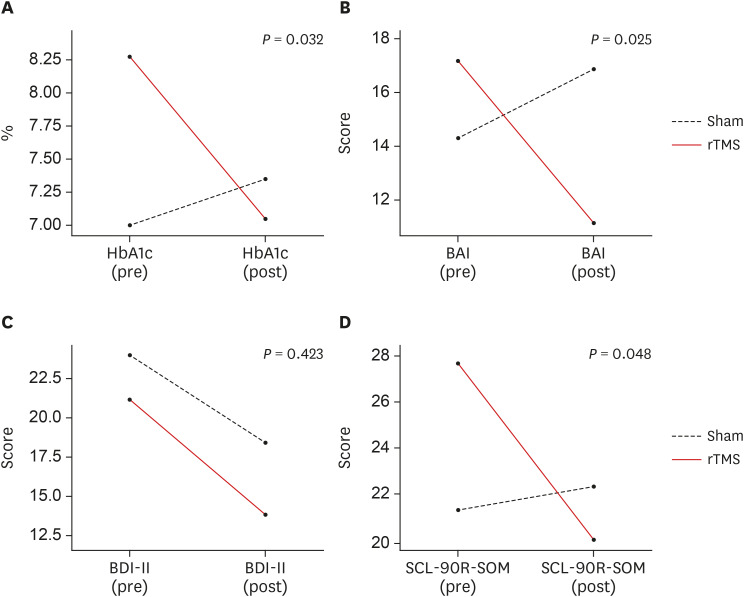 | Fig. 3Changes in HbA1c levels and psychological scale scores due to intervention. (A) HbA1c levels (%) were significantly improved in the rTMS group (8.3% to 7.1%, P = 0.046) but not in the sham group (7.0% to 7.4%, P = 0.318). The changes in HbA1c levels in the rTMS group were significantly greater than those in the sham group (F = 6.687, P = 0.032). (B) While BAI scores did not significantly improve in the sham group (14.3 to 16.9, P = 0.258) or rTMS group (17.2 to 11.2, P = 0.074), the changes in BAI scores in the rTMS group were significantly greater than those in the sham group (F = 6.700, P = 0.025). (C) BDI-II scores improved both in the sham group (24.0 to 18.4, P = 0.009) and rTMS group (21.2 to 13.8, P = 0.005). However, there were no statistically significant differences in the changes in BDI-II scores between the groups (F = 0.694, P = 0.423). (D) While SCL-90R-SOM scores did not significantly improve in the sham group (21.4 to 22.4, P = 0.675) or rTMS group (27.7 to 20.2, P = 0.065), the changes in SCL-90R-SOM scores in the rTMS group were greater than those in the sham group (F = 4.943, P = 0.048).BAI = Beck Anxiety Inventory, BDI-II = Beck Depression Inventory-II, HbA1c = hemoglobin A1c, rTMS = repetitive transcranial magnetic stimulation, SCL-90R-SOM = Symptom Checklist-90-Revised Somatization Subscale.
|
Quantitative EEG
The changes in the F4-F3 FAA value in the rTMS group were significantly greater than those in the sham group (F = 10.199, P = 0.009) (Fig. 4), and the changes in the F8-F7 FAA value in the rTMS group were greater than those in the sham group (F = 6.468, P = 0.027).
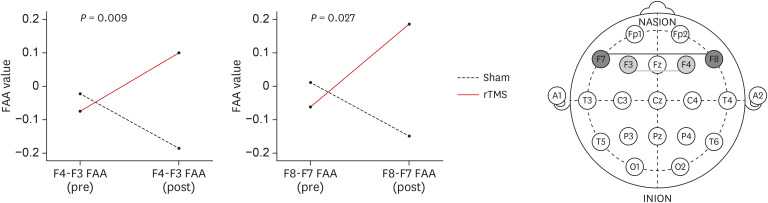 | Fig. 4Changes in mean FAA values. In the rTMS group, the F4-F3 FAA value (−0.074 to 0.100, P = 0.074) and F8-F7 FAA value (−0.062 to 0.185, P = 0.086) showed no significant changes, although there was a general increasing tendency. The sham group showed no significant changes in either the F4-F3 FAA value (−0.022 to −0.184, P = 0.064) or F8-F7 FAA value (0.011 to −0.148, P = 0.197). The changes in the F4-F3 FAA value (F = 10.199, P = 0.009) and F8-F7 FAA value (F = 6.468, P = 0.027) in the rTMS group were significantly greater than those in the sham group.FAA = frontal alpha asymmetry, rTMS = repetitive transcranial magnetic stimulation.
|
Adverse events
No patient complaints were received regarding side effects or discomfort related to the intervention during the study.
Go to :
DISCUSSION
To date, no studies have investigated the effect of rTMS in depressed patients with CKD or ESRD using quantitative EEG. In this study, rTMS in ESRD patients with depression was found to significantly improve BDI-II and BAI scores and improve HbA1c levels. These results were accompanied by significant changes in quantitative EEG results. Our results show that rTMS can improve not only depression and anxiety symptoms in dialysis patients burdened with pharmacologic treatment but also some clinical indicators.
In this study, depression level, as measured by the BDI-II, was improved both in the sham and rTMS groups, but there were no statistically significant differences in the changes in depression level between the two groups. The changes in the level of anxiety and somatic symptoms in the rTMS group were greater than those in the sham group. Anxiety is a common mental condition that is often overlooked in hemodialysis patients.33 Patient behaviors that are superficially irrational or that conflict with staffs or physicians, including behavioral non-adherence, could be an expression of underlying anxiety.33 Anxiety should be cautiously monitored and treated because it is related to depression, perceived poor quality of life, and deterioration in behavioral adherence. rTMS has been shown to be effective for anxiety symptoms in patients with major depressive disorder,34 and it can reduce overall anxiety and depression symptoms in patients with posttraumatic stress disorder.35 There are few studies on the effect of rTMS on somatic symptoms; however, previous studies have shown that rTMS has potential usefulness in the treatment of chronic pain conditions, such as neuropathic pain, fibromyalgia, and complex regional pain syndrome.36 Although there is a need for further research, the mechanisms of the analgesic effects of rTMS may involve improvement in the functioning within the DLPFC, anterior cingulate cortex, and sensory cortex, via enhancement of the endogenous opioid system.37 In fact, it is difficult to explain exactly why there were no significant differences in the changes in depression level between the two groups in this study. This may be because the physical component of depression might be confounding in patients with severe physical diseases.3839 Larger studies, including a factor analysis, are needed to explain the reason.
In this study, HbA1c levels markedly improved in the rTMS group, and the changes in HbA1c levels in the rTMS group were significantly greater than those in the sham group. HbA1c represents cumulative glycemic control within the previous 3 or 4 months, and it reflects patients' daily lifestyles. The rTMS group patients had poorly controlled DM at baseline, but marked improvement in HbA1c levels was achieved after one month of intervention. Both depression and DM can be triggered by shared mechanisms: biological risk factors, such as the hypothalamic-pituitary-adrenal axis and inflammation responses, and behavioral risk factors, such as poor eating habits, sleep problems, and sedentary lifestyle.40 Depression is known to increase the risk of hyperglycemia and insulin resistance in diabetic patients due to unhealthy lifestyles associated with a depressed state, including sedentariness, smoking, and alcohol abuse.41 Therefore, we could speculate that the improved HbA1c levels in this study may reflect a continuous improvement in lifestyle. Considering the improvement in psychological scale scores and quantitative EEG results, it is thought that rTMS improved depressed mood and induced an improvement in lifestyle itself, an essential factor for patients' glycemic control. In addition to HbA1c levels, there are several indicators of compliance with medication and dietary habits in dialysis patients including IDWG; serum phosphorus, potassium, and glucose levels; and blood pressure readings. However, we found no meaningful differences in the changes of these indicators in this study, which may be due to differences in baseline characteristics. In this study, the baseline phosphorus value of the sham group was high but not statistically significant. This may be because although randomization was performed, a small number of patients participated in the study, and an unavoidable bias occurred. The rTMS group had well-regulated serum phosphorus levels at baseline. Taking these things into consideration, secondary hyperparathyroidism (high serum iPTH levels), the occurrence of which is related to long-standing hyperphosphatemia, more than doubled between the two groups.
In this study, the change in F4-F3 and F8-F7 FAA values in the rTMS group was significantly greater than that in the sham group during the intervention. Lower left prefrontal alpha activity (greater relative left prefrontal activation) is related to positive mood, and lower right prefrontal alpha activity (greater relative right prefrontal activation) is related to anxiety and negative mood.12 In a study on mindfulness-based cognitive therapy in patients with a history of suicidal depression, the “treatment as usual” group showed a significant worsening in reduced relative left prefrontal activation compared to the mindfulness-based cognitive therapy group. In a study on cognitive behavioral therapy for patients with posttraumatic stress disorder, there was a greater reduction of right anterior activation, indicating a greater increase in relative left prefrontal activation, in the cognitive behavioral therapy group compared to wait-list controls.15 Similarly, in this study, rTMS in depressed hemodialysis patients appeared to result in increased F4-F3 and F8-F7 FAA values, reflecting greater relative left prefrontal activation and a positive emotional state.
rTMS has been consistently reported to have few severe side effects.942434445 In a study examining the safety data of rTMS in 325 depressed patients, very few patients reported severe adverse events associated with rTMS, and none experienced death or seizures.46 Seizures are the most dangerous side effect of rTMS; however, despite the extensive practice of rTMS, the incidence of rTMS-induced seizures is very low.44 In the present study, we minimized this risk by excluding patients with seizure-related risk factors (history of epilepsy, history of head trauma or stroke, and current psychiatric drug use) and setting stimulation parameters according to safety guidelines.44 The most common side effects of rTMS are headaches and discomfort at the stimulation site.9 In many studies, these side effects were mild and transient, and drop-outs due to these events were rare.434546 In this study, none of the participants complained of significant adverse events, and the reason four of the patients dropped out after randomization was because they were unable to schedule the rTMS therapy three times a week. The drop-out rate in this study was less than 10%, and there was no difference in the drop-out rate between the sham and active groups, suggesting that rTMS could be a tolerable treatment.42
There are some limitations to this study. The sample size of this study was small, and the original 14 patients in the sample size calculation decreased to 13 patients in the final analysis due to the withdrawal of one patient. When we conducted a post hoc analysis, power was calculated to be 88% with a two-sided 5% significance level and an effect size of 0.68. Although this study was conducted using a small number of patients, it could be the cornerstone of future studies conducted with a large number of patients in multiple centers or to verify long-term effects based on the positive effects seen in this study.
To our knowledge, this is the first study to evaluate rTMS as a non-pharmaceutical alternative for hemodialysis patients with depression who may be vulnerable to potential adverse effects of pharmacotherapy. In patients who underwent rTMS, clinical indicators, mental health scale scores, and quantitative EEG findings improved compared to those in the control group. Based on this study, future studies could be conducted to evaluate the long-term effects and side effects of rTMS on depressed hemodialysis patients.
Go to :
 XML Download