

 PDF
PDF Citation
 Print
Print


INTRODUCTION
Mycophenolic acid (MPA) is a widely used first-line immunosuppressant for preventing acute rejection after kidney transplantation (KT). MPA is a non-competitive, reversible inhibitor of inosine monophosphate dehydrogenase, resulting in the inhibition of guanine nucleotide biosynthesis. Consequently, it blocks T- and B-lymphocyte proliferation.1 MPA is highly protein bound, metabolized in the liver, and primarily eliminated by the kidneys. The MPA blood concentration can be affected by several factors and leads to wide inter- and intra-individual variability.2 For a fixed MPA dose of 1g twice daily, MPA exposure can vary by approximately 10-fold.3 Therefore, therapeutic drug monitoring (TDM) for MPA has received attention in the transplant area.
Previous studies have shown the significant association between MPA TDM and clinical outcomes using the MPA area under the curve (AUC) or pre-dose MPA trough concentration (MPA C0) in kidney transplant recipients (KTRs). Van Gelder et al.4 demonstrated that MPA AUC is related to the incidence of biopsy-proven rejection and the therapeutic AUC range of MPA is from 30 to 60 mg h/L after KT. Le Meur et al.5 reported that therapeutic MPA monitoring using a limited sampling strategy can reduce the risk of treatment failure and acute rejection in KTRs. Although MPA C0 was not correctly correlated with MPA AUC, several studies have shown an association between MPA C0 and rejection and toxicity, and an MPA C0 between 1.0 and 3.5 μg/mL was suggested as an optimal therapeutic target.6789 However, some studies comparing a fixed dose of MPA and a controlled dose of MPA failed to demonstrate the efficacy of the latter.1011 The Transplantation Society consensus meeting recommended TDM for MPA in high-risk KTRs, patients with delayed graft function, patients excluding induction therapy, corticosteroids, or calcineurin inhibitor (CNI), or patients with CNI minimization. However, there has been no definite consensus on MPA TDM and MPA TDM is currently used in a few transplant centers. Furthermore, little is known regarding the safe fixed dose of MPA for preventing biopsy-proven acute rejection (BPAR) in KTRs.
Our transplant center measured MPA C0 on a routine basis through particle-enhanced turbidimetric inhibition immunoassay (PETINIA), the efficacy of which was previously proven through a comparative study with liquid chromatography combined with mass spectrometry.12 This study aimed to investigate the correlation of MPA C0 and MPA dose with adverse events and transplant outcomes after KT.
Go to : 
METHODS
Patients and immunosuppression
This study included 79 consecutive patients who underwent KT at Kyungpook National University Hospital. All KTRs received MPA, tacrolimus (TAC), and corticosteroids as immunosuppressant therapy. Mycophenolate mofetil (MMF) or enteric-coated mycophenolate sodium (EC-MPS) were administered. MPA was initially given at a fixed dose of 750 mg of MMF or 540 mg of EC-MPS every 12 hours. The MPA dosage was adjusted based on the physician's decision according to the immunologic risk of each patient. TAC was initially given at a dose of 0.05 mg/kg every 12 hours. The TAC dosage was adjusted based on the physician's decision according to the TAC C0 results to maintain the target TAC C0 ranging from 5–10 ng/mL.13 A dose of 500 mg of intravenous methylprednisolone was given during surgery and tapered to 5 mg/day of oral prednisolone after 3 months. Information regarding the dose of the administered immunosuppressive agent and TDM of MMF, EC-MPS, and TAC was collected. This study only evaluated the trough levels and immunosuppressant dose before adverse events occurred.
Assays for TDM of MPA and TAC
The MPA C0 of all KTRs was monitored weekly within the first month post-transplant and monthly thereafter for up to 12 months. MPA C0 was measured using PETINIA (Siemens Healthcare Diagnostics Inc., Malvern, PA, USA), and the blood chemistry results of each patient were collected during sampling. TAC trough levels were obtained from peripheral blood samples taken 12 hours after the administration of the last TAC dose. TAC C0 was measured using the Architect TAC assay (Abbott Diagnostics, Lake Forest, IL, USA). The coefficient of variation (CV, %) was defined as the standard deviation/mean trough level of the immunosuppressant × 100 to determine within-patient variability in immunosuppressant trough levels.14
Clinical endpoints
The clinical endpoints include BPAR, leukopenia defined as total white cell count below 4.0 × 10³/μL, anemia defined as hemoglobin count below 10 g/dL, thrombocytopenia defined as platelet count below 150.0 × 10³/μL, viral infection consisting of BK virus infection defined as an occurrence of BK viremia (≥ 104 copies/mL) or BK viruria (≥ 107 copies/mL), or diagnosed biopsy-proven BK virus nephropathy and cytomegalovirus (CMV) infection defined as a presence of significant CMV polymerase chain reaction or diagnosed CMV disease, which remain major obstacles in long-term renal allograft survival.15
Statistical analysis
Continuous variables were expressed as means ± standard deviation for normally distributed data and as a median with a range when the values were not normally distributed. The differences between the groups were tested through an independent sample t-test or χ2 test, as appropriate. To analyze the association between MPA C0, dose, and the clinical endpoints, an EC-MPS of 180 mg was converted to an MMF of 250 mg. The association between the mean value of MPA C0 and dose which were obtained prior to adverse events and clinical endpoints was analyzed. Correlations between the MPA dose and MPA C0 were analyzed with Pearson's correlation. To determine the effect of MPA C0 and dose on the clinical endpoints, multivariate logistic regression analysis was used by adjusting for clinical variables, such as age, gender, body mass index (BMI), TAC C0, the CV of TAC, baseline white blood cell (WBC) count, hemoglobin, platelets, estimated glomerular filtration rate (eGFR), and albumin. Statistical analysis was performed using the SAS system for Windows, version 9.2 (SAS Institute Inc., Cary, NC, USA). P values of < 0.05 were considered statistically significant.
Ethics statement
The study protocol was reviewed and approved by the Institutional Review Board of Kyungpook National University Hospital (No. 2018-10-023). All clinical investigations were conducted in accordance with the guidelines of the 2008 Declaration of Helsinki. The informed consent was waived because the study was conducted by retrospective review of medical records. All patient information were anonymized and they were de-identified before analyses.
Go to :
RESULTS
Baseline characteristics
Table 1 shows the baseline characteristics of the included KTRs. The mean age of the KTRs was 46.4 years, and 58.2% were men. Glomerulonephritis was the most common cause of primary kidney disease. Ten (12.7%) and five (6.3%) patients underwent ABO-incompatible and crossmatch-positive KT, respectively. A total of 97.5% of patients received interleukin-2 receptor blocker as an induction therapy. A total of 60.8% and 39.2% of patients used MMF and EC-MPS, respectively.
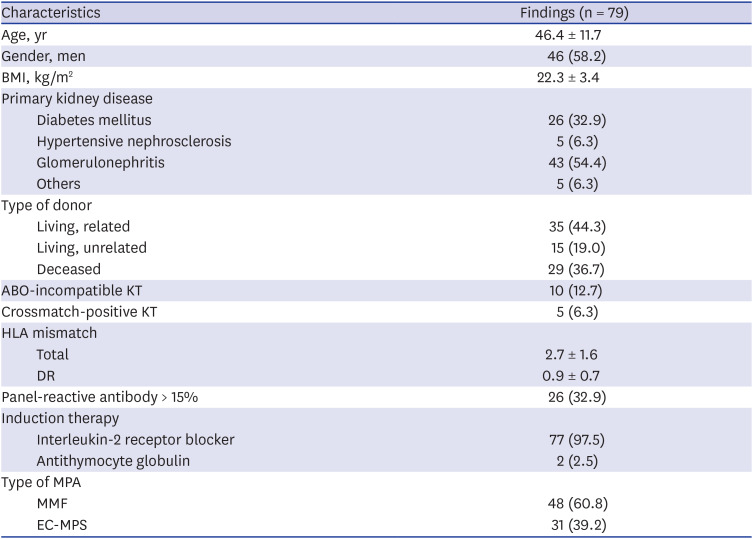
Table 1
Baseline characteristics of enrolled kidney transplant recipients
Values are shown as mean ± standard deviation or number (%).
BMI = body mass index, EC-MPS = enteric-coated mycophenolate sodium, HLA = human leukocyte antigen, KT = kidney transplantation, MMF = mycophenolate mofetil, MPA = mycophenolic acid.
![]()
Immunosuppressant dose and exposure
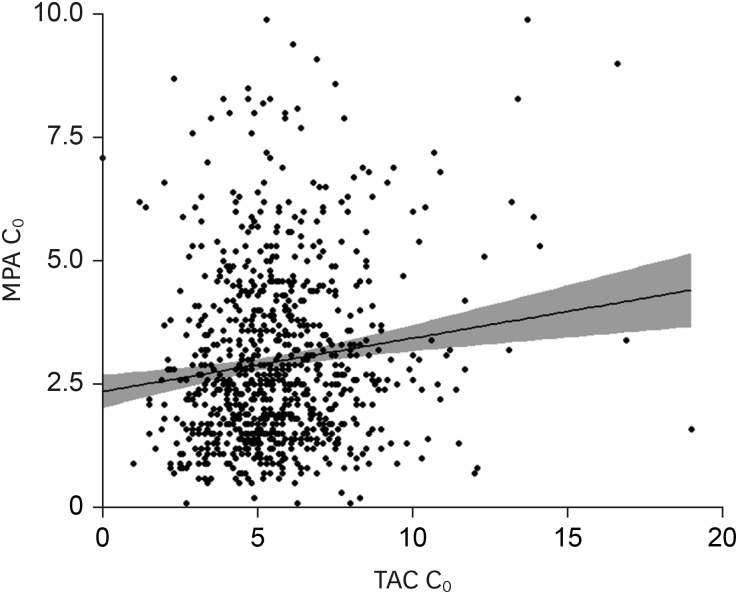
MPA C0 was significantly correlated with daily MMF dose (R2 = 0.083, P < 0.001) and daily EC-MPS dose (R2 = 0.020, P = 0.008) (Fig. 1). MPA C0 was correlated with TAC C0 (R2 = 0.017, P < 0.001) (Fig. 2).
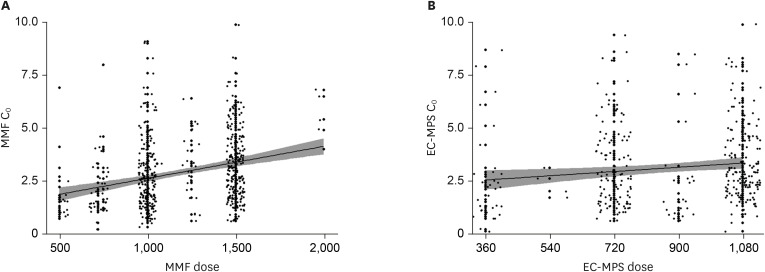 | Fig. 1Correlations between MPA C0 and MPA dose. MPA C0 was correlated with (A) daily MMF dose (R2 = 0.083, β = 0.002, P < 0.001) and (B) EC-daily MPS dose (R2 = 0.020, β = 0.001, P = 0.008).MPA = mycophenolic acid, C0 = trough concentration, MMF = mycophenolate mofetil, EC-MPS = enteric-coated mycophenolate sodium.
|
Immunosuppressive agent dosage and trough concentration level according to adverse events
No significant differences were observed in TAC C0 and CV between KTRs with and without adverse events (Table 2). MPA C0 was significantly higher in patients with leukopenia (3.4 ± 1.1 µg/mL vs. 2.8 ± 1.3 µg/mL, P = 0.021) and anemia (3.9 ± 0.9 µg/mL vs. 2.9 ± 1.2 µg/mL, P = 0.002) compared with patients without adverse events. The MPA dose was significantly higher in patients with thrombocytopenia (1,316.9 ± 244.7 mg/day vs. 1,118.5 ± 306.5 mg/day; P = 0.002) compared with those without thrombocytopenia (Table 2). However, no significant differences in MPA C0 and MPA dose were observed in patients with BPAR or viral infection compared with those without BPAR or viral infection.
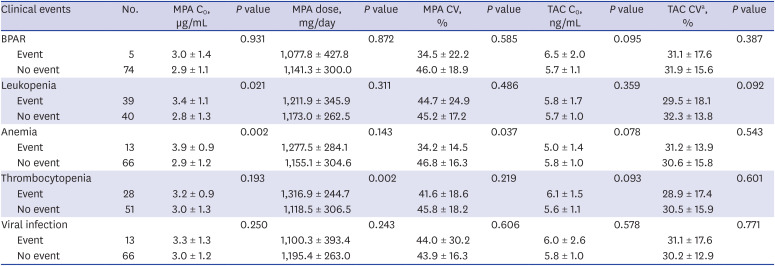
Table 2
Immunosuppressive agent dosage and trough concentration level according to adverse events
Values are shown as mean ± standard deviation.
BPAR = biopsy-proven acute rejection, C0 = trough concentration, CV = coefficient of variation, MPA = mycophenolic acid, TAC = tacrolimus.
aCV = standard deviation/mean × 100.
![]()
Table 3 demonstrates the number and time of adverse events according to MPA levels of < 3.5 vs. ≥ 3.5 µg/mL. Leukopenia (63.6% vs. 39.1%, P = 0.041) and anemia (33.3% vs. 6.1%, P = 0.003) occurred more frequently in patients with MPA levels of ≥ 3.5 µg/mL compared with those with MPA levels of < 3.5 µg/mL. BPAR, leukopenia, anemia, thrombocytopenia, and viral infection occurred on average 5.8, 5.8, 5.4, 5.0, and 6.0 months after KT, respectively.
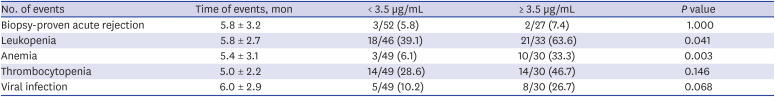
Table 3
Number and time of adverse events according to MPA levels of < 3.5 vs. ≥ 3.5 µg/mL
![]()
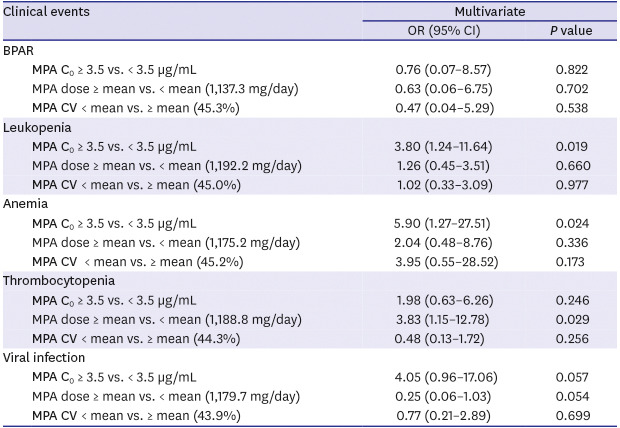
Multivariate logistic regression analysis revealed that MPA C0 ≥ 3.5 µg/mL was an independent risk factor for leukopenia (adjusted odds ratio [AOR], 3.80; 95% confidence interval [CI], 1.24–11.64; P = 0.019) and anemia (AOR, 5.90; 95% CI, 1.27–27.51; P = 0.024) (Table 4). An MPA dose greater than the mean value of 1,188.8 mg/day was an independent risk factor for thrombocytopenia (AOR, 3.83; 95% CI, 1.15–12.78; P = 0.029). However, MPA C0 < 3.5 µg/mL, MPA dose < 1,137.3 mg/day, and MPA CV ≥ 45.3% were not independently associated with BPAR.
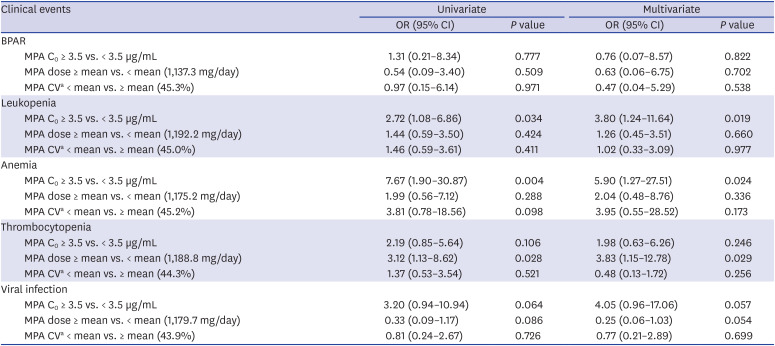
Table 4
Univariate and multivariate logistic regression analysis for clinical endpoints
Adjusted variables for multivariate analysis: BPAR: age, gender, BMI, number of total HLA mismatches, use of ATG, tacrolimus C0, tacrolimus CV, baseline eGFR, and albumin; leukopenia: age, gender, BMI, number of total HLA mismatches, use of ATG, baseline white blood cell count, eGFR, and albumin; anemia: age, gender, BMI, number of total HLA mismatches, use of ATG, baseline hemoglobin, eGFR, and albumin; thrombocytopenia: age, gender, BMI, number of total HLA mismatches, use of ATG, baseline platelets, eGFR, and albumin; viral infection: age, gender, use of ATG, tacrolimus C0, tacrolimus CV.
BMI = body mass index, BPAR = biopsy-proven acute rejection, C0 = trough concentration, CI = confidence interval, CV = coefficient of variation, eGFR = estimated glomerular filtration rate, MPA = mycophenolic acid, OR = odds ratio, ATG = antithymocyte globulin, HLA = human leukocyte antigen.
aCV = standard deviation/mean × 100.
![]()
Women with MPA C0 ≥ 3.5 µg/mL showed significantly higher risks of leukopenia (AOR, 7.21; 95% CI, 1.31–39.65; P = 0.023) and anemia (AOR, 8.00; 95% CI, 1.24–51.46; P = 0.028) compared with those with MPA C0 < 3.5 µg/mL. However, men did not have higher risks of leukopenia and anemia depending on MPA C0 (Table 5).
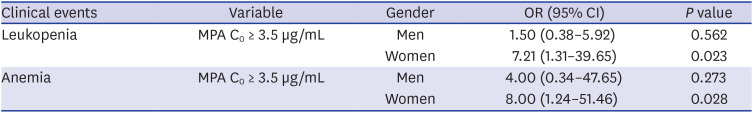
Table 5
Multivariate logistic regression analysis for gender interaction in the association between MPA C0 and leukopenia and anemia
Adjusted variables for multivariate analysis: leukopenia: BMI and baseline white blood cell count; anemia: BMI and baseline hemoglobin.
BMI = body mass index, C0 = trough concentration, CI = confidence interval, MPA = mycophenolic acid, OR = odds ratio.
![]()
Go to :
DISCUSSION
Our results demonstrate that either a higher MPA C0 or MPA dose is independently associated with an increased risk of leukopenia, anemia, and thrombocytopenia within the first year of transplantation. However, neither a lower MPA C0 nor doses were associated with BPAR under statistically comparable TAC concentrations in KTRs receiving induction therapy, TAC, and corticosteroids. Considering that a positive correlation between MPA dose and MPA C0 was observed, the individualized adjustment of the MPA dose based on MPA C0 might optimize transplant outcomes by achieving a safe fixed dose of MPA in individual KTRs.
Little is known regarding the optimal safe dose of MPA in KTRs with TAC-based immunosuppression therapy. A previous study has reported that TAC-treated KTRs receiving an initial MPA dose of < 2,000 mg/day did not have an increased risk of BPAR or renal allograft loss.16 However, considering that the mean dose of MPA in Korean KTRs is 1,000–1,500 mg/day,17 the lower safe threshold for MPA dose is required. A notable finding of this study is that an MPA dose of less than approximately 1,100 mg daily was not associated with the increased risk of BPAR in TAC and corticosteroid-treated KTRs within 1 year post-transplant. Furthermore, a MPA dose greater than approximately 1,100 mg daily or MPA C0 greater than 3.5 ng/L was associated with cytopenia. This result suggests that there might be no need to insist on a fixed MPA dose of 1,500 mg daily to prevent BPAR in KTRs receiving TAC and corticosteroids with normal BMI even during the initial period after KT.
There have been a few studies regarding MPA C0 and cytopenia, viral infection, and BPAR in KTRs.918 Contrary to the results of previous studies, MPA C0 was not associated with BPAR in our study. A possible explanation for this may be that the mean MPA C0 of KTRs without BPAR in the current study was 2.9 mg/L, which was considerably higher than the rejection-free MPA C0 cutoff level of 1.6–1.7 µg/L suggested by previous MPA C0-based studies.918 We found that the target TDM of MPA was achieved with a reduced dose of MPA and the incidence of BPAR was considerably low, even for KTRs given low-dose MPA. Although MPA C0 was significantly correlated with both daily MMF dose and EC-daily MPS dose, the correlation between MPA C0 and dose might be stronger in MMF than in EC-MPS. This subtle difference according to the type of MPA might be explained by the main differences in pharmacokinetics profile between MMF and EC-MPS. Because EC-MPS is absorbed more slowly than MMF, the time to peak concentration is more variable1920 and this might result in significant but weak correlation between EC-MPS dosage and MPA C0. In this study, MPA C0 was also correlated with TAC C0. This means that patients were prescribed similar levels of immunosuppressive strength regardless of the type of immunosuppressive agents.
Decreased kidney function and hypoalbuminemia are associated with increased MPA levels.92122 The result of this study has clinical significance in that MPA dose or MPA C0 was independently correlated with hematologic toxicity even after adjusting considerable variables, including renal function and albumin levels. In this study, only women had higher risks of leukopenia and anemia depending on MPA C0. Considering gender differences in pharmacokinetics and pharmacodynamics,23 differential therapeutic goals for MPA should be established according to gender to minimize adverse events. Even if hematologic side effects respond well and are completely reversible after dose reduction, considering the detrimental effect of anemia on poor patient and renal allograft outcomes,24 the regular monitoring of MPA exposure and preemptive adjustment of MPA could be crucial for clinicians to improve hard transplant outcomes.
This study has some limitations. First, the study design was retrospective and included a relatively small number of patients. Second, even though previous studies including African Americans and Caucasians have reported that no significant differences in MPA pharmacokinetics were observed according to ethnicity,2526 it is difficult to generalize these findings to other ethnicities as this is a study of an Asian population. Third, although there was a significant correlation between MPA C0 and dose, considering the high intra-individual variability of MPA C0,9 dosage adjustment to achieve the target MPA C0 might require caution.
Nevertheless, the current study has several strengths. First, we suggested an optimal and safe dose of MPA for Korean KTRs. Second, considering the significant correlation between MPA dose and MPA C0, the MPA C0-guided MPA dose individualization could optimize proper immunosuppression in KTRs. Third, because this study included relatively low- and moderate-risk KTRs and monitoring MPA C0 is much more practical than the AUC-based approach, which is cumbersome and time-consuming, the current study provided evidence of TDM MPA C0, which could be easily applied to the low- and moderate-risk KT population as well as high-risk patients in routine practice.
In conclusion, an MPA dose of less than approximately 1,100 mg daily or MPA C0 below approximately 3.5 µg/L reduces the risk of hematologic side effects in KTRs without causing BPAR within the first year of transplantation. In the early posttransplant period, MPA dose individualization using MPA C0 might be feasible and could have clinical significance for achieving a safe fixed dose of MPA in individual KTRs.
Go to :
 XML Download