

 PDF
PDF Citation
 Print
Print


INTRODUCTION
Chronic kidney disease (CKD) affected approximately 10% of the global population in 2017.1 The prevalence of CKD among Koreans older than 30 years of age was 4.3% for men and 3.9% for women according to the 2015 Korea National Health and Nutrition Examination Survey (KNHANES) VI-3.2 CKD can progress to end-stage renal disease (ESRD), which eventually requires hemodialysis or peritoneal dialysis replacement therapy.3 The risk of cardiovascular disease (CVD) and other health problems increases in ESRD.4 Proper and early treatment interventions for CKD patients are necessary to slow the progression to ESRD and to prevent complications, such as hypertension, malnutrition, electrolyte imbalance, and CVD.56
Management of CKD includes various components including dietary intervention and treatment of the underlying diseases, hypertension, and complications. Implementing dietary interventions for CKD patients is challenging but has significantly positive effects on clinical outcomes including the delaying of the progression to the ESRD when done properly.78 Many clinical trials and guidelines have addressed the associations between dietary factors and CKD.91011 The Kidney Disease Improving Global Outcomes (KDIGO) 2012 clinical practice guidelines for CKD patients recommended lowering dietary protein intake to 0.8 g/kg/day in adults with glomerular filtration rate (GFR) < 30 mL/min/1.73 m2, avoiding high protein intake (> 1.3 g/kg/day), and restricting dietary sodium intake to < 2 g per day.12 Studies which investigated the protein restriction in kidney disease have shown inconsistent results, but the evidence suggests benefits of moderate dietary protein restriction.1314 as this may slow the progression of CKD.15 Higher dietary salt intake was associated with an increased possibility of reduced kidney function according to the results from a systematic review of 16 studies.16 Dietary energy intake of 30–35 kcal/kg/day has been recommended for patients with G3-5 CKD (GFR < 45 mL/min/1.73 m2) to prevent malnutrition and protein energy malnutrition (PEM).1718
The dietary assessment of CKD patients prior to the implementation of any dietary intervention is needed to assess the patients' nutritional status and dietary habits, and to evaluate the efficacy of the intervention. In particular, dietary assessment and intervention starting from the non-dialysis stage are important for delaying progression to chronic kidney failure.5 However, while many studies have been conducted in dialysis patients,192021 relatively few studies have investigated dietary intake in non-dialysis CKD patients.22
The etiology of CKD varies, and diabetes mellitus (DM) is one of the most common causes of CKD.2324 The diabetic nephropathy develops in 20%–40% of DM patients.25 The worldwide prevalence of DM is rapidly increasing; therefore, the prevalence of CKD due to DM is likely to rise as well.423 The prevalence of DM among Koreans was 12.0% in men and 9.4% in women according to the 2015 KNHANES VI-3.2 In CKD patients, the proper restriction of protein intake appears to be an essential component for the preservation of kidney function.1315 However, diabetic CKD patients are more likely to focus on blood glucose control compared with non-diabetic CKD pateints.26 When protein intake is restricted, carbohydrates and/or fat become important nutrients for energy intake.17 There are competing needs for the control of carbohydrate and protein intake in diabetic CKD patients.27 Foods high in potassium and phosphorus content should be limited and restriction of protein intake is recommended in advanced stages of diabetic kidney disease, but not in patient with diabetes alone.26 Therefore, dietary assessment and intervention in diabetic CKD patients can be important to slow the progression of CKD. However, the assessment of dietary intake for Korean diabetic CKD patients has been rarely done.28
In this study, we investigated the dietary intake of Korean non-dialysis CKD patients according to DM and kidney function and assessed their dietary intake in comparison with International Society of Renal Nutrition and Metabolism (ISRNM) guideline for non-dialysis CKD patients. We aimed to establish baseline data for the development of dietary education and intervention strategies for CKD patients.
METHODS
Design and subjects
Subjects included were CKD patients who visited Seoul National University Hospital outpatient clinic from February 2016 to January 2017. Subjects on dialysis or those who had undergone a renal transplant were excluded. Three hundred fifty subjects (159 DM-CKD and 191 Non-DM-CKD subjects) between 17 and 92 years old were recruited in this study. Ninety-four subjects (52 DM-CKD and 42 Non-DM-CKD) who did not complete the three-day dietary records were excluded from the analysis. 256 subjects were included in the final analysis (107 DM-CKD and 149 Non-DM-CKD subjects). Subjects were divided based on two criteria: two groups based on DM (DM-CKD and Non-DM-CKD groups); and two groups based on the estimated glomerular filtration rate (eGFR) (Early-CKD and Late-CKD groups).
Demographic and biochemical characteristics
The general characteristics of subjects were examined by reviewing their electronic medical records. eGFR was calculated by CKD-EPI creatinine equation 2009. CKD based on GFR is classified according to the KDIGO 2012 clinical practice guideline for CKD patients: G1 (GFR ≥ 90), G2 (60 ≤ GFR < 90), G3a (45 ≤ GFR < 60), G3b (30 ≤ GFR < 45), G4 (15 ≤ GFR < 30), and G5 (GFR < 15). The Early-CKD group included the G1, G2, and G3a stages, and the Late-CKD group included the G3b, G4, and G5 stages. Height and weight were measured using an automatic height-weight measuring instrument (G-Tech International, Uijeongbu, Korea). Blood pressure was measured using fully automatic blood pressure monitors (A&D Company, Tokyo, Japan) after subjects had rested for more than 10 minutes. All subjects were asked to record their lifestyle-related factors, including smoking, drinking, and supplement use. Laboratory tests were performed on the day when subjects answered lifestyle-related factors.
Assessment of dietary intake
Subjects were asked to record all foods and liquids consumed and the amount, time, and place where the foods were consumed. Recipes and ingredients of the foods were asked to be written in detail. Nurses and dietitians provided an instruction booklet explaining how to complete the records and containing color photographs of specified portion sizes and common household measures. Completed dietary records were reviewed in a face-to-face or telephone interview by the dietitian to confirm the information. Energy, carbohydrate, fat (total fat, saturated fatty acid [SFA], monounsaturated fatty acid [MUFA], n-3 polyunsaturated fatty acid [PUFA], n-6 PUFA), protein (total protein, plant protein, animal protein), cholesterol, dietary fiber, calcium, phosphorus, sodium, and potassium intakes were analyzed using Can-Pro professional version 5.0 (Computer Aided Nutritional Analysis Program, The Korean Nutrition Society, 2015). The average of the three-day intake was used as the intake of each subject.
Statistical analysis
All statistical analyses were performed with SPSS software (version 23.0; SPSS Inc., Chicago, IL, USA) and a two-sided P < 0.05 was considered statistically significant. Values are presented as number (percentage) or mean ± standard deviation or mean ± standard error of the mean (SEM). The Kolmogorov–Smirnov test was used for the normality test. Log transformation or square root transformation was performed for variables that did not follow normality. To compare the demographic and biochemical characteristics of the subjects grouped according to DM and GFR category, the χ2 test was used for comparing proportions, and a two-way ANOVA test was used for means of normally distributed continuous data followed by fisher's least significant difference (LSD) post hoc test. A two-way analysis of covariance (ANCOVA) test adjusted for age, body mass index (BMI), and energy was used to compare mean daily energy and nutrient intakes of the subjects grouped according to DM and GFR category followed by LSD post hoc test.
RESULTS
Demographic and anthropometric characteristics
To examine whether there was a difference in the characteristics of the subjects initially enrolled in the study and the subjects who completed the three-day dietary records and were finally included in the analysis, general characteristics including age, gender, DM percentage, eGFR, and anthropometric parameters (height, weight, and BMI) were compared. Those characteristics did not differ between the two groups.
The demographic characteristics of the subjects grouped based on the gender are provided in Supplementary Table 1. The demographic characteristics of the subjects grouped according to DM and GFR category are shown in Table 1. Subjects in the DM-CKD group were older than those in the Non-DM-CKD group (P = 0.012), and Subjects in the Late-CKD group were older than those in the Early-CKD group (P = 0.018). There was no difference in smoking status among four groups. Alcohol consumption was different according to DM and GFR category (P = 0.018). Antihypertensive drug use tended to be different among four groups. (P = 0.050) (Table 1). The anthropometric parameters are shown in Table 1. Height was lower in the Late-CKD group than the Early-CKD group only for women (P = 0.021). Weight was higher in the DM-CKD group compared with the Non-DM-CKD group only for women (P = 0.008). BMI was higher in the DM-CKD group for both men (P = 0.020) and women (P = 0.004). BMI was lowest in the Non-DM-Late-CKD group. (Table 1).
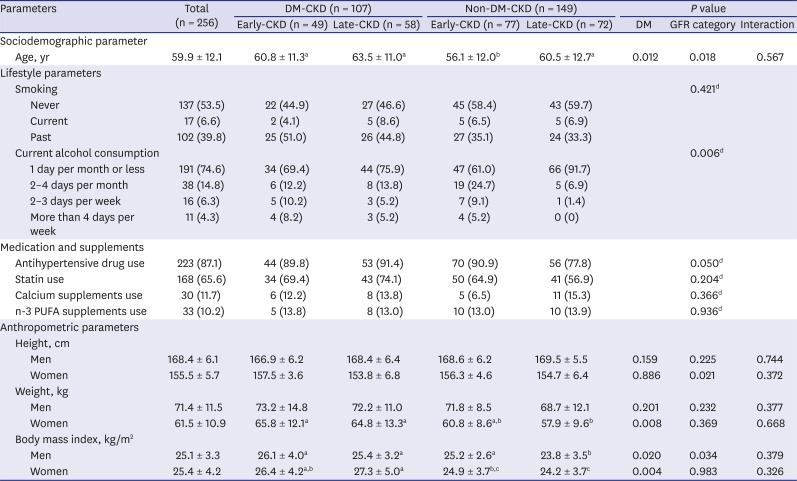
Table 1
Demographic and anthropometric characteristics of the subjects according to the DM and GFR category
The data are presented as number (%) or mean ± standard deviation. Two-way ANOVA was performed to compare the continuous parameters according to the DM and GFR category. Weight of men and body mass index were analyzed following Log transformation of the data.
DM = diabetes mellitus, GFR = glomerular filtration rate, CKD = chronic kidney disease, PUFA = polyunsaturated fatty acid, eGFR = estimated glomerular filtration rate.
a, b, cMeans with different letters indicate significant differences (P < 0.05) by Fisher's LSD multiple comparison test; dχ2 test was performed to compare the categorical parameters according to the DM and eGFR category.
![]()
Clinical and biochemical characteristics
The clinical and biochemical characteristics of the subjects grouped according to DM and GFR category are shown in Table 2. The DM-CKD group had higher systolic blood pressure (SBP) than the Non-DM-CKD group (P = 0.002). Hemoglobin level was lower in the Late-CKD group than the Early-CKD group independent of gender (P < 0.001), and it was below the normal range in the Late-CKD group. BUN (P < 0.001) and creatinine (P < 0.001) levels were higher in the Late-CKD group than the Early-CKD group, and they were above the normal range in the Late-CKD group. Uric acid level was highest in the DM-Late-CKD group, and those in the group were above the normal range (Table 2).
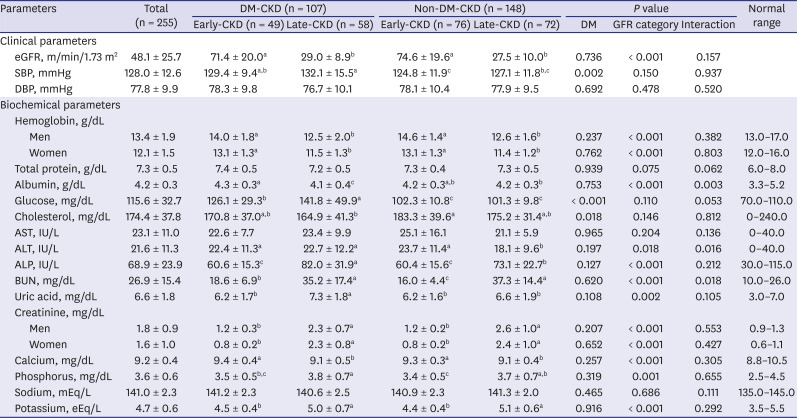
Table 2
Clinical and biochemical characteristics of the subjects according to the DM and GFR category
The data are presented as mean ± standard deviation. Two-way ANOVA was performed to compare the continuous parameters according to the DM and GFR category.
DM = diabetes mellitus, GFR = glomerular filtration rate, CKD = chronic kidney disease, eGFR = estimated glomerular filtration rate, SBP = systolic blood pressure, DBP = diastolic blood pressure, AST = aspartate aminotransferase, ALT = alanine aminotransferase, ALP = alkaline phosphatase, BUN = blood urea nitrogen.
a, b, cMeans with different letters indicate significant differences (P < 0.05) by Fisher's LSD multiple comparison test. Except for hemoglobin, cholesterol, and uric acid, other parameters were analyzed following Log transformation of the data.
![]()
Dietary intake
Energy and nutrients intakes
Average dietary intakes of the men and women subjects grouped according to DM and GFR category are shown in Tables 3 and 4. In men, energy intake was lower in the Late-CKD group compared with the Early-CKD group (P = 0.015). Energy intake normalized for actual body weight tended to be lower in the Late-CKD group (P = 0.076). Carbohydrate intake was higher in the Late-CKD group compared with the Early-CKD group (P = 0.019). Protein (P = 0.078) and total fat (P = 0.059) intakes tended to be lower in the Late-CKD group. Plant protein intake was higher in the DM-CKD group compared with the Non-DM-CKD group (P = 0.003), and it was highest in the DM-Early-CKD group, especially. Calcium intake was lower in the Late-CKD group compared with the Early-CKD group (P = 0.037). Sodium intake tended to be higher in the DM-CKD group compared with the Non-DM-CKD group (P = 0.061) (Table 3).
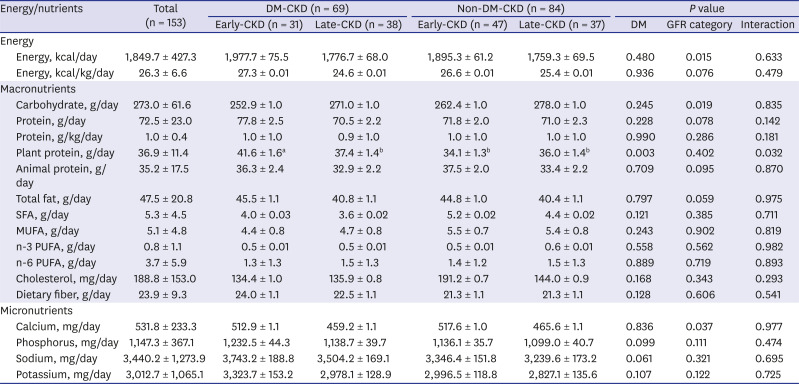
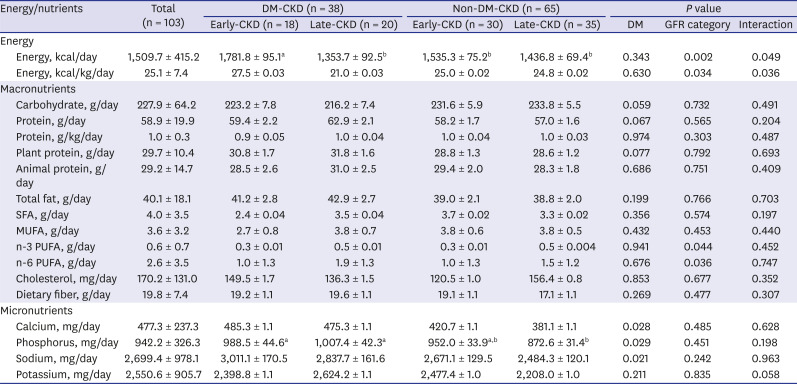
Table 3
Adjusted mean daily energy and nutrients intakes of the male subjects according to the DM and GFR category
The total values are presented as mean ± standard deviation, and other values are presented as mean ± standard error of the mean. Two-way analysis of covariance adjusted for age, body mass index, and energy was performed to compare the continuous parameters according to the DM and GFR category. Energy per kg, SFA, n-3 PUFA, and cholesterol parameters were analyzed following root transformation of the data. Carbohydrate, protein per kg, total fat, n-6 PUFA, dietary fiber, and calcium parameters were analyzed following Log transformation of the data.
DM = diabetes mellitus, GFR = glomerular filtration rate, CKD = chronic kidney disease, SFA = saturated fatty acid, MUFA = monounsaturated fatty acid, PUFA = polyunsaturated fatty acid.
a, bMeans with different letters indicate significant differences (P < 0.05) by Fisher's LSD multiple comparison test.
![]()
Table 4
Adjusted mean daily energy and nutrients intakes of the female subjects according to the DM and GFR category
The total values are presented as mean ± standard deviation, and other values are presented as mean ± standard error of the mean. Two-way analysis of covariance adjusted for age, body mass index, and energy was performed to compare the continuous parameters according to the DM and GFR category. Energy per kg, SFA, n-3 PUFA, and cholesterol parameters were analyzed following root transformation of the data. n-6 PUFA, dietary fiber, calcium, and potassium parameters were analyzed following Log transformation of the data.
DM = diabetes mellitus, GFR = glomerular filtration rate, CKD = chronic kidney disease, SFA = saturated fatty acid, MUFA = monounsaturated fatty acid, PUFA = polyunsaturated fatty acid.
a, bMeans with different letters indicate significant differences (P < 0.05) by Fisher's least significant difference multiple comparison test.
![]()
In women, energy intake (P = 0.002) and energy intake normalized for actual body weight (P = 0.034) were lower in the Late-CKD group compared with the Early-CKD group. Energy intake was highest in the DM-Early-CKD group. Carbohydrate intake tended to be lower in the DM-CKD group compared with the Non-DM-CKD group (P = 0.059). Protein (P = 0.067) and plant protein intakes (P = 0.077) tended to be higher in the DM-CKD group. The Late-CKD group showed higher n-3 PUFA (P = 0.044) and n-6 PUFA intakes (P = 0.036) than the Early-CKD group. The DM-CKD group showed higher calcium (P = 0.028), phosphorus (P = 0.029), and sodium intakes (P = 0.021) than the Non-DM-CKD group (Table 4).
Energy and nutrients intakes compared with recommended levels
Dietary intake of non-dialysis CKD patients were compared with the recommended minimum energy and nutrients levels of non-dialysis CKD patients (G3-5 CKD [GFR < 60 mL/min/1.73 m2]) from 2013 ISRNM guideline (Supplementary Table 2).29 Energy and nutrients intakes of the men and women subjects compared with recommended levels are shown in Table 5. For total energy intake, the percentage of subjects with energy intake below the recommended level (30–35 kcal/kg/day) was 80.4% for men subjects and 82.5% for women subjects. However, for total protein intake, the percentage of subjects consuming above the recommended level (0.6–0.8 g/kg/day) was 76.6% for men subjects and 66.7% for women subjects. For the phosphorus intake, the percentage of men and women subjects consuming above the recommended level (800–1,000 mg/day) was 63.6% and 34.9%, respectively. Those of women subjects below the recommended level were 44.4%. In sodium intake, the percentage of men and women subjects above the recommended level (1,840–2,000 mg/day) was 82.2% and 60.3%, respectively.
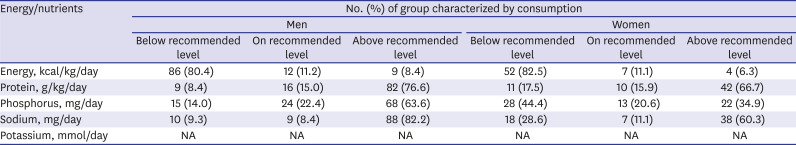
Table 5
Energy and nutrients intakes of non-dialysis chronic kidney disease patients (stages 3 to 5) compared with recommended level
![]()
DISCUSSION
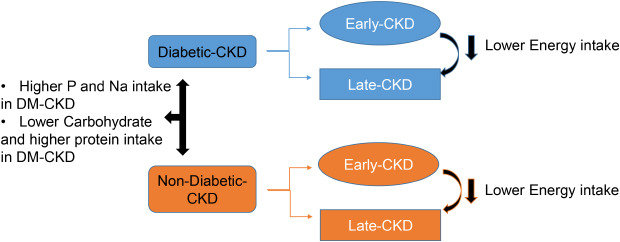
The objective of this study was to assess the dietary intakes of Korean non-dialysis CKD patients. We aimed to establish baseline data for the development of dietary education and intervention strategies for CKD patients. CKD patients were grouped according to DM and eGFR category to investigate the impact of comorbidity and severity of disease on dietary intakes. In this study, CKD patients' energy and nutrient intakes differed depending on their DM and kidney function. Subjects in the Late-CKD group consumed less energy than those in the Early-CKD group. Also, Non-DM-CKD subjects seemed to restrict protein intake starting from the Early-CKD stage than subjects with DM.
In this study, subjects in the Late-CKD group consumed less energy than those in the Early-CKD group, especially those in the DM-CKD group. This finding could be explained by the symptoms often associated with advanced CKD including anorexia, nausea, vomiting, changes in taste and smell, and restricted dietary regimens.3031 The Early-CKD group's energy intake was lower than the estimated energy requirements in Dietary Reference Intakes for Koreans (KDRIs), and the Late-CKD group's energy intake level was lower than the recommendation for non-dialysis advanced CKD patients (30–35 kcal/kg/day).18 This finding is consistent with those of two other studies in which low energy intake among non-dialysis CKD patients was reported.3233 Low energy intake is associated with the development of PEM, which can lead to increased morbidity and mortality in CKD patients.3435 The adequate energy intake is important for CKD patients of all stages to prevent catabolism of protein and to reduce the limited dietary protein being used as an energy source.36
In this study, subjects in the Late-CKD group consumed a lower amount of plant protein compared with those in the Early-CKD group only in the DM-CKD group. However, the level of protein intake (1.0 g/kg/day) in the Late-CKD group was still higher than the recommendation for non-dialysis advanced CKD patients (0.6–0.8 g/kg/day).18 Consistent with our results, previous two studies reported that non-dialysis CKD patients consume more protein than the recommended amount.2232 These findings and the results of our study show that the practice of dietary protein restriction is not being accomplished in non-dialysis CKD patients.
High protein intake along with low energy intake has been suggested as one of the factors worsening kidney function.31 Protein restriction can be beneficial for the prevention of complications such as metabolic acidosis and renal osteodystrophy in CKD patients,37 but long-term low protein intake may cause malnutrition or PEM.38 Therefore, education on proper protein-restricted diets should be provided to CKD patients. Sufficient energy intake, adverse effects of excessive protein intake, and appropriate protein-intake levels should be emphasized. More than half of G3–5 CKD men patients had phosphorus intake higher than the recommended level (800–1,000 mg/day), probably due to the consumption of foods rich in protein that are also sources of organic phosphorus.2139
In this study, n-6 PUFA intake was higher in the Late-CKD group compared with the Early-CKD group only in the Non-DM-CKD group. Fatty acids are an important source of energy. Incorporation of fat into the diet is one of the ways to increase dietary energy intake.40 Especially, a beneficial effect of PUFA on the disease status of hemodialysis patients has been observed. PUFA supplementation may improve nutrition status in CKD patients through the reduction of inflammation and catabolism.4142 However, fat intake is a concern in patients with DM as high intake of dietary fat can cause dyslipidemia and increase the risk of CVD.43 Therefore, level and type of fat should be carefully considered and practical and detailed recommendation regarding dietary fat intake should be provided to patients.
Subjects without DM seemed to practice more strict restriction of protein and plant protein intakes starting from the Early-CKD stage than those with DM. Because animal protein intake was not different between the DM-CKD group and the Non-DM-CKD group, difference in protein intake can be explained by the difference in plant protein intake. These findings suggest that it is necessary to provide education on the importance of controlling protein intake in DM patients starting from the Early-CKD stage.
Sodium intake was higher than the goal intake of 2015 KDRIs (2,000 mg/day) and the appropriate level for non-dialysis CKD patients (1,840–2,300 mg/day) in most of the subjects; therefore, continuous effort toward ensuring proper level of sodium intake is warranted. In the Chronic Renal Insufficiency Cohort (CRIC) study, high sodium intake was also observed and intake level was 2,870 mg in men CKD patients.44 The reduction of salt intake in CKD patients reduced blood pressure and proteinuria considerably. In addition, excessive salt intake is related to risk factors for CVD and progression to ESRD including fluid retention, high blood pressure, inflammation, oxidative stress, and endothelial dysfunction.4546
This study has several limitations. First, our study used a cross-sectional design, which does not prove a causal relationship between parameters. Second, the age and weight of subjects differed according to DM and kidney function. Therefore, we adjusted these parameters using ANCOVA to overcome this problem. Third, the physical activity information of subjects was not examined in this study. Despite these limitations, this study is the first to assess dietary intake according to DM and kidney function in Korean non-dialysis CKD patients in all GFR stages.
In conclusion, CKD patients' energy and nutrient intakes differed depending on their DM and kidney function. Subjects in the Late-CKD group consumed less energy than those in the Early-CKD group. Subjects without DM seemed to practice more strict restriction of protein and plant protein intakes starting from the Early-CKD stage than those with DM. Non-dialysis CKD patients showed low energy and high sodium intakes compared with recommended levels. In addition, most of the non-dialysis CKD patients consumed higher level of protein intake than the recommendation. Therefore, dietary intervention strategies for non-dialysis CKD patients need to be customized depending on the presence of DM and kidney function.
 XML Download