

 PDF
PDF Citation
 Print
Print


INTRODUCTION
Diabetic retinopathy (DR) is a chronic microvascular complication of diabetes mellitus (DM) and can sometimes present as the first manifestation of diabetic complications.12 Approximately 35% of patients with DM will develop DR, and of these, 20% will progress to proliferative diabetic retinopathy (PDR).3 DR is the most common cause of moderate and severe vision loss in working-aged adults.4 Vision loss owing to DR not only lowers patients' quality of life, it also limits the ability of patients to take care of their own disease, which can eventually lead to diabetes-related mortality.56
DR is a complex and multifactorial disease, characterized by variable clinical features and courses.7 Well-known risk factors associated with DR development are the duration of diabetes, glycated hemoglobin (HbA1C) level, systolic blood pressure, low body mass index (BMI), and total cholesterol.38910 In addition, genetic factors have recently been linked to risk of DR.11 Of the various known factors, the key risk factor for DR development is the duration of DM. The prevalence of DR is strongly associated with the duration of DM.3 A total 40%–60% of patients with duration of diabetes over 20 years have DR and 10% have a sight-threatening lesion.12
However, in patients with newly diagnosed type II DM (T2DM), the duration of DM is unknown. In fact, T2DM may have recently developed in these patients, or it may have gone undetected for a long time. In cases that the duration of diabetes cannot be determined, knowing the characteristics of the systemic factors associated with the clinical manifestation of DR in newly diagnosed DM might provide meaningful clinical information to ophthalmologists and diabetologists. Therefore, in this study, we aimed to investigate the clinical features of DR in patients with newly diagnosed DM and determine which baseline systemic factors are associated with the presence of DR at the time of T2DM diagnosis.
Go to : 
METHODS
We retrospectively reviewed the medical records of patients newly diagnosed with T2DM at Chungbuk National University Hospital, Cheongju, Korea between January 2013 and January 2018.
The primary objective of this study was to determine the frequency of patients with a new diagnosis of T2DM who had DR. The secondary objectives were to analyze 1) which systemic factors were related to the presence of DR at the time of T2DM diagnosis, 2) the relationship between the severity of DR and systemic factors; and 3) the baseline risk factors associated with progression of DR after T2DM diagnosis.
The inclusion criteria were patients 1) newly diagnosed with T2DM and 2) who visited the ophthalmology clinic within 1 month after T2DM diagnosis. The exclusion criteria were 1) DM owing to secondary causes, such as pancreas removal, 2) history of vitrectomy or scleral buckle, 3) other retinal vascular diseases that could affect the grade of DR, 4) patients with uncontrolled hypertension, 5) history of anti-vascular endothelial growth factor (VEGF) treatment for other retinal diseases, 6) history of uveitis or chorioretinal infection, and 7) fundus image of poor quality owing to a vitreous hemorrhage or cataract.
Ophthalmic examinations
At the initial visit, all patients underwent a complete bilateral ophthalmic examination, including best corrected visual acuity (BCVA) using the Snellen chart, applanation tonometry, slit lamp examination, dilated fundus examination, color fundus photography, and spectral domain-optical coherence tomography (SD-OCT). BCVA results were converted to the logMAR scale. During a follow-up visit, ophthalmic examinations were conducted that included BCVA measurement, applanation tonometry, slit lamp examination, dilated fundus examinations, fundus photography, and SD-OCT.
DR grading
The severity of DR was stratified into levels ranging from no DR to high-risk PDR on the basis of the Early Treatment Diabetic Retinopathy Study (ETDRS) classification using 7 stereoscopic pairs of photographs per eye (ETDRS 7 standard fields).1314 The DR severity scale used was as follows: no DR (level 10–12); mild non-proliferative diabetic retinopathy (NPDR, level 35); moderate NPDR (level 43); severe NPDR (level 47–53); very severe NPDR (level 53E); PDR (level 60–65); and high-risk PDR (level 71–75). In the cases with different stage of DR in both eyes, the level of retinopathy was graded based on the worse eye.
We also classified patients with T2DM according to the presence of DR at the time of T2DM diagnosis. At the initial visit, patients with DR were classified into the DR group and those with no DR were classified into the no diabetic retinopathy (NDR) group. If DR severity worsened more than two levels or worsened from no PDR to PDR during follow-up, it was defined as DR progression.15
Physical and laboratory examinations
All examinations were performed within 1 month after the first diagnosis of T2DM. Physical examination data were collected, including blood pressure, height, and weight. BMI was calculated as weight in kilograms divided by height in meters squared (kg/m2). A venous blood sample was drawn from an antecubital vein in the morning after more than 8 hours of fasting to determine total cholesterol, triglyceride, fasting plasma glucose (FPG) levels, and HbA1C concentrations. Urine tests were also performed, and the urine albumin to creatinine ratio (UACR) and urine microalbumin level were used in the analysis. All measurements were performed at the department of diagnostic testing of Chungbuk National University Hospital, using commercially available assays.
Statistical analysis
IBM SPSS version 22.0 software (IBM Corp., Armonk, NY, USA) was used to perform the statistical analysis, and P < 0.05 was set to indicate statistical significance. An independent t-test was used for the comparison of continuous variables between the two groups, and the Pearson χ2 test was used for comparing categorical variables between the two groups. Multivariate logistic regression analysis was performed to determine the relationship between the presence of DR and systemic factors. We used Spearman correlation analysis to examine the relationship between severity of DR and systemic factors. We conducted Cox regression analysis to determine the risk factors associated with progression of DR.
Ethics statement
This study was approved by the Institutional Review Board (IRB) of Chungbuk National University Hospital (approval No. 2018-05-001) and was conducted in accordance with the tenets of the Declaration of Helsinki. This retrospective medical record reviewing research involved no more than minimal risk to the subjects. Therefore, the IRB gave exemption of the requirement for obtaining informed consent.
Go to :
RESULTS
A total 380 patients were included in this study. Among 380 patients, 10.53% (40 patients) were diagnosed with DR within 1 month after a new diagnosis of T2DM. In the DR group, HbA1C (10.17% ± 1.82% vs. 7.34% ± 1.37%, P < 0.001), FPG (219.15 ± 81.81 mg/dL vs. 146.33 ± 50.74 mg/dL, P < 0.001), UACR (94.12 ± 176.05 mg/g vs. 34.70 ± 90.37 mg/g, P = 0.001), and urine microalbumin level (107.54 ± 186.23 μg/mL vs. 43.81 ± 112.82 μg/mL, P = 0.002) were significantly higher than in the NDR group. However, there were no significant differences in age, gender, body weight, BMI, blood pressure, history of coronary artery disease, history of stroke, alcohol use, smoking, estimated glomerular filtration rate (eGFR), serum creatinine, and lipid profile according to the presence of DR at the time of T2DM diagnosis (Table 1).
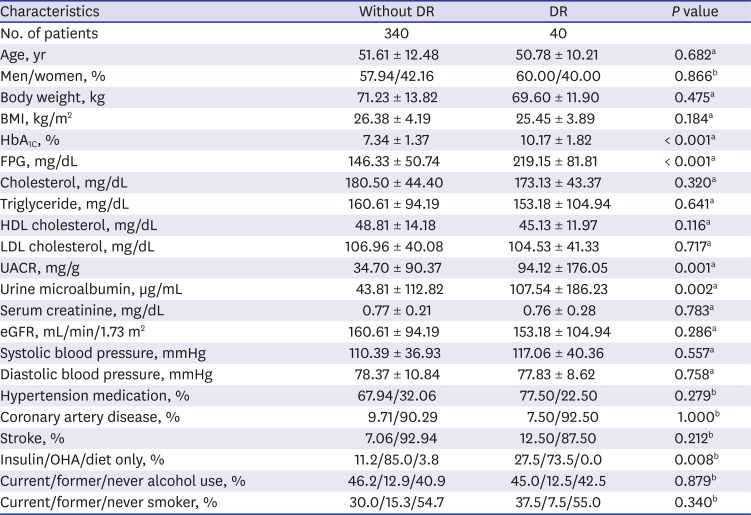
Table 1
Comparison of characteristics according to DR status at first visit
DR = diabetic retinopathy, BMI = body mass index, eGFR = estimated glomerular filtration rate, HDL = high-density lipoprotein, LDL = low-density lipoprotein, OHA = oral hypoglycemic agent, HbA1C = glycated hemoglobin, FPG = fasting plasma glucose, UACR = urine albumin to creatinine ratio.
aIndependent t-test; bPearson χ2 test.
![]()
Systemic factors related to the presence of DR at the time of type 2 diabetes diagnosis
To determine which systemic factors were related to the presence of DR at the time of T2DM diagnosis, we performed multivariate logistic analysis. We found that high HbA1C level was the only systemic factor related to the presence of DR at the time of T2DM diagnosis (odds ratio [OR], 2.372; 95% confidence interval [CI], 1.891–2.976; P < 0.001).
Systemic factors related to the severity of DR at the time of type 2 diabetes diagnosis
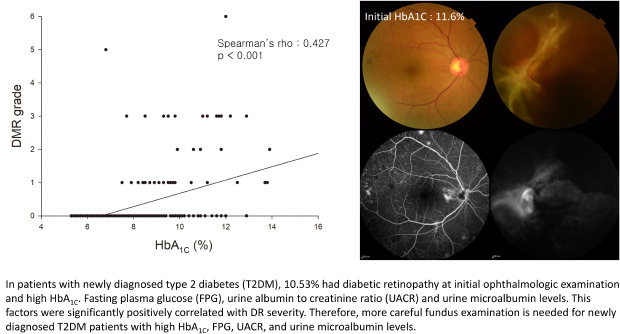
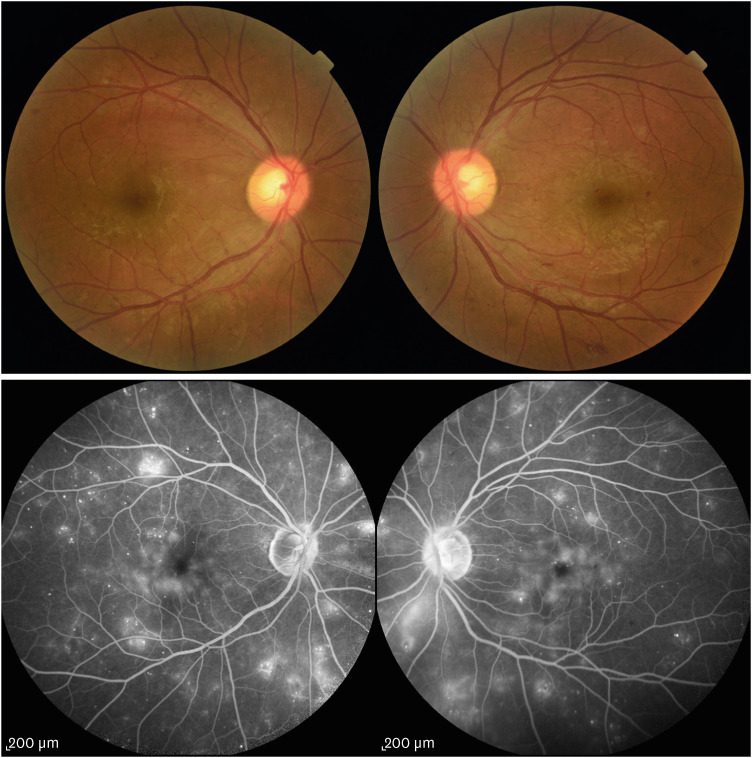
Regarding the association between severity of DR and systemic factors in patients with DR at the time of T2DM diagnosis, Spearman correlation revealed that HbA1C, FPG, UCAR, and urine microalbumin level were positively correlated with DR severity at the time of T2DM diagnosis (Fig. 1). Figs. 2-4 show representative cases for the positive correlation of DR grade and systemic factors. Fig. 2 shows the case of a 55-year-old woman with high HbA1C levels at the first diagnosis of T2DM. HbA1C was 11.6%, UACR was 117.30 mg/g, and urine microalbumin was 113.40 μg/mL at T2DM diagnosis. Fundus examination and fluorescein angiography revealed multiple new vessels in both eyes and tractional retinal detachment in the left eye. For the right eye, panretinal photocoagulation was conducted and vitrectomy was done for the left eye. Fig. 3 shows the case of a 49-year-old woman with moderate HbA1C levels at the first diagnosis of T2DM; HbA1C was 8.50%, UACR was 58.70 mg/g, and urine microalbumin was 19.00 μg/mL. In the fundus examination, both eyes were classified as very severe NPDR. Both eyes were treated with panretinal photocoagulation, and the patient underwent regular follow-up. Fig. 4 shows the case of a 48-year-old woman with low HbA1C levels at the first diagnosis of T2DM; HbA1C was 7.10%, UACR was 6.10 mg/g, and urine microalbumin was 7.50 μg/mL. In the examination, both eyes were classified as no DR.
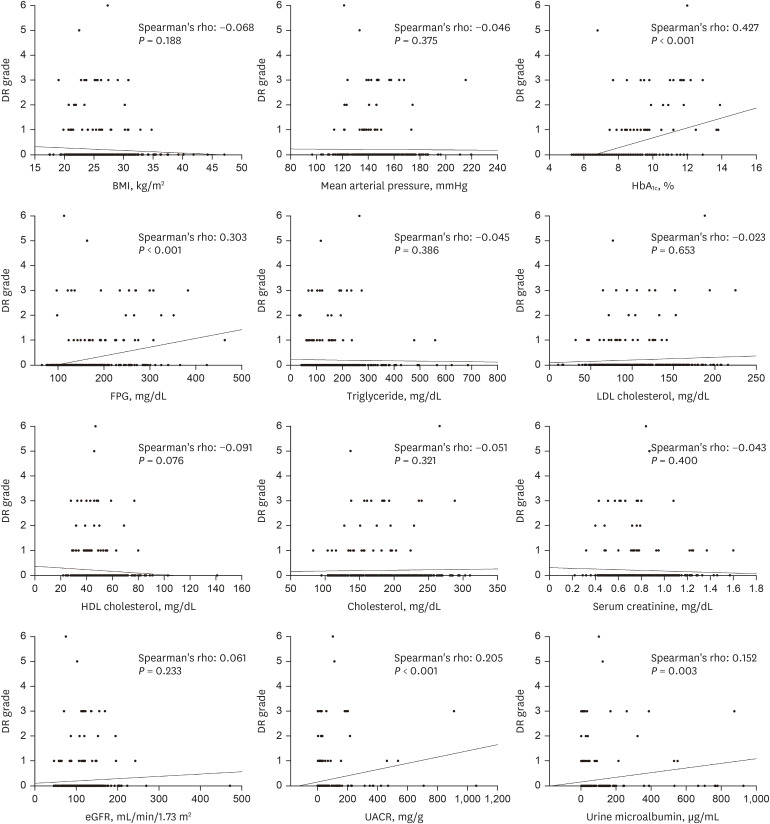 | Fig. 1The correlation between the DR grade and laboratory exams. There was a significant positive correlation between the DR grade and HbA1C, FPG, UACR and urine microalbumin level. Of the relevant factors, Spearman's rho was the largest in HbA1C.DR = diabetic retinopathy, HbA1C = glycated hemoglobin, FPG = fasting plasma glucose, UACR = urine albumin to creatinine ratio, eGFR = estimated glomerular filtration rate, HDL = high-density lipoprotein, LDL = low-density lipoprotein, BMI = body mass index.
|
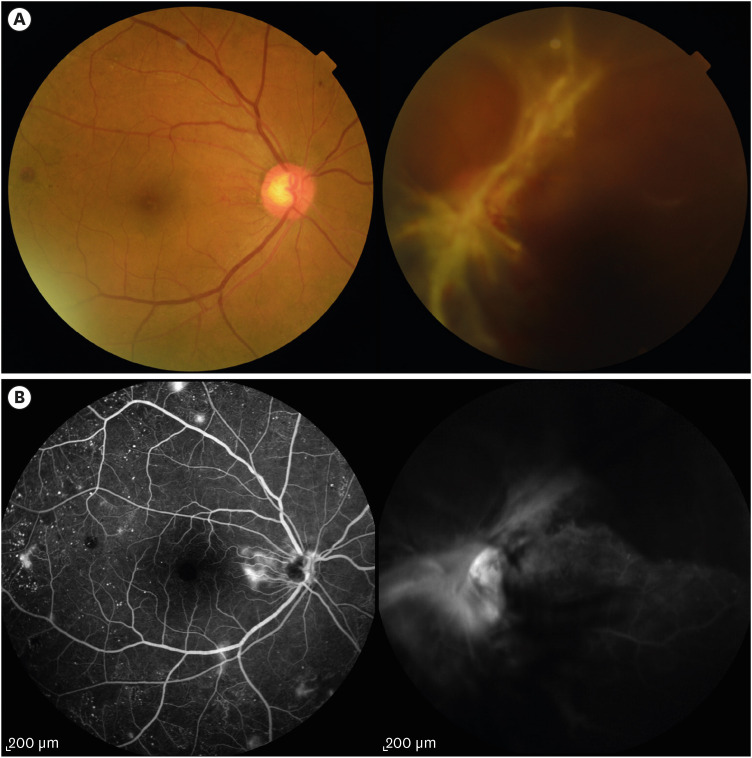 | Fig. 2A case of a patient with high level of HbA1C at the first diagnosis of T2DM. Fifty-five-year-old woman with high level of HbA1C at the first diagnosis of T2DM. HbA1C was 11.6%, UACR was 117.30 mg/g Cr and urine microalbumin was 113.40 μg/mL at the first diagnosis of T2DM. Fundus examination (A) and fluorescein angiography (B) revealed multiple new vessels on both eyes and tractional retinal detachment in the left eye.HbA1C = glycated hemoglobin, T2DM = type II diabetes mellitus, UACR = urine albumin to creatinine ratio.
|
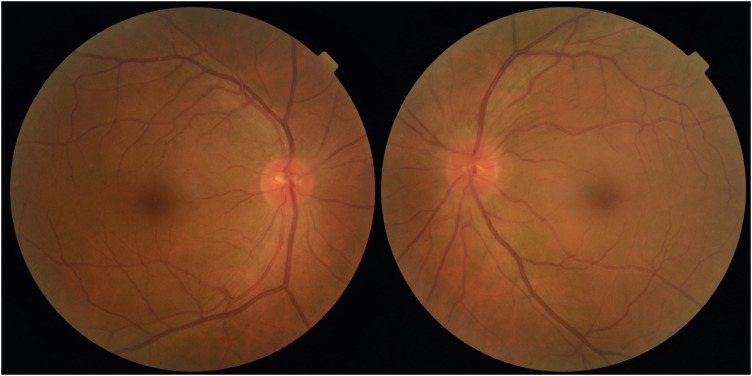 | Fig. 4A case of a patient with low of HbA1C at the first diagnosis of T2DM. Forty-eight-year-old woman with low level of HbA1C at the first diagnosis of T2DM. HbA1C was 7.10%, UACR was 6.10 mg/g and urine microalbumin was 7.50 μg/mL at the first diagnosis of T2DM. In the DR exam, both eyes were classified as NDR.HbA1C = glycated hemoglobin, T2DM = type II diabetes mellitus, UACR = urine albumin to creatinine ratio, DR = diabetic retinopathy, NDR = no diabetic retinopathy.
|
 | Fig. 3A case of a patient with moderate level of HbA1C at the first diagnosis of T2DM. Forty-nine-year-old woman with moderate level of HbA1C at the first diagnosis of T2DM. HbA1C was 8.50%, UACR was 58.70 mg/g and urine microalbumin was 19.00 μg/mL at the first diagnosis of T2DM. In the DR exam, both eyes were classified as severe NPDR.HbA1C = glycated hemoglobin, T2DM = type II diabetes mellitus, UACR = urine albumin to creatinine ratio, DR = diabetic retinopathy, NPDR = non-proliferative diabetic retinopathy.
|
The average follow-up period for all patients was 23.49 ± 8.28 months. Regarding risk factors for progression of DR more than two grades during follow-up, Cox regression analysis revealed that there were no statistically significant factors associated with progression of DR of more than two levels (Table 2).
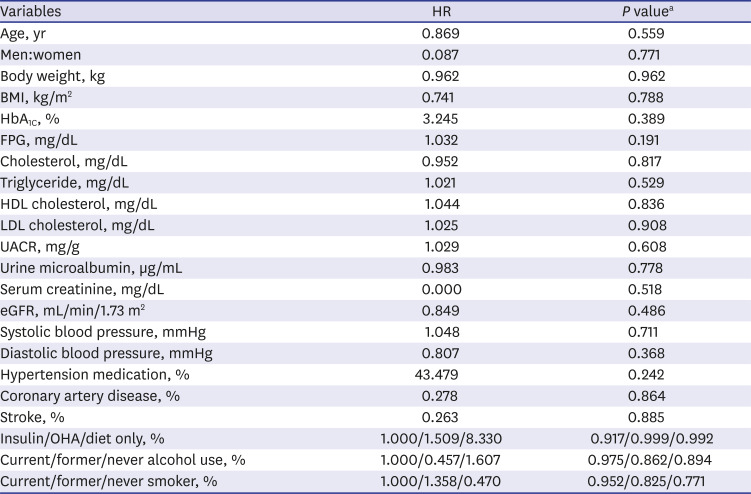
Table 2
Univariate Cox proportional hazards models for predicting the progression of DR
DR = diabetic retinopathy, HR = hazard ratio, HDL = high-density lipoprotein, LDL = low-density lipoprotein, eGFR = estimated glomerular filtration rate, OHA = oral hypoglycemic agent, HbA1C = glycated hemoglobin, FPG = fasting plasma glucose, UACR = urine albumin to creatinine ratio, BMI = body mass index.
aUnivariate Cox proportional hazards models.
![]()
Go to :
DISCUSSION
In this study, we investigated the characteristics of DR in patients with newly diagnosed T2DM. A total 10.53% of patients newly diagnosed with T2DM had DR at the time of T2DM diagnosis. This ratio was similar to the 16.5% found by Roy Chowdhury et al.16 using digital photograph analysis. Unlike that study, we investigated the clinical features of DR in patients with newly diagnosed DM and those systemic factors associated with the presence of DR at the time of T2DM diagnosis. Our results showed that HbA1C, FPG, UACR, and urine microalbumin level were significantly higher in patients with DR than in those without DR. HbA1C, FPG, UACR, and urine microalbumin level were positively correlated with the severity of DR in patients with newly diagnosed T2DR.
The known major risk factors for DR are duration of DM, hyperglycemia, and hypertension.3 Among these factors, duration of T2DM is considered to be the key risk factor for DR development.38910 With diabetes duration more than 20 years, 40%–60% of patients have DR.12 However, in patients with newly diagnosed T2DM, the duration of DM cannot be determined. In some newly diagnosed T2DM patients, T2DM was recently developed. On the other hand, some T2DM patients might have not been aware of T2DM for a long time. In cases that the duration of diabetes cannot be determined, it will be meaningful to demonstrate the DR features and its related systemic risk factors in newly diagnosed DM. Therefore, in the current study, we investigated the characteristics of DR and systemic factors related to the presence of DR at the time of T2DM diagnosis.
We found that high HbA1C level was the only systemic factor related to the presence of DR at the time of T2DM diagnosis (OR, 2.372; 95% CI, 1.891–2.976; P < 0.001). We also found a significant positive correlation between HbA1C level and DR severity. In previous studies, HbA1C has been considered an independent risk factor for DR.9 And mean HbA1c is the strongest risk factor for the progression of retinopathy.17 In addition, low HbA1C reduces the risk for DR development. In particular, according to the United Kingdom Prospective Diabetes Study, the risk of microvascular complications including DR is reduced by 37% with a decrease of 1% in HbA1C.18 In the current study, even in patients with newly diagnosed T2DM, HbA1c could be used as a predictor of the presence and severity of DR at the time of T2DM diagnosis. Therefore, patients newly diagnosed with T2DM who have high HbA1C levels require more careful fundus examination.
In this study, urine microalbumin levels and UACR were significantly correlated with the severity of DR. Several studies have shown that microalbuminuria is associated with DR.1920 In addition, UACR has a better association with DR than eGFR and could be an important risk factor for DR.21 Vascular endothelial dysfunction of small vessels, secondary to prolonged exposure to a hyperglycemic condition, contributes to both the development and progression of DR and diabetic nephropathy.22 A possible explanation why high UACR and urine microalbumin levels could serve to predict the presence and severity of DR at the time of T2DM diagnosis is as follows. Experimental diabetic rat models have shown increased expression of VEGF secondary to glomerular injury.23 VEGF expression owing to glomerular injury may be further released into the systemic circulation, and elevated serum VEGF levels have an inverse relationship with the degree of kidney function.24 The degree of decrease in renal function and DR are interrelated, and recent studies have shown that DR and diabetic nephropathy have a common pathway of disease; high levels of microalbumin or UACR are also highly correlated with advanced DR.252627 Considering that urine microalbumin level and UACR serve as representative markers for glomerular injury, and the amount of glomerular injury is related to DR, microalbuminuria and high UACR could be used to predict the presence and severity of DR at the time of T2DM diagnosis.
There have been controversies surrounding the relationship between hyperlipidemia and risk of DR.28 The triglyceride-lowering agent fenofibrate is thought to be effective in slowing DR progression in patients with mild NPDR29; however, other studies have reported no relationship between hyperlipidemia and risk of DR.30 In this study, we analyzed serum level of cholesterol, triglyceride, high-density lipoprotein cholesterol and low-density lipoprotein cholesterol. However, these factors did not appear to be associated with the presence or progression of DR. We think the conceivable reason for our result is because we could only analyze the lipid profile from serum, not at the intraretinal level. In the previous report, lipid profile in serum might not accurately reflect intraretinal lipid transport which could affect the pathogenesis of DR.31 Therefore, the serum lipid profile which was analyzed in our study might not reflect the development/progression of DR.
We analyzed the systemic risk factors associated with progression of DR. Known strong predictors for DR progression are duration of DM and HbA1C level.11 Previous large, randomized clinical trials have established the benefit of glycemic control on reducing the progression of DR.3233 In addition, other factors affecting DR progression are a young age at DM diagnosis, man gender, hypertension, anemia, insulin use, and smoking.3435 In addition, abnormal renal profiles including a high serum creatinine level, low eGFR, and high UACR are associated with the development of PDR and diabetic macular edema in patients with T2DM.2236 Unlike previous studies, we sought factors related to DR progression using systemic findings at the time of T2DM diagnosis; however, we found no significant baseline risk factors for DR progression. We believe that this is due to the small number of patients with DR included in this study. Therefore, to clarify which baseline systemic factors are associated with DR progression in patients with newly diagnosis T2DM, further studies with a larger number of patients might be needed.
The strength of our study is that we investigated the frequency and characteristics of DR in patients with newly diagnosed T2DM and its association with systemic factors for the first time. We also presented a method for predicting which patients might have DR at the time of T2DM diagnosis using systemic factors. However, this study also had some limitations inherent to its retrospective design. Moreover, the number of patients with DR among all included patients was relatively small. In addition, this was a single center study. Therefore, further large-scale prospective multicenter studies among patients with newly diagnosed T2DM will be needed.
In summary, among our patients with newly diagnosed T2DM, 10.53% had DR at the initial ophthalmologic examination. These patients showed high HbA1C, FPG, UACR and urine microalbumin levels. There was also a significant positive correlation with the severity of DR. Therefore, when a diabetologist refers a patient with newly diagnosed T2DM to an ophthalmologist, the ophthalmologist should check the systemic condition of the patient. Patients with high HbA1C, FPG, UACR, and urine microalbumin levels require more careful fundus examination and additional studies, such as fluorescein angiography. Diabetologists also should be aware of the presence of DR in about 10% of patients who are initially diagnosed with T2DM, and those with high systemic risk factors in particular should be encouraged to actively undergo eye examinations.
Go to :
 XML Download