

 PDF
PDF Citation
 Print
Print


INTRODUCTION
Kidney transplantation is an effective treatment for end-stage renal disease. Patient and graft survival among kidney recipients has greatly improved with the development of potent immunosuppressants.1 Because of the prolonged survival time, many long-term complications such as cardiovascular disease, glucose intolerance, and post-transplant cancer (PTC) are emerging as new and important issues in kidney recipients.2345
The incidence of solid organ cancer in kidney recipients is reportedly > 10% within 10 years after transplantation and > 25% after 20 years, and it is two to four times higher than that in the age- and gender-matched general population.6789 This high risk is dependent on the type of tissue that is affected, but it is highest for Kaposi sarcoma and skin cancer.1011 Among non-skin cancers, viral infection-related cancers such as post-transplant lymphoproliferative disease have a high incidence among kidney recipients.111213 The mechanisms of PTC include oncogenic viruses, strong immunosuppression, and altered T cell immunity.141516 A previous study demonstrated that the use of T cell-depleting antibody as a treatment for rejection increases the risk of genitourinary PTC.16
The risk factors associated with the development of PTC and cancer-related mortality in kidney recipients have been thoroughly evaluated.78 PTC reportedly increased the mortality of transplant recipients, but the severity of cancer and its treatment status were not described.78 Because both advanced and localized cancers were considered in previous studies, little is known about graft function or patient survival after complete removal of cancer in transplant recipients. Patients with advanced cancer requiring long-term chemotherapy and frequent imaging studies with contrast media might be at risk of deteriorating graft function; thus, determination of the effect of the cancer itself on the graft outcome is difficult. Examination of the events of cured and non-recurrent PTCs may resolve the above issue, but no studies to date have focused on this issue. The present study addressed whether graft survival is maintained or deteriorates in patients with cured PTCs and whether cancer type or a change in immunosuppressive agents after the diagnosis of PTC affects transplant outcomes.
METHODS
Patient and data collection
In total, 2,036 patients who underwent kidney transplantation in Seoul National University Hospital from 1995 to 2017 were reviewed. We excluded patients < 18 years of age (n = 299), patients received multiple organ transplants (n = 67), patients with post-transplant hematologic malignancy (n = 12), and patients who had allograft nephrectomy for treatment of cancer in the graft or its ureter (n = 2). The cured PTCs were defined when cancers were treated with curative methods and/or adjuvant therapy and there had been no recurrence for ≥ 2 years. The other PTC patients who cannot meet this criteria were excluded (n = 27). Consequently, 1,629 recipients were analyzed in the present study.
The following baseline characteristics were collected: age, gender, body mass index, diabetes mellitus, type and duration of pre-transplant dialysis, history of pre-transplant cancer, and cause of end-stage renal disease. Transplant-related information such as donor type (deceased or living), ABO incompatibility, the mismatch number of human leukocyte antigens (HLAs), and the prescription information for induction and maintenance immunosuppressants were identified. The type of PTC and its treatment were reviewed. The primary sites and stages of PTCs and their treatment regimens were reviewed. Most of the cancer stages were classified according to American Joint Committee on Cancer (AJCC) Cancer Staging Manual (8th edition) except Kaposi sarcoma and cervical cancer.17
Transplant outcome
The primary outcome was graft and patient survival. Death-censored graft failure was defined when death with a functioning graft was considered a censored case. All-cause mortality data were obtained from the National Database of Statistics Korea. The secondary outcome was the development of immunological events such as acute rejection and de novo donor-specific antibodies (DSAs). Protocol biopsy was performed at 10 days and 1 year after transplantation. Additionally, if rejection was suspected based on clinical features such as decreased graft function, a biopsy was performed. The pathologic diagnosis of acute rejection was confirmed by a pathologist according to the Banff criteria.18 DSA was detected by the Luminex single-antigen bead assay, which was performed every 2 years and when rejection was suspected.
Statistical analysis
All statistical analyses were performed using Stata version 15.1 (StataCorp, College Station, TX, USA) and SPSS version 25.0 (IBM Corp., Armonk, NY, USA). Continuous variables are expressed as mean ± standard deviation if normally distributed and as median with interquartile range if not normally distributed. Categorical variables are expressed as proportions. The χ2 test was used for comparison of categorical variables (Fisher's exact test if not applicable), and Student's t-test was used for continuous variables. The Mann-Whitney test was used if variables were not normally distributed. Propensity score matching was performed to account for the imbalance in baseline characteristics between groups. Scores were created with matching variables including age, gender, donor type, and transplant era. The cases were then matched based on the propensity score in a 1:2 block with a nearest-neighbor matching algorithm with replacement using the statistical package psmatch2. Matched controls received weight according to their replacement status. Kaplan-Meier curves were drawn to compare the risks between groups, and significance was calculated using the log-rank test. To prevent immortal time bias, PTC was treated as a time-dependent variable in the Cox regression model of graft and patient survival by the Stata code (i.e., stsplit). Hazard ratios (HRs) were calculated using the Cox regression model with and without adjustment for multiple covariates. A P value of < 0.05 was considered statistically significant.
RESULTS
Baseline characteristics before and after propensity score matching
Among the 1,629 patients, 70 (4.3%) had cured PTCs. The median interval from transplantation to diagnosis of PTC was 6 years (2–12 years). According to the primary site, the urinary tract was the most common site of cured cancer (n = 20, 28.5%) followed by the thyroid (n = 14, 20.0%), gastrointestinal tract (n = 13, 18.6%), and skin (n = 8, 11.4%). The other cancer types were breast cancer (n = 5), gallbladder cancer (n = 2), prostate cancer (n = 2), Kaposi sarcoma (n = 2), cervical cancer (n = 1), intra-abdominal fibrosarcoma (n = 1), leiomyosarcoma of the face (n = 1), and lung adenocarcinoma (n = 1). Among these cured PTCs, 69 patients underwent curative surgery and 1 patient performed curative radiotherapy. Adjuvant treatment was performed in 3 thyroid cancer patients with radioactive iodine therapy, 2 breast cancer patients with adjuvant radiotherapy after breast conserving surgery and 1 breast cancer patient with adjuvant anastrozole treatment for 5 years. None of the 70 patients had adjuvant and/or curative chemotherapy. Treatment and cancer stage of PTCs are described in Supplementary Tables 1 and 2.
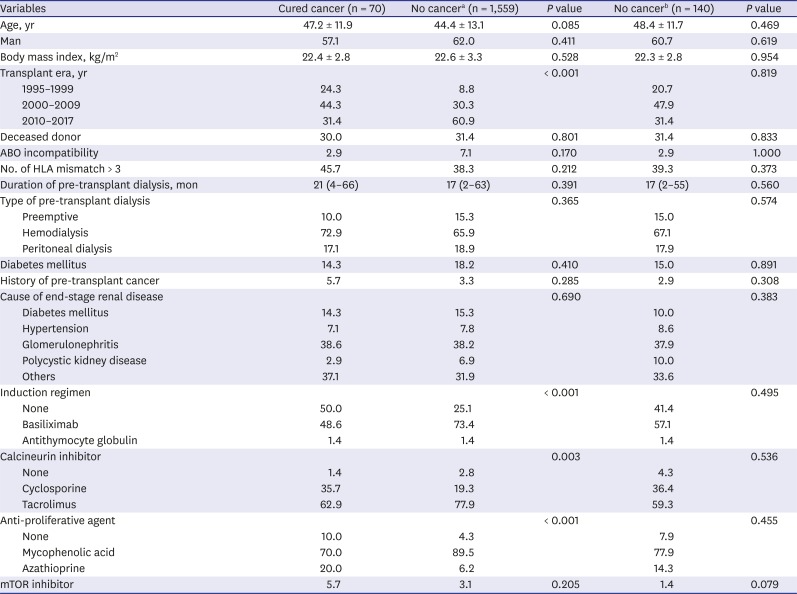
In the comparison of baseline characteristics, the patients with PTC had a lower prescription rate of basiliximab for induction, a higher prescription rate of cyclosporine as a calcineurin inhibitor, and more azathioprine use as an anti-proliferative agent compared with patients without PTC (Table 1). Because of several unbalanced factors, we performed propensity score matching with age, gender, and transplant era to mitigate differences in baseline characteristics between the groups. After matching of the propensity scores (Supplementary Fig. 1), there were no differences in baseline characteristics, including induction and maintenance immunosuppressants, between the two groups. Accordingly, non-PTC group after propensity score matching was used for the subsequent comparison analyses.
Table 1
Baseline characteristics of patients
Transplant outcomes in patients with cured PTC
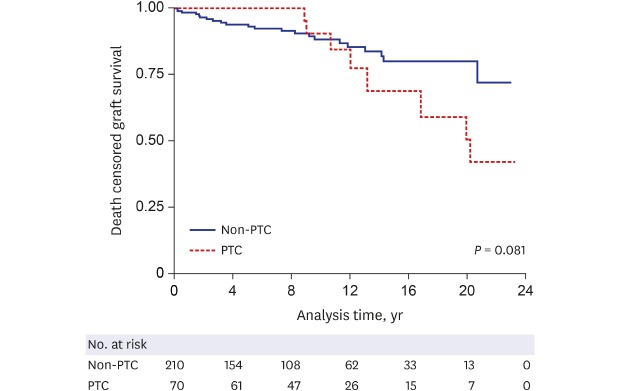
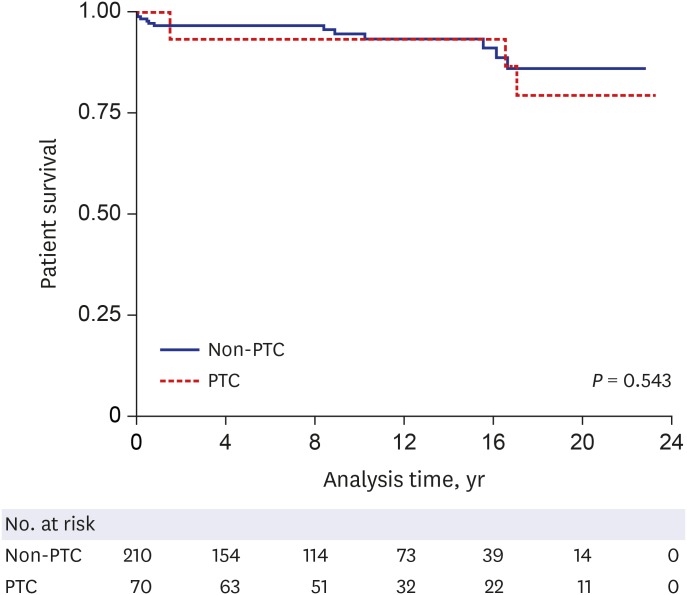
Among the 70 patients with cured PTC, 8 (11.4%) had graft loss after diagnosis. The median time from cancer diagnosis to graft failure was 6 years (3–8 years). When the Kaplan-Meier curves were drawn, the PTC group showed a lower graft survival rate than the non-PTC group with marginal significance (Fig. 1). Although unclear statistical significance founded in univariate Cox regression, the PTC group showed significantly elevated risk of death censored graft failure compared to non-PTC group in multivariable Cox regression with adjustment for age and gender (Table 2). Among the 70 patients with PTC, 3 (4.3%) died. The cause of death was sepsis (n = 2) and unknown (n = 1). Kaplan-Meier curves showed no difference of the mortality risk between the PTC and non-PTC groups (Fig. 2).
Fig. 1
Death-censored graft survival curves in patients with cured post-transplant cancer and patients without cancer. The P value in the graph was obtained by log-rank test.
PTC = post-transplant cancer.
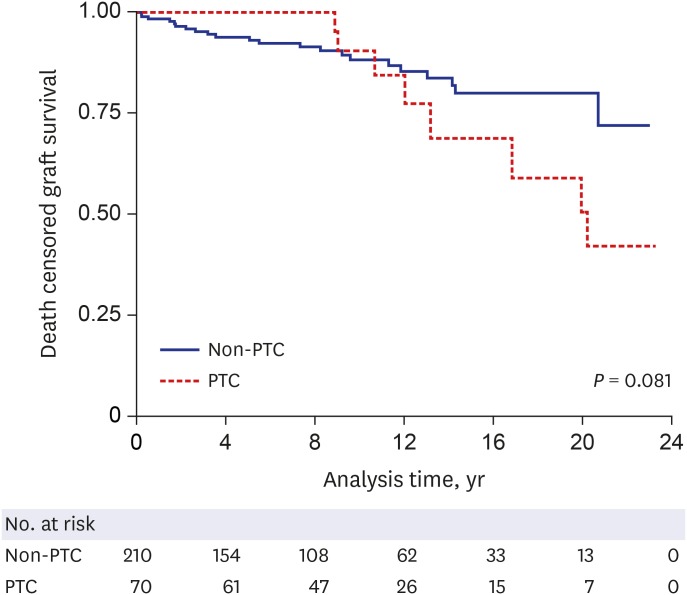
Table 2
Risk of transplant outcome according to post-transplant cancer
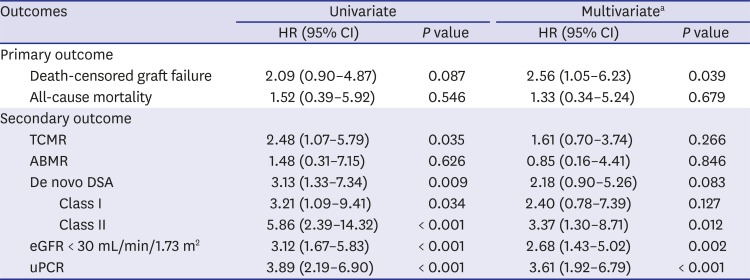
HR = hazard ratio, CI = confidence interval, TCMR = acute T cell-mediated rejection, ABMR = acute antibody-mediated rejection, DSA = donor-specific antibody, eGFR = estimated glomerular filtration rate, uPCR = random urine protein-to-creatinine ratio, HLA = human leukocyte antigen, ESRD = end-stage renal disease.
aAdjusted for variables with a P value of < 0.1 in the univariate analysis: age and gender in death-censored graft failure, age, gender, body mass index, and diabetes mellitus in all-cause mortality; age, transplant era, ABO incompatibility, the number of HLA mismatch, and induction agents in TCMR and ABMR; transplant era and the number of HLA mismatch in de novo DSA; gender, diabetes mellitus, and the number of HLA mismatch in eGFR < 30 mL/min/1.73 m2; age, transplant era, diabetes mellitus, the number of HLA mismatch, induction agent, and the cause of ESRD in uPCR > 1.0 g/g.
Fig. 2
Overall patient survival curves in patients with cured post-transplant cancer and patients without cancer. The P value in the graph was obtained by log-rank test.
PTC = post-transplant cancer.
As the secondary outcomes, the risks of immunologic complications such as acute T cell-mediated rejection and acute antibody-mediated rejection were not different between the PTC and non-PTC groups. However, the risk of de novo DSA, particularly against HLA class II, was higher in the PTC group than in non-PTC group. Additionally, the risks of estimated glomerular filtration rate < 30 mL/min/1.73 m2 and proteinuria (i.e., random urine protein-to-creatinine ratio > 1 g/g) were increased in PTC group compared to non-PTC group, indicating that cured PTC significant correlates with allograft function after kidney transplantation (Table 2).
Risk of graft failure according to cancer type
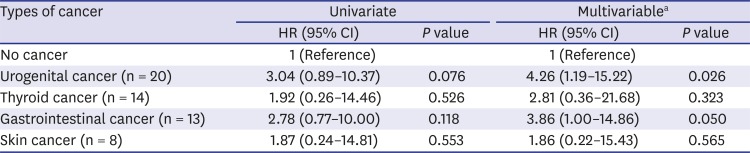
The PTCs were classified according to the primary site of development to determine whether graft loss was associated with the specific organ. Depending on the frequency of cancer in this cohort, we divided the PTC group into four subgroups: urogenital, thyroidal, gastrointestinal, and skin cancers. Among the four types of PTC, the median time to cancer diagnosis was shortest in the urogenital cancer group (2.6 years [0.8–9.4 years]) and longest in the skin cancer group (10.3 years [6.4–15.6 years]), but there was no significant difference between the groups (P > 0.05). The median time from PTC to graft loss was 6.5 years (3.4–8.5 years) in the urogenital cancer group (n = 3), 2.5 years in the thyroid cancer group (n = 1), 6.7 years (1.5–11.3 years) in the gastrointestinal cancer group (n = 3), and 4.7 years in the skin cancer group (n = 1). There was no difference in the median time from PTC to graft failure between the groups (P = 0.826). When the graft failure rate was compared with that in the non-PTC group, the urogenital cancer group had a particularly elevated risk of graft failure (Table 3).
Table 3
Risk of death-censored graft failure according to type of cancer
The characteristics of patients with cured PTC with subsequent graft failure are listed in Table 4. The treatment was surgical ablation of the cancer without adjuvant treatment. There was no evidence of postsurgical or post-contrast acute kidney injury, but the graft function slowly decreased with time. Five patients underwent graft biopsy before graft loss, showing acute T cell-mediated rejection with interstitial fibrosis and tubular atrophy (n = 4) and recurrent IgA nephropathy (n = 1). Three patients showed positivity on the panel-reactive antibody assay after treatment of PTCs; one patient was suspected to have chronic antibody-mediated rejection because of positive DSAs against HLA-DR and thus received treatment for rejection. The causes of the other two graft failures were unknown.
Table 4
Information on patients with cured cancer and subsequent graft failure
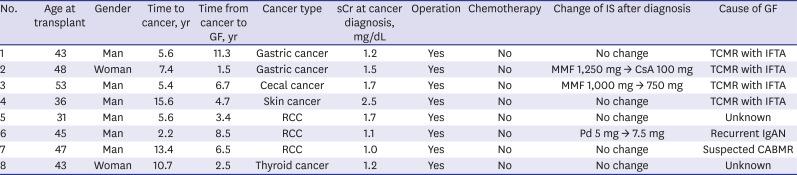
GF = graft failure, sCr = serum creatinine, IS = immunosuppressant, TCMR = acute T cell-mediated rejection, IFTA = interstitial fibrosis and tubular atrophy, MMF = mycophenolate mofetil, CsA = cyclosporine, RCC = renal cell carcinoma, Pd = prednisolone, IgAN = IgA nephropathy, CABMR = chronic antibody-mediated rejection.
The risk of acute T cell-mediated rejection in patients with gastrointestinal cancer was higher than that in the non-PTC group with an adjusted HR of 20.44 (6.02–69.39) (P < 0.001). However, the risk of rejection did not differ between the other cancer groups and the non-PTC group. The similarity of the risks of acute antibody-mediated rejection and de novo DSAs between the PTC and non-PTC groups was not dependent on the cancer type.
Effect of change in immunosuppressants on transplant outcome
Among the 70 patients with cured PTCs, 3 discontinued calcineurin inhibitors including tacrolimus and cyclosporine, 12 discontinued anti-proliferative agents including mycophenolic acid and azathioprine, and 14 started mammalian target of rapamycin (mTOR) inhibitors including everolimus and sirolimus after the cancer diagnosis. In the PTC group, each immunosuppressant status was not associated with graft failure (P = 0.498 in discontinuation of calcineurin inhibitors, P = 0.142 in discontinuation of anti-proliferative agents, and P = 0.106 in starting mTOR inhibitors according to the χ2 test).
DISCUSSION
Because of the great improvements in allograft and patient survival among kidney transplant recipients, long-term complications such as PTC have become a challenging issue. Although several guidelines recommend screening of PTC and focused on the importance of early detection and treatment of PTCs,192021 the present study found that even successfully treated PTC had a high risk of graft failure. The risks of graft failure and acute T cell-mediated rejection were particularly related to urogenital and gastrointestinal cancer, respectively, but the change in immunosuppressants with cancer diagnosis was not associated with graft failure.
Cancer is a long-term complication after transplantation.89 Several studies to date have focused on cancer-related mortality in kidney transplant recipients, wherein PTC was a major cause of death compared with the general population or non-PTC patients.789 The standardized mortality rate in young recipients was significantly higher than that in the general population (26.36 for patients 0–19 years old and 4.48 for those 20–39 years old),8 and patients with PTC had a shorter survival time (median, 2.1 years) than age- and gender-matched patients without PTC (8.3 years).7 Nevertheless, the effect of PTC on graft function has not been studied in detail. A previous study showed an elevated risk of graft failure in patients with non-cutaneous cancer but did not consider the curability of cancer.22 Another study showed that kidney recipients with post-transplant lymphoproliferative disorder were at risk of graft failure, but the authors did not analyze patients with solid organ cancers.23 The present study only included patients with cured solid organ PTCs since non-curable PTCs might affect grafts by not only cancer itself but also administration of nephrotoxic chemotherapy or other agents that may confound the relationship between the cancer itself and graft function.
According to the previous literature, cancer may alters immune system and produces tumor-promoting signals through immunoediting.24 Thus, apart from using immunosuppressive agents after transplant, the alloimmune response of host, kidney recipients, might be altered by the PTC itself. In the present study, graft failure risk in patients with PTC was particularly high in those with urogenital cancer. Renal cell carcinoma is a well-known immunogenic cancer that harbors many tumor-infiltrating immune cells,25 and various immune-modulating agents have been applied to the treatment of advanced renal cell carcinoma.26 In one study, the CD4+ T cells and the ratio of CD4+ per CD8+ T cells were elevated at 1 week postoperatively, and the increase remained consistent until 3 months.25 Therefore, our results suggest that tumorectomy of renal carcinoma in kidney recipients may alter immune system of recipients, which in turn may affect graft survival by altering the response to immunosuppressive agents. Additionally, the relationship between gastrointestinal cancer and acute T cell-mediated rejection in the present study may provide another evidence for the altered immune response due to the cancer or tumorectomy itself. A previous study showed a decrease in CD4+ T cells and an increase in CD8+ T cells after gastrectomy for cancer.27 The other study with the colon cancer patients reported a similar result after colectomy.28 Although these studies did not target PTCs, it is suggested that surgical stress can alter the adaptive or alloimmune status. Further studies are needed to determine whether this is the effect of the cancer itself or of the surgical stress associated with tumorectomy. All of these altered immunological milieus may underlie that most of the PTC patients who had graft failure showed gradually deteriorated renal function due to T cell mediated rejection with interstitial fibrosis and tubular atrophy. Other patients with graft failure were attributable to recurrence or antibody-mediated rejection, which might be also related with altered immunological milieu. However, post-operative acute kidney injury (2 cases of PTC patients) was not associated with later graft dysfunction. Collectively, the chronic immunological events rather than acute injury might leave fibrotic legacy in grafts.
The change in immunosuppressants after PTC diagnosis was not correlated with graft loss, and only one patient with graft failure changed immunosuppressants after PTC. Although the long-term risk of PTC depending on the immunosuppressive agents has been studied,293031 only one study has focused on the allograft outcome by the change in immunosuppressants after diagnosis of PTCs.29 The study has reported that the cancer patients who converted to an mTOR inhibitor resulted in graft function similar to that of the non-conversion group at the first year after cancer diagnosis.29 However, these studies, including the present study, were not randomized controlled trials; thus, the effect of the change in immunosuppressants after PTC should be carefully considered.
The main limitation of our study was the potential bias of the causal relationship because of the retrospective study design. However, because the incidence of PTCs is relatively low, a randomized controlled study would be difficult to perform. Hidden confounding factors affecting graft outcomes might exist, such as circulating or graft-infiltrating alloimmune cells. The further analysis of these immunologic factors will elucidate the underlying mechanisms in changing allograft outcomes.
In summary, the kidney recipients with cured PTCs have poorer graft outcomes than non-PTC recipients. In particular, urogenital and gastrointestinal cancers are associated with worse transplant outcomes. Accordingly, continued monitoring of graft function despite successful ablation of PTC should be emphasized. Additional studies are needed to confirm the underlying mechanisms and establish targeted therapy for post-PTC graft dysfunction.
 XML Download