

 PDF
PDF Citation
 Print
Print


Introduction
Autosomal dominant polycystic kidney disease (ADPKD) is the most common hereditary kidney disease affecting every 1 in 1,000–4,000 people in the world.123 As cysts in both kidneys grow in number and size, kidney function declines rapidly in the later stage of the disease. However, in the early stage of the kidney disease, renal function estimated by serum creatinine cannot reflect or predict renal disease progression in advance because autonomic adaptation by glomerular hyperfiltration occurs at this stage. Therefore, we cannot predict those who are likely to progress rapidly by serum creatinine or estimated glomerular filtration rate (eGFR) in the early stage of the disease.
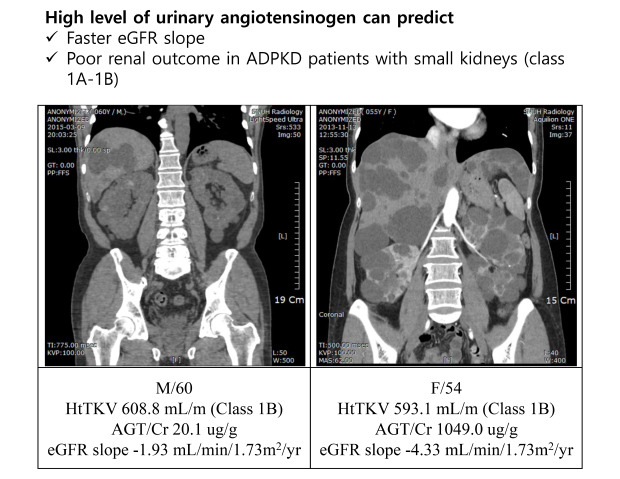
In recent decades, novel agents to slow down disease progression in ADPKD have been introduced. Most of the novel drugs are expensive and have considerable side effects. Therefore, high risk group should be defined in order to select those who will benefit the most from the novel drugs. Total kidney volume has been suggested as the best predictive biomarker in ADPKD.4 Irazabal et al.5 suggested imaging classification to predict renal outcome by classifying typical ADPKD into 5 group (1A-1E) according to age and height adjusted total kidney volume (htTKV). Mayo classification of 1C-1E showed faster decline of renal function compared to class 1A-1B. However, we have experienced some patients with relatively small kidneys with faster decline of eGFR, and therefore, htTKV cannot be the only biomarker for rapidly progressive disease.
Urinary angiotensinogen (AGT) is a 52- to 64-kD peptide molecule that is known to reflect the activity of intrarenal renin-angiotensin system (RAS). It is well known that intrarenal RAS plays a major role in the development of hypertension and progression of kidney disease.6 Our previous study demonstrated that AGT was highly expressed in the polycystic kidney tissues compared to normal kidney suggesting that AGT is the major molecule in the pathophysiology of disease progression in ADPKD.7 In addition, recent study demonstrated that urinary AGT to creatinine ratio (AGT/Cr) was higher in ADPKD group compared to other groups with different etiologies of chronic kidney disease (CKD).8 Fitzgibbon et al.9 demonstrated that suppression of AGT synthesis was efficacious in slowing kidney cyst formation compared with angiotensin converting enzyme inhibitors in PKD1 animal model. However, there has been no study demonstrating the usefulness of urinary AGT/Cr as an early biomarker to predict renal dysfunction. Therefore, this study was performed to evaluate urinary AGT/Cr as a predictor for eGFR decline and renal outcome in a prospective ADPKD cohort.
Methods
Study design
The KoreaN Cohort Study for Outcomes in Patients With Chronic Kidney Disease (KNOW-CKD) is a 10-year prospective CKD cohort in Korea funded by the Korea Centers for Disease Control and Prevention, to investigate the natural history, risk factors, complications of CKD according to different etiology, baseline eGFR and albuminuria. The KNOW-CKD study recruited a total of 2,238 subjects aged between 20 and 75 years with CKD stage 1 to 5 (pre-dialysis). The detailed study design and methods are described in our previous paper.1011
Study population
From 2011 to 2016, a total of 364 ADPKD patients were enrolled in the KNOW-CKD prospective cohort. ADPKD was diagnosed by Unified ultrasonographic criteria.12 From 364 ADPKD subjects, a total of 157 patients were excluded from analysis due to following reasons: 99 patients without htTKV data, 39 patients with a short duration of follow-up (< 12 months), 13 patients with baseline eGFR < 15 mL/min/1.73 m2, 6 patients without available urinary AGT measurement. Therefore, a total of 207 subjects were included in the analysis.
The study subjects were divided into slow progressors (SP) and rapid progressors (RP) according to Mayo imaging classification. We defined SP as those with class 1A–1B whereas RP as those with class 1C–1E by Mayo imaging classification. The subjects were also divided into 2 groups according to urinary AGT/Cr before analysis: the group with highest quartile of urinary AGT/Cr (hAGT group) and the group within the rest of quartiles (lAGT group).
Data collection
Epidemiologic data were collected at the initial visit including age, gender, height and body weight, modified Charlson's comorbidity score, and number and types of blood pressure lowering agents. Serum and urine samples were collected at the initial visit and annually thereafter. All laboratory parameters were measured at the central laboratory. Serum creatinine was measured using an IDMS-traceable method. The eGFR was calculated by CKD-EPI formula.13 Urinary AGT was measured at baseline by commercial sandwich enzyme-linked immunosorbent assay (Immuno-Biological Laboratories, Co. Ltd., Gunma, Japan) and adjusted by urinary creatinine contents as previously described.7 Total kidney volume was measured by stereologic method from computed tomography (CT) scans and adjusted by the height of the patient.
Outcome measurement
Annual decline of eGFR and renal outcome were measured to assess predictive value of urinary AGT/Cr. Annual decline of eGFR was measured by slope-based parameter using mixed-effects model.14 The eGFR decline slope was compared between hAGT and lAGT groups. Renal outcome was defined by either 50% decline of eGFR from baseline or doubling of serum creatinine from baseline or initiation of renal replacement therapy. Before analyzing renal outcomes, we further divided patients into 4 groups using combination of imaging classification (RP vs. SP) and urinary AGT/Cr values (hAGT vs. lAGT): SP/lAGT, SP/hAGT, RP/lAGT, and RP/hAGT groups. Renal outcomes were compared between 4 groups.
Statistical analysis
The variables that did not follow normal distribution were log-transformed before analysis. Baseline characteristics including eGFR and htTKV were compared between hAGT and lAGT groups. We performed χ2 test to compare categorical variables and independent t-test to compare continuous variables between groups. We performed Kruskal-Wallis test for non-parametric test to compare values among CKD stages or imaging classification groups. We performed univariate and multivariate linear regression analysis to demonstrate independent risk factors for faster eGFR decline slope. In addition, we evaluated cumulative hazard of renal outcome among 4 groups (SP/lAGT, SP/hAGT, RP/lAGT, RP/hAGT) using multivariable Cox regression model. The P value < 0.05 was considered statistically significant. Statistical analyses were performed using SPSS version 21.0 (IBM Corp., Armonk, NY, USA).
Ethics statement
This study was conducted in accordance with the Declaration of Helsinki and the study protocol was approved by the Institutional Review Board (IRB) at Seoul National University Hospital (IRB approval No. 1104-089-359). All participants provided written informed consent before participating in the study.
Results
Baseline characteristics of the subjects
A total of 207 ADPKD patients were included in this study. Mean age was 45.9 ± 10.7 years and 52.2% was men (Table 1). Most of them were hypertensive (88.9%) and 82.6% were taking RAS blocking agents (angiotensin converting enzyme inhibitor or angiotensin receptor blocker). Mean baseline eGFR was 79.0 ± 28.4 mL/min/1.73 m2 and median htTKV was 788.2 (471.2; 1,205.2) mL/m. About 65.7% of subjects were RP according to imaging classification (1C–1E). However, either baseline eGFR (R2 = 0.007, P = 0.153) or baseline log htTKV (R2 = 0.005, P = 0.339) did not show significant correlation with log AGT/Cr (Supplementary Fig. 1). The level of urinary AGT/Cr began to elevate in the early stage of CKD and declined in the later stage (Supplementary Fig. 2). The level of urinary AGT/Cr was also elevated in the larger kidney, but there was no statistical difference (P = 0.101).
Table 1
Baseline characteristics of the subjects
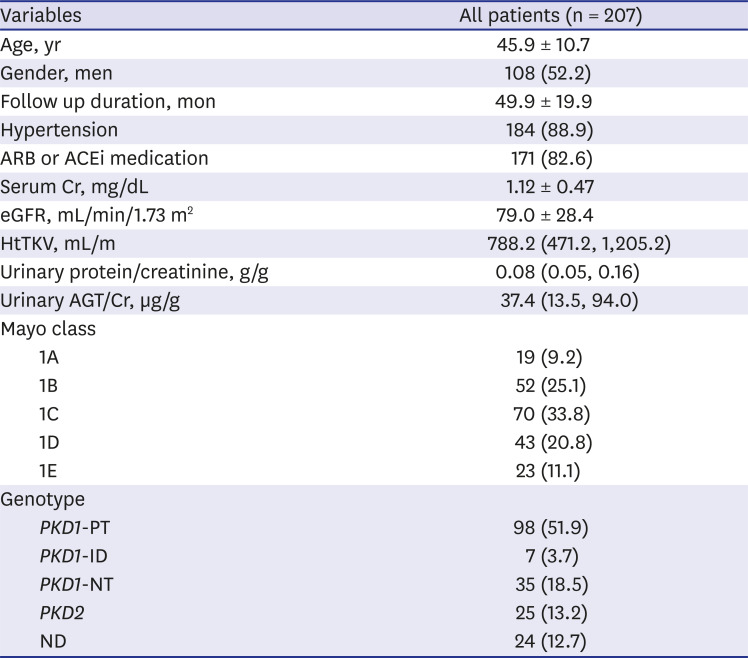
Data are presented as mean ± standard deviation or number (%).
ARB = angiotensin receptor blocker, ACEi = angiotensin converting enzyme inhibitor, Cr = creatinine, eGFR = estimated glomerular filtration rate, HtTKV = height-adjusted total kidney volume, AGT/Cr = angiotensinogen to creatinine ratio, PKD1-ID = PKD1 indel, PKD1-NT = PKD1 non-truncating, PKD1-PT = PKD1 protein truncating, ND = not determined.
Risk factors associated with high urinary AGT/Cr
Clinical variables and laboratory values were compared among hAGT and lAGT groups (Table 2). The median level of urinary AGT/Cr in hAGT group was 193.5 µg/g compared to 23.8 µg/g in lAGT group (P < 0.001). The patients in the hAGT group showed lower eGFR (72.4 ± 24.8 vs. 81.1 ± 29.2 mL/min/1.73 m2, P = 0.039), lower plasma hemoglobin (13.0 ± 1.4 vs. 13.7 ± 1.6 g/dL, P = 0.007), and higher urinary protein to creatinine ratio (0.14 [0.09, 0.38] vs. 0.07 [0.04, 0.12] g/g, P = 0.007), compared to lAGT group. However, baseline htTKV was not significantly different between groups (P = 0.219).
Table 2
Clinical factors associated with high urinary AGT/Cr
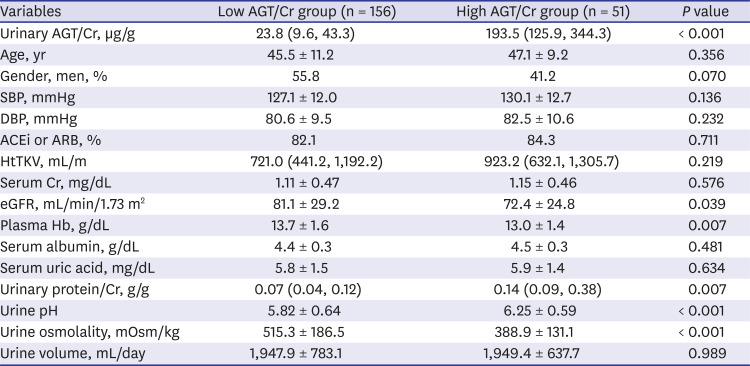
Data are presented as mean ± standard deviation or number (%).
AGT/Cr = angiotensinogen to creatinine ratio, SBP = systolic blood pressure, DBP = diastolic blood pressure, ACEi = angiotensin converting enzyme inhibitor, ARB = angiotensin receptor blocker, htTKV = height-adjusted total kidney volume, Cr = creatinine, eGFR = estimated glomerular filtration rate, Hb = hemoglobin.
Urinary AGT/Cr is an independent risk factors for eGFR decline slope
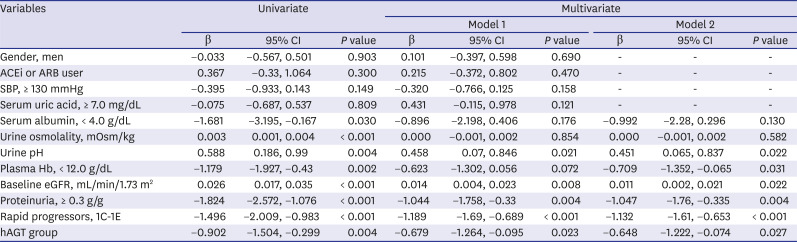
Although urinary AGT/Cr did not show significant association with baseline eGFR (Supplementary Fig. 1), log urinary AGT/Cr was negatively associated with eGFR slope with statistical significance (R2 = 0.027, P = 0.005) (Supplementary Fig. 3). However, log urinary AGT/Cr was not associated with TKV annual growth (P = 0.254). To demonstrate whether urinary AGT/Cr can predict faster eGFR decline, annual eGFR slopes were compared among hAGT and lAGT groups. The hAGT group showed faster eGFR slope compared to lAGT group (−3.59 ± 1.98 vs. −2.45 ± 1.89 mL/min/1.73 m2/year, P < 0.001). In univariate linear regression analysis, hAGT group as well as lower serum albumin (< 4.0 vs. ≥ 4.0 g/dL), lower urine osmolality, lower urine pH, lower plasma Hb (< 12.0 vs. ≥ 12.0 g/dL), lower baseline eGFR, higher urinary protein excretion (≥ 0.3 vs. < 0.3 g/g), and RP (1C–1E vs. 1A–1B) was associated with faster decline of eGFR (Table 3). When we performed multiple linear regression analysis with all the variables in model 1, hAGT group was an independent risk factor for faster decline of eGFR (B = −0.679 [−1.264, −0.095], P = 0.023). When we included only significant risk factors found in univariate analysis (model 2), hAGT group was still an independent risk factor (B = −0.648 [−1.222, −0.074]; P = 0.027) as well as low urine pH, low plasma Hb, low baseline eGFR, high urinary protein excretion, and RP (1C–1E) by imaging classification.
Table 3
Risk factors for eGFR decline slope
Urinary AGT/Cr is an additional predictive biomarker in slow progressors
Since imaging classification is the best predictive biomarker to date, we evaluated the predictive value of combined model of imaging classification and urinary AGT/Cr. After we divided the patients into 4 groups according to imaging classification (SP vs. RP) and urinary AGT/Cr level (lAGT vs. hAGT), we compared renal outcome between 4 groups (SP/lAGT, SP/hAGT, RP/lAGT, RP/hAGT). During the median follow-up of 4.6 years, 29 (14.0%) renal events (50% decline of eGFR, doubling or sCr, or development of ESRD) occurred. Compared to SP/lAGT group as the reference, SP/hAGT, RP/lAGT, and RP/hAGT groups showed significantly higher risk of developing renal outcome even after adjusting for men, PKD1 genotype, baseline eGFR, usage of RAS blocking agent, presence of macro-albuminuria, and SBP ≥ 130 mmHg (Fig. 1). Interestingly, urinary AGT/Cr showed independent predictive value in SP showing significantly higher risk of developing renal outcome in SP/hAGT group compared to the SP/lAGT group (hazard ratio [HR], 13.37; 95% confidence interval [CI], 1.282–139.324; P = 0.03) (Table 4).
Fig. 1
Renal outcome between combined modeling of imaging classification and urinary AGT/Cr groups. During the median follow-up of 4.6 years, 29 (14.1%) renal events (50% decline of eGFR, doubling or serum Cr, or development of ESRD) occurred. About 3 out of 55 patients (5.5%) in SP/lAGT group experienced renal events while 9 out of 35 patients (25.7%) in RP/hAGT group (P = 0.031). After adjusting for gender, PKD genotype (PKD1 or PKD2), baseline eGFR, SBP (≥ 130mmHg or not), presence of macroalbuminuria, use of ACEi or ARB, combined predictor of imaging classification and urinary AGT/Cr was still a significant risk factor for the renal outcome.
SP = slow progressors, lAGT = low AGT/Cr group, hAGT = high AGT/Cr group, RP = rapid progressors, AGT/Cr = angiotensinogen to creatinine ratio, eGFR = estimated glomerular filtration rate, ESRD = end-stage renal disease, SBP = systolic blood pressure, ACEi = angiotensin converting enzyme inhibitor, ARB = angiotensin receptor blocker, Cr = creatinine.
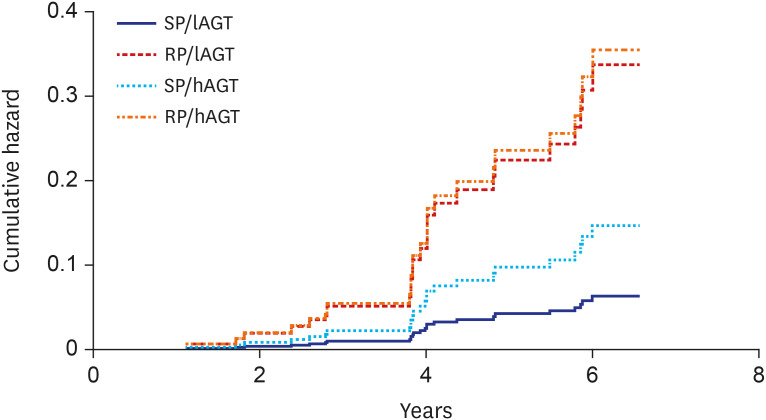
Table 4
Multivariable Cox regression analysis for renal outcome
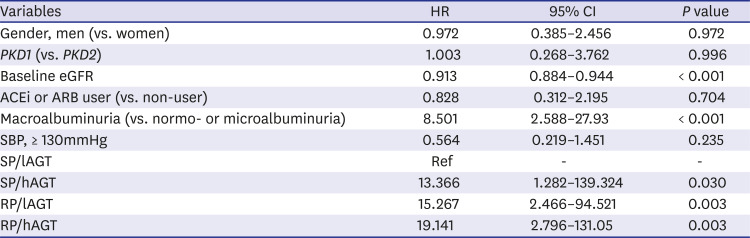
HR = hazard ratio, CI = confidence interval, eGFR = estimated glomerular filtration rate, ACEi = angiotensin converting enzyme inhibitor, ARB = angiotensin receptor blocker, SBP = systolic blood pressure, SP = slow progressors, lAGT = low AGT/Cr group, hAGT = high AGT/Cr group, RP = rapid progressors.
Discussion
This is the first study to demonstrate the additive predictive role of urinary AGT/Cr for future renal function decline in addition to imaging classification in the patients with ADPKD. We demonstrated that the patients with high urinary AGT/Cr have lower eGFR, higher urinary protein excretion, lower plasma Hb, and lower urine osmolality. In addition, high urinary AGT/Cr was an independent risk factor for steeper eGFR slope after adjusting for previously known risk factors including gender, baseline eGFR and RP. Finally, urinary AGT/Cr showed an additional predictive value for renal outcome in SP population.
Recent advances in novel therapeutic agents to attenuate cyst growth in ADPKD has led many clinicians to find useful biomarker to define RP and monitor drug effects. TKV is known to be one of the best markers to predict renal progression. Imaging classification has been used widely to define RP for clinical trials.5 However, measuring total kidney volume by magnetic resonance imaging (MRI) or CT is expensive, time-consuming, and does not tell all about future eGFR. In our experience, there are some ADPKD population that does not fit to imaging classification. For example, ADPKD patients with moderately enlarged kidney with exophytic cysts have good prognosis while others with medullary cysts have poorer renal outcome. Therefore, additional biomarker that can explain the heterogeneous nature of this disease is necessary.
Serum and urinary biomarkers have been suggested as alternative surrogate markers for renal function.15 Particularly, urinary biomarkers have caught attention because it is noninvasive and can be measured repeatedly to monitor disease. Various urinary biomarkers of acute tubular injury (NGAL, β2-microglobulin, NAG, KIM-1),16 inflammation (MCP-1)1718 and CKD (apelin, TGF-β1)19 have been evaluated previously. Some biomarkers showed association with eGFR and htTKV. However, most of them failed to show their predictive role in renal function decline.1720 That is because many of them are the result of damage but not the evidence of ongoing process. In addition, many of urinary biomarkers including albuminuria are affected by eGFR.
Urinary AGT is a large (52- to 64-kD) peptide molecule that cannot be filtered through glomeruli. Therefore, urinary AGT merely reflects ongoing process in kidneys. In addition, it may reflect underlying pathophysiology of ADPKD. First, it is associated with development of hypertension in ADPKD patients.6 Second, the level of AGT excretion is significantly increased in ADPKD population compared to non-ADPKD CKD patients.821 Third, our previous study demonstrated its high expression in cyst lining cells.7 In addition, the level of AGT is disproportionately increased in the early stage of the disease.7 At last, recent study demonstrated that suppressing AGT synthesis ameliorated cyst development and growth in PKD1 animal model.9 Therefore, urinary AGT can be a better early biomarker that reflects underlying pathophysiology.
In our cross-sectional analysis, urinary AGT/Cr was not correlated with concurrent eGFR or htTKV (Supplementary Fig. 1). In our previous study, there was a significant association between baseline eGFR (R2 = 0.162, P < 0.001) or baseline log htTKV (R2 = 0.107, P < 0.001) with log AGT/Cr.7 However, compared to the previous study, the subjects in this study showed higher urinary AGT/Cr (37.4 µg/g [13.5, 94.0] vs. 13.7 [7.5, 35.1], median [IQR]). Particularly, the subject in the early stage of CKD had higher urinary AGT/Cr compared to the previous cohort (103.0 ± 204.7 vs. 27.8 ± 58.5 µg/g in CKD stage 1–2). In addition, those with htTKV < 750 mL/m also demonstrated higher urinary AGT/Cr compared to the previous cohort (97.3 ± 221.6 v. 23.5 ± 48.2 µg/g). High level of urinary AGT/Cr in the early stage has led to the result of no significant association of urinary AGT/Cr with baseline eGFR or htTKV in the current study. Meanwhile, the high AGT/Cr group showed lower urinary osmolality. Recent study by Petzold et al.22 showed that urinary osmolality was negatively associated with htTKV and positively associated with eGFR. It is also known that renal concentrating capacity is significantly decreased in ADPKD patients compared to controls.23 Decreased renal concentrating capacity and urine osmolality may reflect elevated vasopressin activity and associated renal progression in ADPKD. However, we did not measure either vasopressin level or copeptin level. This association should be elucidated further in the future study.
When we analyzed annual decline of eGFR by slope-based parameter, the high AGT/Cr group showed faster decline of eGFR compared to the low AGT/Cr group. Moreover, this association remained true after adjustment for previously known risk factors including gender, baseline eGFR and imaging classification. Recent study demonstrated that urinary AGT/Cr was a significant risk factor for composite outcome (composite of patient death and renal events).8 However, previous study did not include htTKV and PKD genotype, the strongest known risk factor for renal function decline, as a covariable. Moreover, it takes a long time to approach ESRD or death in ADPKD, and therefore, it is better to analyze annual decline of eGFR or slope as a surrogate marker for renal events within a short follow-up duration.
In our Cox regression analysis for renal outcome, all SP/hAGT, RP/lAGT, RP/hAGT groups showed significantly higher risk of developing renal outcome compared to SP/lAGT group (reference group). The RP/lAGT and RP/hAGT groups are RP classified by imaging classification 1C-1E. Therefore, the different prognosis between SP/lAGT group and RP/lAGT or RP/hAGT group is not a new finding. However, it is interesting to see that SP/hAGT group showed poorer renal outcome compared to SP/lAGT group after adjusting for PKD genotype, gender, baseline eGFR, high SBP, and macroalbuminuria. This result is in the same vein that urinary AGT/Cr is increased in the early stage of CKD (Supplementary Fig. 2). Therefore, urinary AGT/Cr can be a good marker of renal ischemia that may reflect an early pathophysiology of cyst development and growth.
There are several limitations to this study. First, we did not evaluate components of systemic RAS including plasma renin and aldosterone. Although intrarenal AGT is known to influence renal progression in ADPKD, systemic RAS also can affect development of hypertension and renal progression. Second, most of the subjects (177 out of 207) had a preserved renal function (eGFR ≥ 45 mL/min/1.73 m2) at baseline. Therefore, urinary AGT/Cr in the advanced stage of disease may not be well defined because of small number of patients. Lastly, whether repeated measurements of urinary AGT/Cr have a value of monitoring disease progression cannot be answered by this study. This point should be elucidated further in the future study.
In conclusion, urinary AGT/Cr can be a useful biomarker for eGFR decline in addition to imaging classification. Therefore, combination of serum and/or urine biomarkers together with imaging classification and genotype is needed to delicately define RP in ADPKD.
 XML Download