

 PDF
PDF Citation
 Print
Print


INTRODUCTION
Benign prostatic hyperplasia (BPH) is a highly prevalent urologic condition among middle and advanced-age men, with increasing prevalence; 42% of 51- to 60-year-old men and 85% in men older than 80 years.1 BPH causes lower urinary tract symptoms (LUTS), and severe BPH can lead to deterioration in quality of life and has relevant socio-economic costs.2 BPH is histologically characterized by the nonmalignant enlargement of the periurethral transition zone of the prostate with stromal and epithelial cell hyperplasia.3 Traditionally, the pathogenesis of BPH is closely linked to age and the effects of androgens.4 However, recent studies have suggested that metabolic disease and other factors including family history, ethnicity, and lifestyle are closely associated with BPH.5 Furthermore, several studies have suggested the relevant roles of diabetes, hypertension, insulin and obesity in the pathogenesis of prostatic enlargement.678
Nonalcoholic fatty liver disease (NAFLD) is the most common liver disease, with an estimated prevalence of 20%–30%.9 Because the central pathogenesis of NAFLD development is insulin resistance, NAFLD is regarded as a hepatic feature of metabolic syndrome (MS).10 NAFLD has been known to be associated with extrahepatic diseases such as cardiovascular disease, chronic kidney disease and colorectal neoplasm.11 As extrahepatic manifestations of NAFLD, the association between NAFLD and BPH has been suggested.1213 However, to date, the sample sizes of the studies evaluating the association between NAFLD and BPH were relatively small and the association with respect to NAFLD severity had not been reported. A recent review article has reported that as consequences as severe as obese NAFLD, non-obese NAFLD in the general population occurs with a high prevalence as 21%–27% in all ethnicities.14 In this study, we aimed to evaluate whether NAFLD and NAFLD severity are associated with BPH independent of conventional risk factors. Furthermore, we performed subgroup analysis according to obesity for identification of the association between NAFLD and BPH in terms of obesity.
METHODS
Study population
In this retrospective study, men who underwent abdominal ultrasonography and transrectal prostate ultrasonography evaluation between January 2015 and December 2016 during health checkups at Seoul National University Gangnam Center were consecutively enrolled for this study. Initially, a total of 4,605 subjects were enrolled. A total of 3,058 subjects remained in the study after consideration of the following exclusion criteria: history of prostatectomy in 10 subjects; prostate-specific antigen (PSA) level > 10 ng/mL in 10 subjects; and potential cause of chronic liver disease including hepatitis B virus positivity in 162 subjects, anti-hepatitis C virus (HCV) antibody positivity in 42 subjects and significant alcohol intake (> 20 g/day) in 1,323 subjects.15 The subjects in the NAFLD group were randomly selected from the database file with propensity score (PS) matching to the control group (1:1 ratio).
Clinical and laboratory parameters
The method used in this study has been described previously in detail.16 Briefly, each individual completed a questionnaire describing current medications and their past medical history and underwent an anthropometric evaluation. All the subjects were assessed for LUTS using the International Prostate Symptom Scores (IPSS). LUTS severities were classified as mild (IPSS ≤ 7), moderate (IPSS of 8–19) and severe (IPSS ≥ 20). We defined current smokers as those who had smoked at least one cigarette per day in the previous year. Using height and body weight measured using a digital scale, body mass index (BMI) was calculated as weight in kilograms divided by height in meters squared (kg/m2). Waist circumference (WC) was measured with a measuring tape midway between the lower rib margin and iliac crest. Hypertension was defined as having systolic blood pressure ≥ 140 mmHg, having diastolic blood pressure ≥ 90 mmHg or using of anti-hypertensive medication.
Serum aspartate aminotransferase (AST), alanine aminotransferase (ALT), total cholesterol, triglycerides, high-density lipoprotein cholesterol (HDL-C), low-density lipoprotein cholesterol (LDL-C), fasting glucose, hemoglobin A1c, hepatitis B surface antigen and anti-HCV antibody levels were measured. PSA was measured using an immunoassay analyzer (Abbott i2000sr, Abbott Laboratories, Chicago, IL, USA). Fasting glucose levels ≥ 126 mg/dL and/or treatment with an oral hypoglycemic agent or insulin were used to define the presence of diabetes mellitus. MS was diagnosed when three or more of the following five components were present, based on the modified National Cholesterol Education Program Adult Treatment Panel III.17
Diagnosis of NAFLD and BPH
Hepatic ultrasonography (Acuson Sequoia 512; Siemens, Mountain View, CA, USA) was used both for diagnosis and staging of NAFLD. Ultrasonography examination was performed by experienced radiologists who were blinded to the clinical presentation of the subjects. Fatty liver was diagnosed based on known standard citeria.18 Grading of liver steatosis was performed based on ultrasonographic findings; mild fatty liver as a slight diffuse increase in bright homogeneous echoes in the hepatic parenchyma and the normal visualization of the diaphragm and hepatic and portal borders; moderate fatty liver as a diffuse increase in bright echoes in the hepatic parenchyma with slightly impaired appearance of intrahepatic vessels and the diaphragm; and severe fatty liver as a marked increase in bright echoes with poor or no visualization of intrahepatic vessel borders, the diaphragm and the posterior right lobe of the liver.19 The prostate gland volume and the transition zone volume were determined using transrectal ultrasound by a certified radiologist. BPH was defined by total prostate volume ≥ 30 mL.20
Statistical analysis
Independent samples t-test or one-way analysis of variance was used for the comparison of continuous variables in case of normal data distribution, whereas the Mann Whitney U test was used if the variables had a non-normal distribution. The Pearson's χ2 test was used for the comparison of categorical variables. A logistic regression analysis was utilized to analyze the association between NAFLD and NAFLD severity and BPH after adjusting for potential confounders, including age, smoking, BMI, diabetes, hypertension, MS, and HDL-C. We also showed PS‐adjusted model. PS was generated by logistic regression analysis with covariates including age, smoking, diabetes, hypertension, BMI, WC, AST, ALT, total cholesterol, triglycerides, HDL-C and LDL-C. Patients with NAFLD were matched (1:1) to those without NAFLD on the basis of PS. The balancing in variables between groups was evaluated by both P value and standardized mean difference (SMD). We analysed the PS‐matched cohort using conditional logistic regression. Statistical analyses were conducted using SPSS Statistics version 21 (IBM, Chicago, IL, USA) and Stata 14.2 (StataCorp, College Station, TX, USA). A P value less than 0.05 was considered statistically significant.
RESULTS
Study population
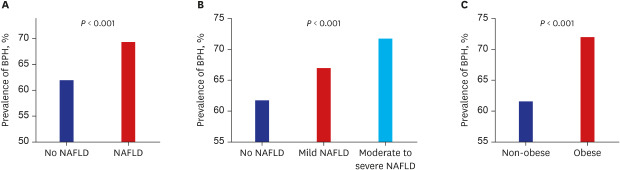
The mean age of the subjects was 56.9 ± 8.6 years. Of the 3,508 subjects, 2,308 (65.8%) subjects had BPH. The demographic characteristics of the subjects with and without BPH is provided in Table 1. Older age, higher prevalence rates of diabetes mellitus, hypertension and higher blood pressure, larger WC and higher BMI, fasting glucose levels, total prostate volume, transitional zone volume and PSA levels were observed in subjects with BPH than in subjects without BPH. The prevalence of NAFLD was significantly higher in subjects with BPH than in subjects without BPH (P < 0.001). Compared with normal prostate volume, the severity of NAFLD increased in the subjects with BPH (27.7% vs. 29.4% for mild, 20.0% vs. 26.4% for moderate to severe NAFLD).
Table 1
Comparison of baseline characteristics between subjects with and without BPH
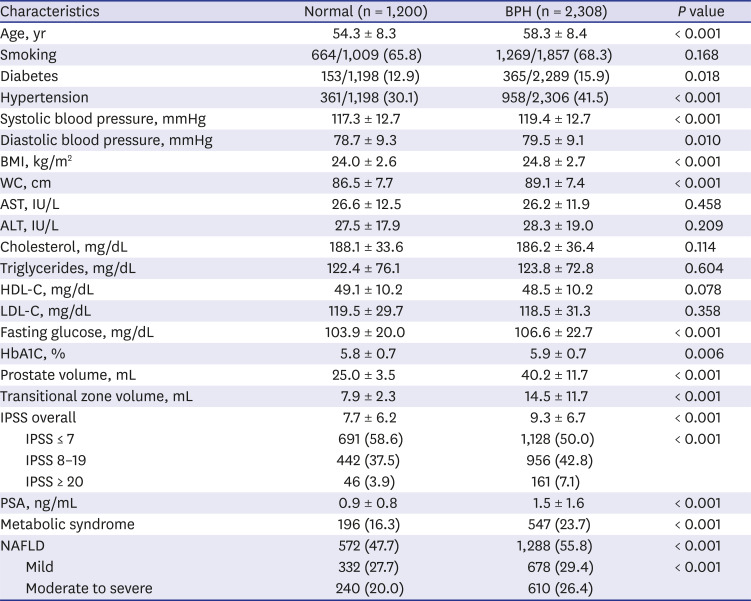
Data are shown as the mean ± standard deviations or number (%).
BPH = benign prostate hyperplasia, BMI = body mass index, WC = waist circumference, AST = aspartate aminotransferase, ALT = alanine aminotransferase, HDL-C = high-density lipoprotein cholesterol, LDL-C = low-density lipoprotein cholesterol, HbA1C = hemoglobin A1C, IPSS = International Prostate Symptom Score, PSA = prostate specific antigen, NAFLD = nonalcoholic fatty liver disease.
The prevalence of NAFLD was 53.0% in this cohort (mild 1,009 [28.8%] and moderate to severe 850 [24.2%]). Table 2 describes the characteristics of the study cohort according to the presence and severity of NAFLD. Noticeable differences were observed in the demographic and clinical characteristics of subjects with and without NAFLD. Subjects with NAFLD had higher prevalence rates of diabetes mellitus and hypertension, higher blood pressure and BMI, larger WC, higher serum levels of AST, ALT, triglycerides, LDL-cholesterol, and fasting glucose levels, and lower levels of HDL-C, than subjects without NAFLD. Subjects with NAFLD also had a higher prevalence of BPH and, higher prostate volume and transitional zone volume than subjects without NAFLD. In terms of the NAFLD severity, subjects with moderate to severe NAFLD had a higher prevalence of BPH than those with mild NAFLD (P < 0.05). Furthermore, subjects with moderate to severe NAFLD had higher prostate volume and transitional zone volume than those with mild NAFLD. IPSS was not different between with and without NAFLD. In the PS‐matched cohort, most variables were balanced between NAFLD and non‐NAFLD group after PS matching, several variables (fasting glucose, HbA1c, prostate volume, and transitional zone volume) were unbalanced (P < 0.05).
Table 2
Comparison of baseline characteristics according to presence and severity of NAFLD
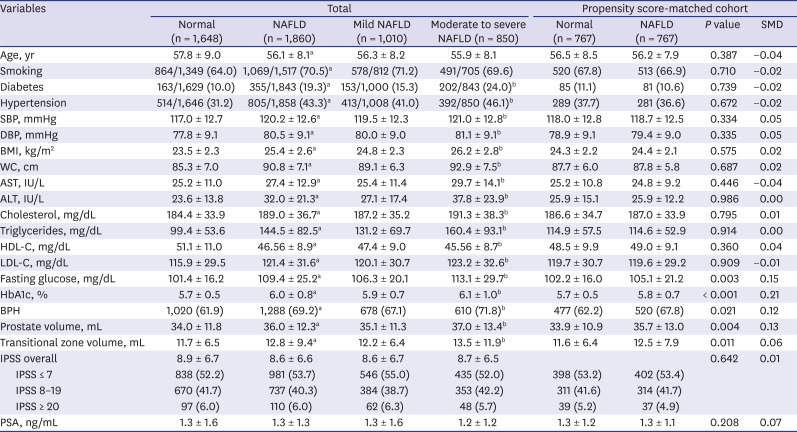
Data are shown as the mean ± standard deviation or number (%).
SMD = standardized mean difference, BMI = body mass index, SBP = systolic blood pressure, DBP = diastolic blood pressure, WC = waist circumference, NAFLD = nonalcoholic fatty liver disease, AST = aspartate aminotransferase, ALT = alanine aminotransferase, HDL-C = high-density lipoprotein cholesterol, LDL-C = low-density lipoprotein cholesterol, HbA1c = hemoglobin A1c, PSA = prostate specific antigen.
aP <0.05 no NAFLD vs. NAFLD; bP <0.05 mild vs. moderate to severe NAFLD.
NAFLD and BPH
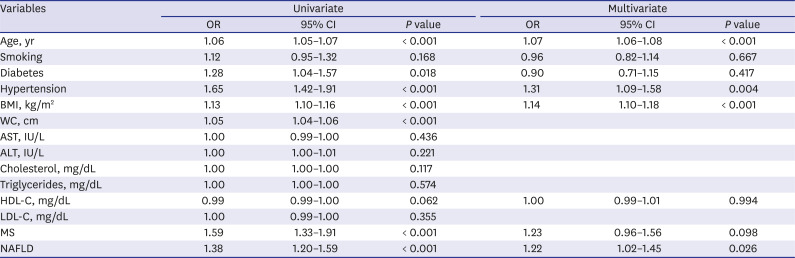
The prevalence of BPH was significantly higher in subjects with NAFLD, moderate to severe NAFLD, and obesity than in subjects without comorbidities (P < 0.001) (Fig. 1). We analyzed the independent factors that showed significant association with the risk of BPH using logistic regression analysis. As a result, older age, higher BMI, WC, presence of diabetes, hypertension, metabolic syndrome and NAFLD showed significant association with BPH (P < 0.05) (Table 3). NAFLD was associated with a 38% increase in the risk of BPH (odds ratio [OR], 1.38; 95% confidence interval [CI], 1.20–1.59) in the univariate model. In the multivariate analysis, older age, higher BMI, presence of hypertension and NAFLD still showed significant associations with BPH, suggesting that NAFLD has independent association with the risk for BPH (OR, 1.22; 95% CI, 1.02–1.45) (Table 3). When we performed subgroup analysis in subjects with moderate to severe LUTS (IPSS > 7), the association between NAFLD and BPH was not significant (data not shown).
Fig. 1
The prevalence of BPH according to various subgroups. (A) Comparison between no NAFLD and NAFLD, (B) Comparison among the three groups: no NAFLD/mild NAFLD/moderate to severe NAFLD and (C) Comparison between non-obese and obese group.
BPH = benign prostate hyperplasia, NAFLD = nonalcoholic fatty liver disease.

Table 3
Parameters associated with benign prostate hyperplasia
The multivariate model includes age, BMI, diabetes, hypertension, smoking status, HDL-C, and MS.
OR = odds ratio, CI = confidence interval, BMI = body mass index, WC = waist circumference, AST = aspartate aminotransferase, ALT = alanine aminotransferase, HDL-C = high-density lipoprotein cholesterol, LDL-C = low-density lipoprotein cholesterol, MS = metabolic syndrome, NAFLD = nonalcoholic fatty liver disease.
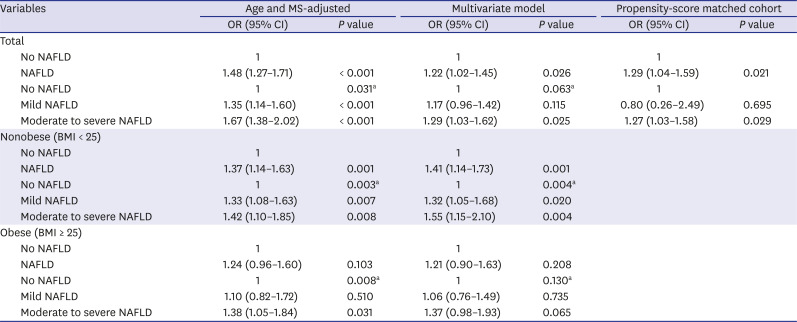
In addition, we analyzed data using logistic regression to evaluate the independent association between NAFLD severity and BPH. Based on an age-, and MS-adjusted model, the risk of BPH incrementally increased according to the severity of NAFLD (OR [95% CI], 1.35 [1.14–1.60] for mild NAFLD; 1.67 [1.38–2.02] for moderate to severe NAFLD, vs. no NAFLD; P for trend = 0.031) (Table 4). After adjusting for age, BMI, hypertension, diabetes, smoking status, serum HDL-C levels, and MS, this incremental association according to the NAFLD severity remained but the statistical significance was attenuated (adjusted OR [95% CI], 1.17 [0.96–1.42] for mild NAFLD; 1.29 [1.03–1.62] for moderate to severe NAFLD, vs. no NAFLD; P for trend = 0.063) (Table 4). When propensity score was adjusted, the association between NAFLD and BPH remained significant (OR, 1.29; 95% CI, 1.04–1.59), and subjects with moderate to severe NAFLD showed increased risk of BPH compared to those without NAFLD (OR, 1.27; 95% CI, 1.03–1.58).
Table 4
Univariate and multivariate binary and ordinal analyses of the risk of BPH in subjects with and without NAFLD
The multivariate model was adjusted for age, smoking, body mass index, diabetes, hypertension, MS and high-density lipoprotein cholesterol.
BPH = benign prostatic hyperplasia, NAFLD = nonalcoholic fatty liver disease, MS = metabolic syndrome, OR = odds ratio, CI = confidence interval.
aP value for the test of trend of odds.
NAFLD in non-obese subjects and BPH
Because the cut-off value for BMI between overweight and obesity was 25 kg/m2 according to the World Health Organization Asian-Pacific criteria,21 we then analyzed the effects of the interactions between obesity and NAFLD on the risk of BPH, stratifying subjects into non-obese (BMI < 25 kg/m2) and obese (BMI ≥ 25 kg/m2) categories according to their BMI. The prevalence rates of BPH were 61.7% in non-obese and 71.9% in obese subjects, respectively. The prevalence rates of NAFLD were 41.6% in non-obese and 70.8% in obese subjects, respectively. In non-obese subjects, NAFLD was associated with a 41% increase in the risk of BPH (OR, 1.41; 95% CI, 1.14–1.73) when other well-identified metabolic risk factors were considered, and the incremental increase in the risk of BPH according to NAFLD severity was pronounced in non-obese subjects with NAFLD (adjusted OR [95% CI], 1.32 (1.05–1.68) for mild NAFLD; 1.55 (1.15–2.10) for moderate to severe NAFLD vs. no NAFLD; P for trend = 0.004) as shown in Table 4. However, in the obese population, the association of NAFLD in the risk of BPH was insignificant (P = 0.208).
DISCUSSION
In this study, we found that NAFLD was associated with an increased risk of BPH, independent of well-identified metabolic risk factors. Moreover, the severity of NAFLD was associated with an incremental increase in the risk of BPH. However, when we stratified the data according to BMI, the association between NAFLD and BPH was only significant in non-obese subjects. This finding indicates that NAFLD is more important in non-obese subjects for the risk of BPH, and obesity itself may play a major role in the occurrence of BPH in obese subjects as we showed that obesity is a risk factor for BPH.
Consistent with our findings, several studies have suggested the correlation between MS and BPH. A previous study performed in Italy showed that the number of MS components was significantly correlated with prostate volume and anterior-posterior diameter in patients treated with simple prostatectomy, indicating the role of MS as a new risk factor of BPH.22 A systematic review demonstrated that subjects with MS had significantly higher total prostate volume than subjects without MS, suggesting the role of MS in the development of BPH.23 Because insulin resistance is a shared mechanism between NAFLD and MS, NAFLD is considered to be a hepatic manifestation of MS,10 and close associations have been found between NAFLD and MS.1024 Indeed, previous studies have suggested the association between NAFLD and BPH. However, the sample sizes were relatively small and the severity of NAFLD has not been evaluated.1213 In this study, we have demonstrated a significant association between NAFLD or NAFLD severity and BPH using a relatively large sample size. Because MS is considered a risk factor for BPH, we performed the logistic regression analysis adjusting for MS, and it showed that the association between NAFLD severity and BPH remained significant. This association implies that NAFLD is an independent risk factor for BPH regardless of MS. Furthermore, as obesity is a risk factor of BPH and due to the effects of the interactions between obesity and NAFLD on the risk of BPH, we stratified subjects into non-obese (BMI < 25 kg/m2) and obese (BMI ≥ 25 kg/m2) categories according to their BMI. The anaylses showed that the risk of BPH was significant in non-obese subjects with NAFLD but not in obese subjects with NAFLD, indicating that NAFLD may be more important risk factor of BPH in non-obese subjects, and other metabolic derangements of obesity may have more impact on BPH in obese subjects as the association of obesity with BPH is widely accepted.25 In agreement with our results, the independent association of NAFLD with BPH has been reported recently.2627
Although the mechanism by which NAFLD is associated with BPH is yet to be determined, the possible cause of the close link between NAFLD and BPH with intraprostatic inflammation could be insulin resistance and chronic inflammation. The pathogenesis may be complex and multidirectional. Insulin resistance is a common feature of NAFLD. Increased free fatty acid efflux leads to hepatic triglyceride accumulation and contributes to impaired glucose metabolism and insulin sensitivity in the liver and muscles.28 Insulin is a well-known mitogen and growth factor for prostatic epithelial cells. Hyperinsulinemia directly, or indirectly through altered sex hormones, increases sympathetic nerve activity and the insulin-like growth factor axis may lead to increased prostate muscle proliferation.29 Indeed, previous studies have shown that the increased serum insulin level is associated with an increased risk of BPH30, and hyperinsulinemia is causally related to the development of BPH.7 Hepatic steatosis is associated with chronic systemic low-grade inflammation. Many studies have demonstrated significant associations between NAFLD and inflammatory molecules and cytokines.31 Likewise, circulating levels of inflammatory cytokines have been found to be associated with increased risk of BPH,32 and inflammatory cytokines and chemokines represent a direct link between chronic prostate inflammation and stromal cell proliferation.33 Connected by the portal system, the liver is vulnerable to microbiome translocation and microbial products. Alterations in the microbiome may stimulate liver steatosis,34 and microbial products, such as lipopolysaccharides are potentially cytotoxic and induce inflammation. Lipopolysaccharides are recognized by Toll-like receptors which are related to hepatic injury stimulating Toll-like receptors, which activate several signaling cascades to induce the expression of inflammatory cytokines and chemokines.35 Interestingly, stromal prostatic cells are able to secrete interleukin-8 and other inflammatory chemokines, cytokines, and growth factors in response to inflammatory stimuli such as the triggering of Toll-like receptors by lipopolysaccharides.33 This pathway may induce the dedifferentiation of prostate smooth muscle cells and contribute to BPH.36
Another suggested mechanism is hormonal derangements induced by NAFLD. Recently we reported that NAFLD is associated with low serum testosterone.37 Under conditions of NAFLD, inflammatory cytokines released due to chronic hepatic inflammation are thought to directly affect the pituitary gland, reducing luteinizing hormone secretion,38 and may directly suppress the secretion of testosterone from Leydig cells.39 Although there is no clear relationship between the concentration of circulating androgens and BPH, other factors and sex hormones including androgen might be involved in the development and maintenance of BPH. Estrogens and androgens have been implicated as causes of BPH.404142 Altered relationship of the estradiol/bioavailable testosterone was correlated with BPH.43 Some authors showed that higher testosterone-to-dihydrotestosterone ratio was associated with a 42% decreased risk of BPH.44 The inhibitors of 5α-reductase which converts testosterone to the more potent androgen dihydrotestosterone have proven effective in the management of BPH, suggesting an essential role for androgens in BPH pathophysiology.41 Further functional studies examining free testosterone, bioavailable testosterone, dihydrotestosterone, estrogen and other related factors should be performed to better understand the link with NAFLD and BPH.
The definition of BPH is variable among studies and involves objective measurements such as prostate tissue volume, decreased urinary flow rate or pressure flow studies with bladder outlet obstruction and subjective measurements including history of noncancer surgery on the prostate, physician-diagnosed BPH or assessment with IPSS. Until now, no one definition has been shown to be more appropriate than the others. Although the correlation between prostate volume and LUTS severity is imperfect, a previous study has shown that low peak urine flow rate and high postvoid residual volume are associated with prostate volumes > 30 mL, which are significantly associated with acute urinary retention requiring catheterization, suggesting prostate volume as a predictor of more serious complications.20
Nevertheless, this study has several limitations. First, the current study was designed as a retrospective observational study, thus, it is difficult to provide a temporal association between NAFLD and BPH. Second, we could not collect data on insulin resistance, various inflammatory parameters or sex hormones. Third, biopsy results, which is the gold standard for the diagnosis of NAFLD, could not be obtained in this study. Because ultrasonographic exam may produce false-negative results when hepatic fatty infiltration falls less than 30%,45 and give rise to inter- and intra-observer diagnostic variability. However, ethical issues limit the application of invasive test to healthy populations; therefore, ultrasonography imaging has been used to diagnose NAFLD according to clinical guidelines.1546 In terms of BPH, biopsy could not performed and the degrees for the occlusion of the bladder outlet using uroflowmetry were not assessed. The diagnosis of BPH using prostate volume was considered to be limited. Finally, our study included selected population of East Asian ethnicity, therefore, the conclusions may not be generalizable to the entire population. Further researches are needed to confirm our results.
In conclusion, NAFLD was associated with an increased risk of BPH regardless of MS and an incrementally increased risk for BPH according to NAFLD severity was prominent in non-obese subjects with NAFLD although obesity was a risk factor of BPH. Thus, physicians may consider the risk of BPH in non-obese patients with NAFLD as well as obese ones.
 XML Download