

 PDF
PDF Citation
 Print
Print


INTRODUCTION
Hearing loss is one of the most common permanent birth defects that occurs in 1.5–6 out of 1,000 live births, and depending on the severity, it is one of the most common causes of preventable developmental delay.1 Approximately 20% of adults have hearing loss, while more than 30% of the elderly (≥ 65 years) population have moderate-to-high levels of hearing loss that requires hearing-assistive devices such as a hearing aid.2 Nonetheless, only a limited number of people with hearing loss have visited audiology clinics to undergo a professional hearing test because of the high medical expense and limited access to these clinics.
As a screening test, digits-in-noise (DiN) was developed to assist a person to decide whether he/she needs a professional hearing assessment at a clinic. The DiN test involves detecting sets of three spoken digits (e.g., “2-1-6”) against a speech-shaped noise. During the test, the ratio of noise level and digits are adaptively varied depending on the responses, and speech reception threshold (SRT) values are measured at the end of the test.3 The DiN test is a cognitively undemanding test and is suitable for a broad age range of subjects from young children to the elderly, despite being dependent on low-level speech intelligibility and working memory.45 Starting with the Dutch version of the DiN test that was developed by Smits et al.,3 the test has been adapted in at least eight languages worldwide including German, English (American and British), French, Swedish, Polish, Greek, and South African.
The DiN test has gained increasing popularity as a test of auditory function for several reasons. First, it is relatively insensitive to linguistic skill. Second, the digits are the most commonly used words, and most typically cognitively developed children (≥ 4 years) can easily recognize spoken digits.6 Third, administration of the test is relatively easy and quick, given that the DiN test takes about 5 minutes to complete with a young child and does not need a sound booth. Moreover, it can be delivered over the internet and is not dependent on high fidelity transducers (i.e., cheap computer headphones are sufficient).5 Last, unlike pure tone audiometry and otoacoustic emission, it does not require professional help and thus, markedly reduces medical expenses.
Speech-in-noise (SiN) hearing is a crucial aspect of human communication and one that is frequently cited as being especially vulnerable to impaired temporal processing. Clinical reports suggest that people with auditory processing disorders,78 single-sided deafness,9 and/or cognitive impairment such as dementia,10 as well as children with reading difficulties11 have particular difficulty in hearing speech under noisy environments. For example, a previous study found that children with auditory processing disorders are worse at simple SiN tasks than typically developed children, and their behavioral performances are correlated with their academic achievement.12 Furthermore, decreased SiN perception in people with mild cognitive impairment is related to lower cognitive skills.13 Measuring SRT using SiN tasks can reflect the cognitive level of the patients because of the interplay between cognition and sensation in hearing. From this point of view, the DiN test can be used as a SiN test to quantify the important role of top-down influences on people with cognitive impairment. Specifically, this study aimed to develop the DiN test not only to develop hearing screening test but also to utilize it as a test for SiN perception to objectively measure cognitive function.4
Despite several advantages of the DiN test as a testing tool for hearing screening and SiN perception and the growing clinical need, the DiN test has not yet been developed in Korean. The aim of the present study was to develop the Korean version of the DiN test to provide a useful hearing screening tool for future clinical, training, and research purposes. To develop the Korean DiN (K-DiN) test, three experiments were conducted including optimization of the test, development of test application, and examination of the effect of device type on SRTs. Specifically, experiment I included recording digits and optimization of the speech materials. In experiment II, we developed a smartphone application and generated digit triplets for the adaptive test. Finally, in experiment III, we examined the effect of a smart device on performances of the K-DiN test.
Go to : 
METHODS
Experiment 1: recording and optimizing the digits
Recording and speech material
The procedures for recording, processing, and optimizing were based on previously published papers describing the development of the Dutch SiN screening test.3 The Korean digits 0–9 were used as the speech material for K-DiN test.
Digits
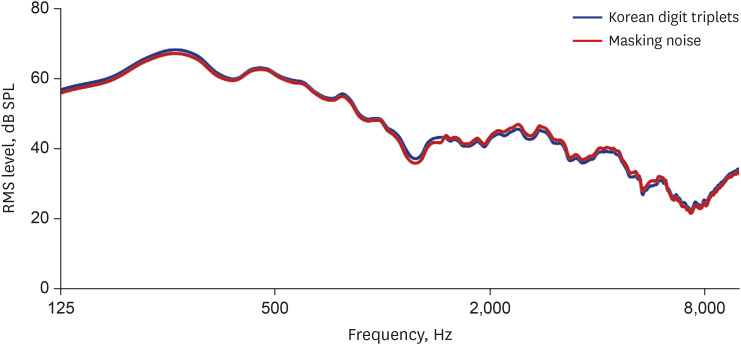
All digits were recorded by a native Korean female speaker. Before the actual recording, the speaker practiced speaking the digits several times to ensure consistent speed and accent. To maintain the naturalness of speaking the triplets, an opening phrase “the numbers…” preceded the first digit of the triplets; the numbers were always recorded as triplets rather than as individual digits. Monosyllabic digits 0–9 were included, and each digit could be allocated in three different positions—first, second, or third in the triplet. The speech stimuli were recorded in a sound-attenuated booth using a professional recording microphone (AKG Perception 220 Professional Studio Microphone; Harman International, Stamford, CT, USA) and a sound card (Soundblaster; Creative Technology Ltd., Singapore) at a sample rate of 48 kHz and stored as 16 bit.wav files for offline processing. A professional assessed the recorded digits to select representative digits for each position according to the intonation, vocal quality, naturalness, and speed. Silence was added at the end of the digit to achieve the same overall duration. The amplitude of the sound waveform was adjusted by equalizing the root-mean-square of each digit using audio editing software (Adobe Audition Pro; Adobe Systems Inc., San Jose, CA, USA). A total of 30 digits including three different.wav files for each digit were created for their different positions in the triplets. The masking noise was white noise which was spectrally matched with the long-term averaged speech spectrum of the speech stimuli (Fig. 1). The loudness of the masking noise was equal to the average loudness of the digits.
Optimization
An optimization procedure was conducted to equate the recognition of the triplets in noise across the digits. The procedure included equalizing the sound levels of the digits to accomplish 50% accuracy at the same signal-to-noise ratio (SNR). This step is important to establish the prerequisite that the SRT is assessed by the correct number of digits with equal audibility.
Participants
Twenty young adults (10 women) participated in the optimization testing. The mean age of the participants was 23.51 (standard deviation [SD], 3.9) years (age range, 19–30 years). The participants were screened for an audiometric hearing threshold value ≤ 15 dB hearing level (HL) at octave test frequencies from 250 to 8,000 Hz; further, we made sure that they had no history of psychological and/or neurological diseases. All participants spoke standard Korean and signed an informed consent form and were remunerated for the participation. All experiments were conducted at the Department of Otolaryngology at Hallym University Medical Center (Anyang, Korea).
Methodology
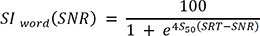
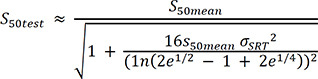
The purpose of the optimization procedure is to create a psychometric function that can be obtained by speech intelligibility as a function of SNR for individual digits. In this study, we measured the psychometric function for each digit in 20 people with normal hearing. The measured function was averaged across the subjects to compute mean SRT values for each digit. If a difference existed between the measured psychometric function and the mean SRT at the 50% point, the level of the digit was shifted toward the matching point to fit with the mean SRT. For optimization testing, a set of 30 triplets was developed in three different lists. The lists included digits in each SNR with each position in the triplets (i.e., first, second, and third in the triplet). During the optimization testing, every subject was measured using 100 triplets at nine different SNR values ranging from −2 dB to −18 dB with 2 dB increments. The digits were presented pseudo-randomly, individually, and mixed with the speech-shaped noise presented at a constant level (70 dBA). Stimuli were presented to either the left or right ear through TDH-39 headphones (Telephonics, Farmingdale, NY, USA) via a SoundBlaster audio card, whichever was preferable to the subject. If there was no preference, stimuli were presented to the right ear via headphones. To identify correct responses, triplet scoring by calculating the correct identification of a triplet rather than having to identify each digit was applied. Digit-specific intelligibility was fitted with a logistic function respectively applied to each SNR using equation (1), and predicted test-specific slope was determined based on equation (2), as shown below14:
A customized LabVIEW program (National Instruments, Austin, TX, USA) was used to conduct the DiN test with triplets. During the optimization procedure, the program presented a telephone keypad for subjects to respond using a separate keypad, even when they were unsure. To move on to the next triplet, the subject had to select all three digits, and if unable to recognize a digit, their best guess was accepted. Each digit was included once in each list at the different SNRs. A total of 180 triplets were presented to each subject in a pseudo-random order. A level adjustment was not limited to preserve the natural intonation, and the maximum adjusted value was 6.2 dB. Short breaks were given between the lists. The total testing time for optimization was 50–60 minutes. The optimization test was completed in one session for each participant. To compare performances before and after optimization, mean SRT and mean slope were calculated from the mean value of averaging SRTs and slopes obtained from each list.
Experiment 2: development of the smartphone application and adaptive test procedure
Development of the smartphone application for K-DiN test
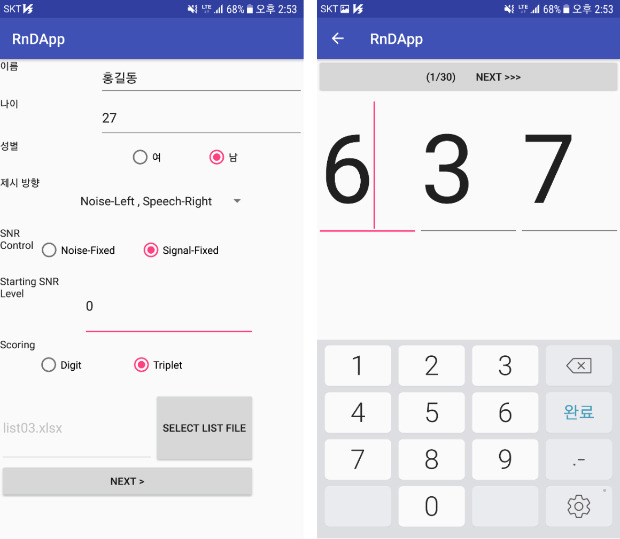
We created a smartphone application using the Java 10.0 language (Oracle Corporation, Redwood Shores, CA, USA) that can be downloaded onto any Android cellphone. On the first page of the application, the subject's demographic information such as name, gender, age, and the presentation method (left ear, right ear, left + right signals, left signal + right noise, and right signal + left noise) are recorded. The “Next” button is for the SNR control, at which point the SNR level presents DiN triplets at the beginning of the test. At this stage, subjects are asked to choose between noise-fixed SNR and signal-fixed SNR. After selecting the SNR level, the “Scoring” button allows selection of which way the score is obtained: either “easy” calculation based on how many digits are correctly identified or “hard” calculation based on triplet scoring. Last, an experimenter selects a file list from a total of six test lists. Each file list includes 30 triplets. Subjects are instructed to push the “Next” button when they are ready to start the test. Once the test starts, the test page is presented to incorporate the subjects' responses. A touch keypad resembling a telephone, including three rows and three columns for digits 1–9 and 0 in the middle of the bottom row, is displayed on the page along with a “Back” button and a “Finish” button (see graphical abstract).
Participants
Twenty-three adults (12 women) participated in the adaptive testing procedure. The participants were recruited through an online job search website. The mean age of the subjects was 25 (SD, 8.2) years (age range, 18–55 years). They had pure tone threshold values ≤ 15dB HL at each octave frequency from 250 to 8,000 Hz. All participants signed an informed consent form and were remunerated for participation.
Adaptive test procedure
For the adaptive testing, 180 DiN triplets were resynthesized using the .wav files of 30 digits and were assigned to six lists of 30 digits. During the testing, subjects listened to DiN triplets and entered a response on the keypad. There was an interstimulus interval (ISI) of 0.2 seconds with 0.1 seconds of jitter in between the digits. The silence before the first and after the third digit was 0.5 seconds, which translates to an ISI of 1.0 seconds between the trials. The entire stimulus duration was approximately 2.7 seconds. When the subject clicked the “Next” button, he/she continued to the next trial. The level of noise was fixed at 70 dBA, while triplets were varied according to the listener's response. Thus, SNRs were altered by the speech level. At the beginning of the test, the SNR was 0 dB, which was varied adaptively in 2 dB steps. When the response was correct, the SNR was reduced by 2 dB for the next trial; however, for an incorrect response, the SNR was increased by 2 dB. The overall level of the stimuli was kept relatively constant to avoid peak clipping of the stimuli and to make listeners hear sounds comfortably. Stimuli were presented monaurally through headphones, whichever was preferable to the subject. If there was no preference, stimuli were presented to the right ear. Thirty trials were conducted, and the average SNR over the last 20 trials was used to calculate the SRT for each subject, because the first few trials were used to achieve SRT levels. All three digits being correct were taken into account for the average. The adaptive test took approximately 40 minutes to complete all six lists.
Experiment 3: effect of smart device type on K-DiN test
Effects of device type on K-DiN test
An experiment was conducted to determine whether performances on listening in noise measured by the K-DiN application vary according to the type of smart device.
Participants
Twenty-five adults (11 women) participated. The participants were recruited through an online job search website. The mean age of the subjects was 27.7 years (SD, 5.5) (age range, 20–41 years). They had pure tone threshold values ≤ 15dB HL at each octave frequency from 250 to 8,000 Hz. All subjects signed an informed consent form and were compensated for the participation.
Equipment and measurements
Evaluation of the K-DiN test was conducted using three different smartphones (Samsung Note 3; Samsung Electronics, Suwon, Korea and LG G3 and LG G5, LG Electronics, Seoul, Korea) and one tablet (Samsung Galaxy Tab 2; Samsung Electronics) along with four different in-ear headphones. Among the in-ear headphones, two were of Samsung make and the others were LG bundle headphones accompanied with each device; hence, no technical calibration was needed. Subjects were tested via the assigned smartphone or tablet and completed all six test lists. Each smartphone and set of headphones were counterbalanced to evenly determine their effects on test results. Stimuli were presented at the level of 70 dB sound pressure level, and the sound level was measured and fitted using a sound level meter (Bruel & Kjaer 2250; Bruel & Kjaer, Nærum, Denmark).
Ethics statement
The present study protocol was reviewed and approved by the Institutional Review Board of Hallym University College of Medicine (approval No. 2018-02-019-001). Informed consent was provided by all subjects at the time of enrollment.
Go to :
RESULTS
Experiment 1
Fig. 2 shows the speech intelligibility of triplets as a function of SNR before and after optimization with 30 digits (digit 0–9 at each of the three positions). The percentage of correct values for each digit as a function of SNR were averaged across all subjects to obtain the psychometric function by applying a logistic function corresponding to 50% speech intelligibility (averaged across all subjects). The correction factor calculated by subtracting the SNR of a digit from the average SNR of all digits was applied to all digits for fitting with the 50% correct recognition function for all digits.
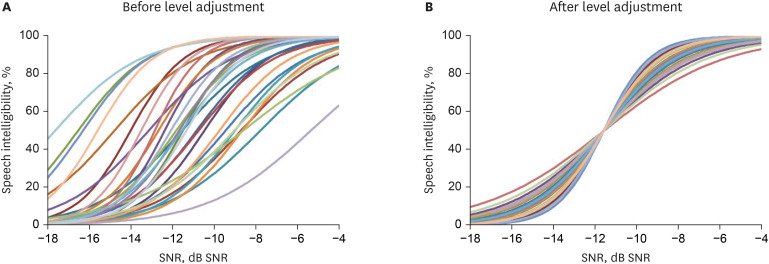 | Fig. 2Psychometric function of the digit triplets before (A) and after (B) optimization. Mean speech intelligibility as a function of SNR was averaged for each digit in three positions (first, second, and third in the triplet). A total of 30 curves for 30 digits (digit 0 to 9 at each of three positions) were created from the results of optimization. Note that the mean SRT was fitted to obtain 0 dB SNR for the standard deviation and the predicted test-specific slope was increased to fit with the mean slope after the optimization.SRT = speech reception threshold, SNR = signal-to-noise ratio.
|
Before optimization, the mean SRT revealing 50% speech intelligibility was −11.55 dB SNR (± 2.81), and the mean slope was 14.86%/dB (± 3.59). After optimization, the mean SRT was fitted to obtain 0 dB SNR for the SD, and the predicted test-specific slope increased to the level of the mean slope. The values of mean SRT, mean slope, and predicted test-specific slope before and after level adjustment are presented in Table 1.

Table 1
Psychometric functions before and after optimization
| Level adjustment | SRT, dB SNR | Slope, %/dB | Predicted test-specific slope, %/dB |
|---|---|---|---|
| Before | −11.50 ± 2.81 | 14.60 ± 3.59 | 10.2 |
| After | −11.50 ± 0 | 14.60 ± 3.59 | 14.8 |
Data are presented as mean ± standard deviation.
SRT = speech reception threshold, SNR = signal-to-noise ratio.
![]()
Experiment 2
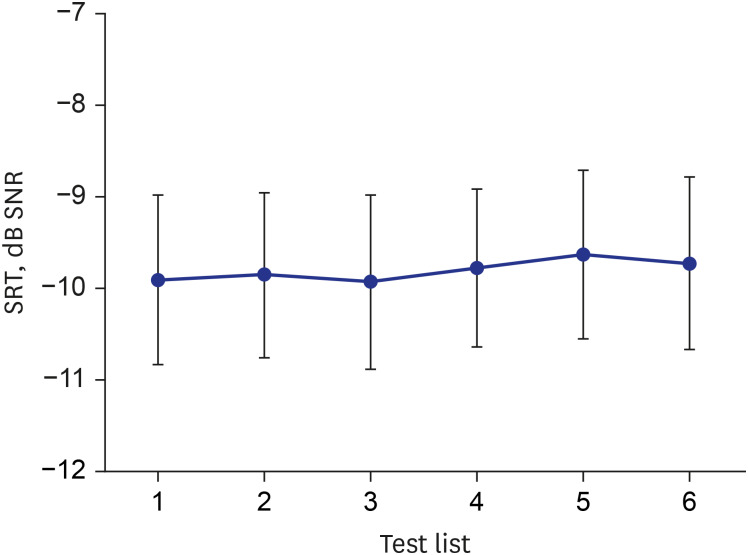
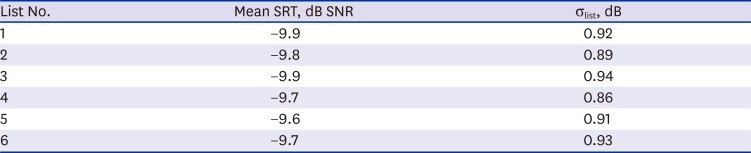
Mean SRT values and SDs measured during the adaptive testing were calculated for the six test lists (Table 2). Fig. 3 shows mean SRTs and SDs for each test list. A repeated-measures analysis of variance (ANOVA) was conducted to compare the SRT levels among the test lists, and the results revealed no significant differences among any of the list pairs (P > 0.05).
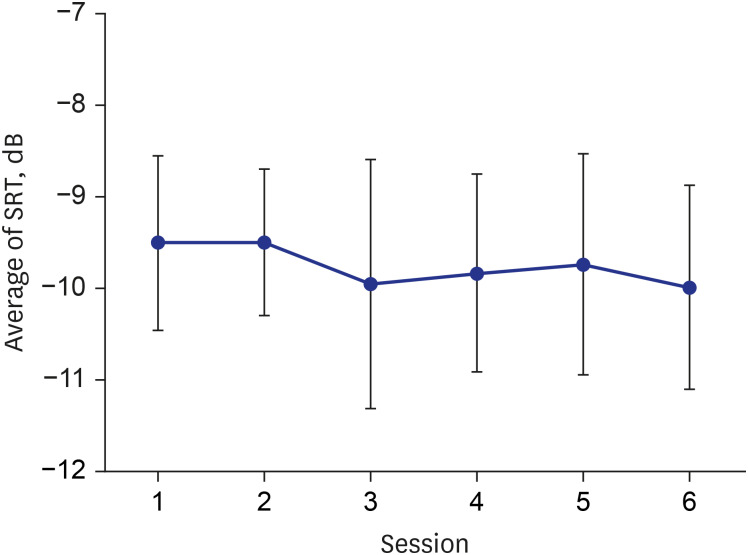
In addition, the mean SRT values as a function of session were compared using a repeated-measures ANOVA to examine a training effect on the SRT values (Fig. 4). The results showed that the SRT values obtained from the test sessions were not significantly different (F[5, 25] = 0.8, P = 0.5).
Experiment 3
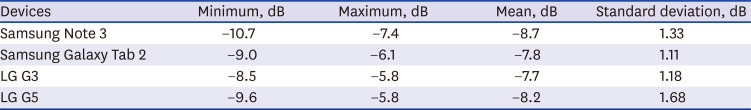
The mean SRT values for each device was −8.50 ± 0.36 for Samsung Note 3, −8.68 ± 0.52 for LG G3, −7.87 ± 0.26 for LG G5, and −8.11 ± 1.43 for Samsung Galaxy Tab 2. Descriptive statistics including maximum, minimum, and mean values of SNRs for four different devices are shown in Table 3. The slope for average speech recognition function was 17%/dB. A repeated-measures ANOVA was used to examine the main effect of device type on the SRT, and the results revealed that the SRT values measured by the four devices were not significantly different (F[3, 21] = 1.18, P = 0.34), indicating that the type of device did not affect the results of the K-DiN test.
Go to :
DISCUSSION
In the current study, we demonstrated a procedure for developing a K-DiN test. To develop this, we created sets of digits for three positions in a triplet and a psychometric function for 30 digits (digits 0–9 at each of the three positions) that were compared before and after optimization. During the procedure, mean SRT values were fitted successfully and the test-specific slope was fitted with the mean slope. A smartphone-based DiN test application was created using 180 new DiN triplets comprising six test lists. The results of the adaptive test showed that the test lists developed for the application could achieve high reliability, because the SRT values from the test lists did not vary significantly.
An optimization procedure for a Dutch DiN test developed by Smits et al.3 was used as a reference for our K-DiN test. In the Dutch DiN test, the optimization was conducted using triplets rather than single digits. The optimization with the triplets has advantages over the single digits, as it needs less effort and may show more conservative slope results, whereas averaging single digits could induce a steeper slope than the actual one. The predicted slopes of the intelligibility function in German (17%/dB),14 Dutch (16%/dB),3 and French (16%/dB)15 when applied the same optimization procedure of the K-DiN test were very steep. This indicates that the SRT values obtained with this procedure are accurate and efficient as compared to the single digit method.
In participants with normal-hearing, the average SRT value measured via the smartphone application was −9.9 dB SNR, which is comparable to that of the French (−10.5 dB)15 and South African (−10.6 dB)16 DiN smartphone application. However, the mean SRT level was lower than that in telephone-based DiN tests in the Netherlands (−6.9 dB)3 and Germany (−6.5 dB).15 This observation suggests that the lower average SRT values of the Korean, French, and South African DiN tests could be attributed to the increased sound quality provided by the higher speed processing of smartphones than telephone-based DiN tests, which use the limited bandwidth of telephone lines. This speculation is further supported by the findings from the French DiN test evaluated using telephone and smartphone-based tests. In that study, the SRT measured with the telephone and the smartphone were considerably different, in that the SRT from the smartphone (−10.5 dB) was higher than that from the telephone (−6.4 dB). Indeed, the K-DiN test application enables the delivery of a signal bandwidth ranging from 20 to 20,000 Hz, which covers all ages of the human voice and thereby increases the overall speech intelligibility.
Adaptive evaluation measurements show that the SRT values from the six different lists did not vary statistically. Furthermore, SDs from the lists ranged from 0.86 to 0.94 dB, which was less than 1 dB. These results confirm the reliability of the test materials of the K-DiN test. Meanwhile, the SDs measured during the adaptive testing procedure in the K-DiN test were greater than those in other languages such as French (0.7 dB).14 In our study, we used only six test lists for the adaptive test, whereas 10 lists were used in the French DiN test. More training in the French DiN test would decrease a variation in performances of participants. Hence, we assume that the larger SDs in our adaptive evaluation were due to the relatively small number of test lists.
In this study, we examined the effects of different types of smartphones (and tablets) on SRT values in listeners with normal-hearing. The statistical results revealed no significant differences among the devices, suggesting that the SRT value of the K-DiN test was not likely to be influenced by the device type. Moreover, our results were consistent with a recent report that showed no effect of smartphone type on SRT value measured via a smartphone-based DiN test in South Africa.16 In that study, the authors demonstrated that the DiN test application could be administered with most standard smartphones, supporting the use of the DiN test application as a screening test with high accessibility. Therefore, the DiN test has gained popularity, because it can be easily administered telephonically and online, and it uses only monosyllabic digits that are overlearned and easily identified even for young children and listeners with cognitive impairments. Nonetheless, this study has several limitations. First, this study did not perform a validation procedure at various levels of the SNR. To assure usefulness as a standard screening test, validating procedure of test materials and processes such as the test-retest method need to be carried out. Second, the results obtained from participants with normal-hearing need to be compared to those from people with hearing loss, which we did not address in this study. Last, future studies should measure the sensitivity of the K-DiN test by using a receiver operating characteristic curve to assess its potential as a diagnostic tool.
To our best knowledge, this is the first study to attempt to develop a Korean version of the DiN test—K-DiN. The development of smartphone technology makes this hearing test possible for people who need hearing screening in a quick and easy way. Given that the digits are less affected by linguistic and cognitive competence than sentences or word-based tests, the DiN test can be applied to children, users of cochlear implant, and patients with mild cognitive impairment. Nevertheless, normative data involving various age groups and test data from hearing-impaired people should be collected in a future study to help develop a more reliable hearing screening tool.
Go to :
 XML Download