

 PDF
PDF Citation
 Print
Print


INTRODUCTION
Rheumatoid arthritis (RA) is a chronic inflammatory disease with enhanced cardiovascular (CV) morbidity and mortality. Patients with RA have an approximately 70% higher risk of myocardial infarction than the general population, which is comparable to the risk in diabetic patients.1 Pooled analysis of CV mortality in 91,916 patients with RA demonstrated a 60% increase in CV mortality in these patients, who were compared with the general population2 and these rates did not change over time.3
In addition to the traditional risk factors such as obesity, insulin resistance, and dyslipidemia, the systemic inflammation that accelerates atherogenesis can contribute to the higher risk in RA patients.456 Several lines of evidence suggest that a high number of inflamed joints, elevated erythrocyte sedimentation rate, elevated C-reactive protein, and interleukin (IL)-6 confound the development of CV complications in RA,78 and the recommendations of a European League Against Rheumatism (EULAR) task force emphasize adequate control of disease activity to lower the CV risk in patients with RA.9
Methotrexate is the first-line disease modifying anti-rheumatic drug (DMARD), and is widely used for monotherapy and combination therapy for RA. It effectively controls immune inflammation in the joint and vascular walls, thereby improving CV and total mortality in RA.101112 Moreover, other DMARDs to control disease activity in RA patients could have significant effects on patient metabolic profiles,13 although controversy persists with regard to the effects of such therapies on lipids, adipokines, and insulin resistance.14
Inflammatory cytokines, including tumor necrosis factor (TNF)-alpha and IL-6 play central roles in RA pathogenesis; therefore, medications that inhibit TNF-alpha or block IL-6 receptors that are widely used to treat patients with RA refractory to conventional DMARDs include methotrexate. The use of TNF inhibitors is known to reduce the overall incidence of CV events.1215 However, as TNF-alpha is involved in weight loss,16 weight gain is reported after administering TNF-alpha inhibitors. In addition, increases in fat mass, and inconsistent correlations with serum adipokine level changes have been described.171819
With regard to IL-6 receptor inhibition by tocilizumab, another biologic DMARD that blocks an inflammatory cytokine pathway, there has been controversy for a long time on its CV safety. Tocilizumab increased cholesterol level,20 more severely than did adalimumab, a TNF inhibitor.21 Therefore, tocilizumab has been used with caution in patients with high CV risk, particularly patients with dyslipidemia. Following several reassuring data reports on major adverse CV events with tocilizumab compared to other biologic DMARDs,2223242526 a recent report of a postmarketing randomized controlled trial (RCT) upon the request of the US Food and Drug Administration showed that the risk of major adverse CV events of tocilizumab was comparable to etanercept, with a hazard ratio (HR) of 1.05.26
We investigated the effects of tocilizumab on traditional CV risk factors in patients with RA. Among the metabolic changes associated with tocilizumab use, the evidence for dyslipidemia is considered sufficient. Therefore, we focused on changes in body weight and adipokines—the protein mediators released by adipose tissue. A complex relationship between adipokines, RA, and CV diseases has been described, and the best-characterized adipokines are adiponectin, resistin, and leptin.27 Especially, the leptin-to-adiponectin ratio has been reported as an insulin-resistance proxy or arthrogenic index in many studies.282930
In view of all the above mentioned considerations, this study investigated changes in body weight after 24-week treatment with or without tocilizumab in patients with RA. Associations between body-weight changes and treatment responses or baseline body mass indexes (BMIs) were investigated. Finally, we investigated changes in levels of serum adiponectin, leptin, and resistin, as well as their association with weight change.
METHODS
Study design and patients
This retrospective study comprised three patient cohorts (Fig. 1). Cohorts I and II were derived from patients with active RA who participated in a RCT and the extension study of tocilizumab treatment (NCT01211834 and NCT01256736) from October 2009 to November 2013,31 excluding patients without 0- and 24-week weight records. Patients were eligible for the RCT if they had been diagnosed with RA according to the 1987 American College of Rheumatology criteria and had active disease refractory to methotrexate with or without other conventional DMARDs. Active RA was defined by a swollen joint count ≥ 6 from the total of 66, tender joint count ≥ 8 from the total of 68, and serum C-reactive protein level ≥ 1 mg/dL or erythrocyte sedimentation rate (ESR) ≥ 28 mm/h. Cohort I comprised 45 participants who received a placebo and methotrexate for the first 24 weeks, excluding patients who had no serum remaining for further adipokine analysis. Cohort II consisted of 46 participants who were administered tocilizumab (8 mg/kg) and methotrexate for 24 weeks.
Fig. 1
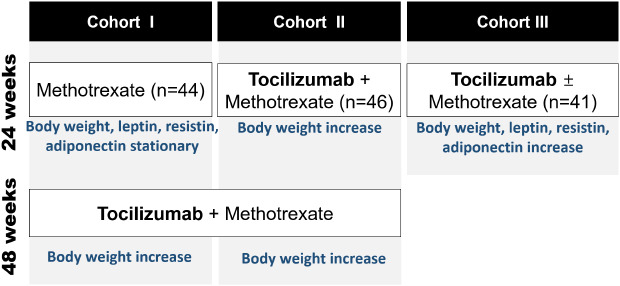
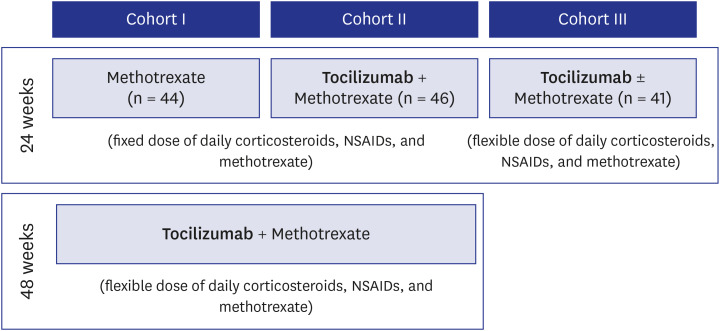
Study population and design. Cohorts I and II were extracted from clinical trial data of tocilizumab in patients with active rheumatoid arthritis. Cohort I comprised 44 patients who received methotrexate for 24 weeks, followed by tocilizumab for 48 weeks. Cohort II comprised 46 patients who received tocilizumab for 72 weeks. Cohort III comprised 41 patients who received tocilizumab with or without methotrexate for 24 weeks on clinical practice.
NSAIDs = nonsteroidal anti-inflammatory drugs.
Cohort III is an independent cohort of 41 patients with active RA who received tocilizumab therapy from January 2009 to December 2018 and were refractory or intolerable to methotrexate and/or conventional TNF-inhibitor treatment. Active RA was defined as DAS28 ≥ 5.1, or DAS28 ≥ 3.2 and the presence of new bone erosion after 6 months of treatment. All patients had weight data and serum samples for further adipokine analysis at 0 and 24 weeks.
Patients in Cohorts I and II received fixed daily doses of corticosteroids, non-steroidal anti-inflammatory agents, and methotrexate during the initial 24-week RCT. Thereafter, these patients participated in an open extension phase during which they received tocilizumab treatment for 48 weeks, and changes in the doses of corticosteroids, non-steroidal anti-inflammatory agents, and methotrexate were permitted during weeks 24–72 of the study. Therefore, we could evaluate weight changes among patients in Cohort I during the initial 24-week period of methotrexate treatment and the subsequent 48-week period of tocilizumab treatment. In Cohort III, doses of corticosteroids, non-steroidal anti-inflammatory agents, and methotrexate were not fixed.
Study variables
Data describing each patient's age, gender, body weight, height, BMI, disease activity score in 28 joints, prednisolone use, and concomitant DMARD use were collected at baseline and at 24 weeks. The patients' nutritional status was classified by their baseline BMIs as normal weight (< 25 kg/m2) and overweight (≥ 25 kg/m2), based on the World Health Organization's criteria. Weight gain was defined as an increase in weight of ≥ 0.1 kg, and weight loss was defined as a decrease in weight of ≥ 0.1 kg. Patient responses to treatment were assessed by the American College of Rheumatology 20 response criteria (ACR20).
We evaluated levels of adiponectin, leptin, and resistin before and 24 weeks after treatment by using a Magnetic Luminex Multiplex Assay kit (R&D Systems, Inc., Minneapolis, MN, USA) in serum samples from patients in Cohorts I (methotrexate-treated) and III (tocilizumab-treated); serum samples from the patients in Cohort II were not available. We compared pre- and post-treatment body weight and adipokine levels in Cohorts I and III, and analyzed correlations between the adipokine levels and changes in body weight.
Statistical analyses
Data distribution was assessed by Kolmogorov-Smirnov tests. Continuous variables are presented as the mean and standard deviation (SD) when they accept normality, and as median with 25th and 75th percentiles when they reject normality. Proportions are presented as numbers with percentages. The independent t-test or Mann-Whitney test was used to compare the two groups depending on the distribution of the data. Paired comparison was undertaken by the paired t-test or Wilcoxon test, as appropriate. Changes in body weight and adipokine levels from baseline are expressed as mean or median differences with 95% confidence intervals (CIs). The correlation of continuous variables was analyzed by Pearson's or Spearman's correlation coefficient, as appropriate.
Statistical analyses were undertaken in MedCalc Statistical Software, version 18.6 (MedCalc Software bvba, Ostend, Belgium). The graphs were plotted using GraphPad Prism software, version 7.00 for Windows (GraphPad Software, La Jolla, CA, USA). The temporal trends in body weight were examined using the Joinpoint Regression Program, Desktop version 4.7.0.0 (National Cancer Institute; Bethesda, Maryland, USA; http://surveillance.cancer.gov/joinpoint/),32 which uses the Bayesian information criterion to generate different numbers of joinpoints that indicate time points at which the rate of occurrence of, or the hazard associated with, an event changes significantly, and it fits separate linear trends in each time segment. For all statistical tests, a value of P < 0.05 was considered statistically significant.
RESULTS
Demographic characteristics and clinical variables
Table 1 summarizes the participants' demographic characteristics and clinical variables.
Table 1
Baseline demographic data and clinical parameters in the patients in the 3 study cohorts
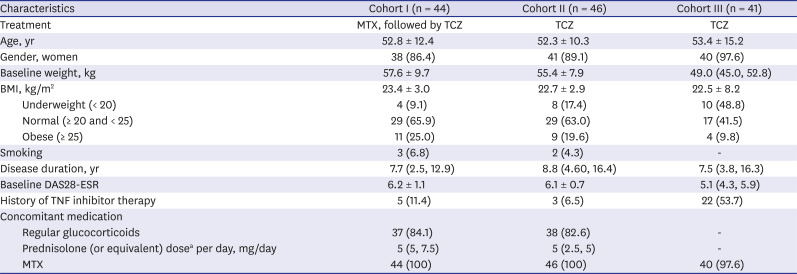
Data are presented as mean ± standard deviation or median (25th and 75th percentiles), as appropriate. Proportion was presented as number (%).
MTX = methotrexate, TCZ = tocilizumab, BMI = body mass index, DAS28 = disease activity score in 28 joints, ESR = erythrocyte sedimentation rate, RA = rheumatoid arthritis, TNF = tumor necrosis factor.
aAmong the patients who used glucocorticoids regularly.
Weight changes between baseline and 24th week
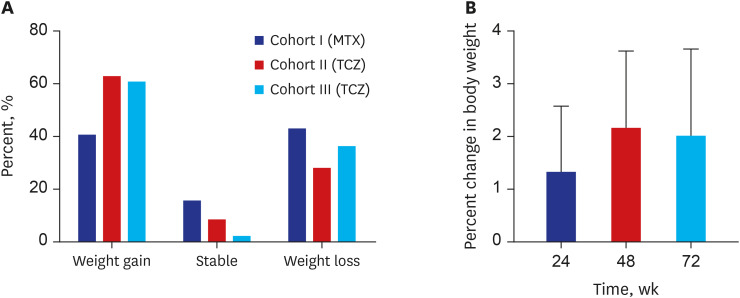
Table 2 summarizes the mean weight changes during 24 weeks of treatment in three cohorts. There was no significant weight change in Cohort I, whereas mean weight gain of 0.9 kg (95% CI, 0.2–1.5 kg) was observed in Cohorts II+III (P = 0.010). Fig. 2A compares the percentages of patients who gained or lost weight after 24 weeks of treatment in the 3 cohorts. In Cohort I, 40.9% (18/44) of patients gained weight, 15.9% (7/44) of patients maintained their weight, and 43.2% (19/44) of patients lost weight. In Cohorts II and III, 63.0% (29/46) and 61.0% (25/41) gained weight and 28.3% (13/46) and 36.6% (15/41) lost weight, respectively.
Table 2
Weight changes during 24 weeks of treatment in three cohorts
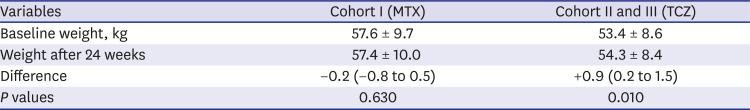
Fig. 2
Weight changes in the study's cohorts. (A) Percentage of patients whose weights changed after 24 weeks of treatment in the 3 cohorts. In cohort I, 40.9% of the patients gained weight, 15.9% of the patients' weights remained stable, and 43.2% of the patients lost weight following methotrexate treatment. In cohort II, 63.0% of the patients gained weight and 28.3% of the patients lost weight following tocilizumab treatment. In cohort III, 61.0% of the patients gained weight and 36.6% of the patients lost weight following tocilizumab treatment. (B) Overall percent changes in body weight in cohort II after 24, 48, and 72 weeks of tocilizumab treatment compared with baseline. The mean (95% confidence interval) percent changes in body weight were 1.3% (0.1%–2.6%) at 24 weeks, 2.2% (0.7%–3.6%) at 48 weeks, and 2.0% (0.4%–3.7%) at 72 weeks.
MTX = methotrexate, TCZ = tocilizumab.
The weight difference before and after the 24-week treatment period did not differ between EULAR responders and non-responders in Cohort I (P = 0.747) and Cohorts II+III (P = 0.373, independent t-test). Furthermore, there was no significant difference in the proportion of weight gained between EULAR responders and non-responders, both in Cohort I (P = 0.319, Fisher exact test) and Cohorts II+III (P = 0.108, χ2 test) (Table 3).
Table 3
Subgroup analysis of weight changes according to the treatment response

In Cohort I, there was no linear correlation between baseline BMI and weight changes (r = 0.135, P = 0.384), although there was a weakly negative correlation in the combined analysis of Cohorts II and III (r = −0.278, P = 0.010). There was no significant difference in the proportion of weight gained between those who were underweight and overweight at baseline in Cohort I (P = 0. 812) or in Cohort II+III (P = 0.089) (Table 4).
Table 4
Subgroup analysis of weight changes according to the baseline BMI

Serial weight changes for 72 weeks
In Cohort II, mean changes in patient body weight after 24, 48, and 72 weeks of tocilizumab treatment were +0.7 kg (95% CI, 0.0–1.4 kg), +1.2 kg (95% CI, 0.4–2.0 kg), and +1.1 kg (95% CI, 0.2–2.0 kg), respectively, compared with their weight at baseline. In addition, we investigated the overall percent changes in body weight in Cohort II after 24, 48, and 72 weeks of tocilizumab treatment compared with that at the baseline (Fig. 2B). The mean percent changes in the patient body weight from baseline were +1.3% (0.1%–2.6%) at 24 weeks, +2.2% (0.7%–3.6%) at 48 weeks, and +2.0% (0.4%–3.7%) at 72 weeks.
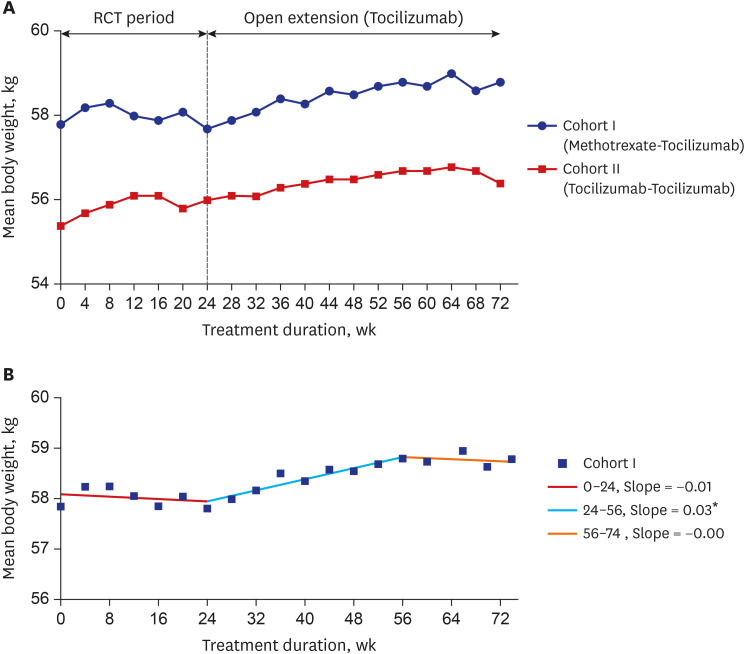
We analyzed the patients' serial weight changes during the initial 24-week treatment period as well as during subsequent treatment with tocilizumab for 48 weeks in Cohorts I and II (Fig. 3A). Patients in Cohort I who received methotrexate only during the initial 24-week treatment period followed by tocilizumab treatment for 48 weeks during the open extension phase of the clinical trial, showed significant weight gain during tocilizumab treatment (mean difference between week 24 and week 72: +1.1 kg; 95% CI, 0.4–1.7 kg; P = 0.004). Joinpoint regression analysis of Cohort I showed that the mean body weight started to increase at 24 weeks and plateaued at 56 weeks, thereby creating a significant joinpoint at the 24th week and 56th week (Fig. 3B).
Fig. 3
Patients' body weight changes during treatment. (A) Weight changes in cohorts I and II over 72 weeks. Body weight was assessed every 4 weeks in the 2 cohorts. (B) Joinpoint regression analysis of Cohort I showed that the mean body weight started to increase at 24 weeks when tocilizumab treatment was introduced, and it plateaued at 56 weeks, creating a significant joinpoint at weeks 24 and 56. *Indicates that the slope is significantly different from zero at the alpha = 0.05 level.
Serum adipokine levels
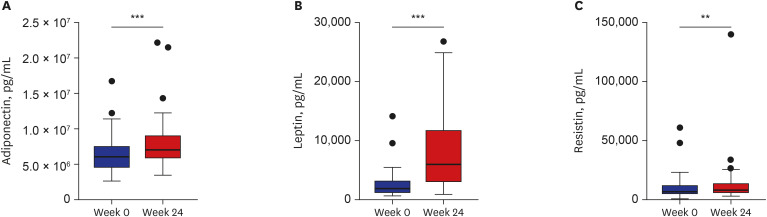
Levels of adiponectin, leptin, and resistin in serum samples from patients in Cohort I did not change after methotrexate treatment (adiponectin, P = 0.081; leptin, P = 0.682; and resistin, P = 0.070) (Fig. 4), whereas these levels increased significantly in Cohort III following tocilizumab treatment (adiponectin, P < 0.001; leptin, P < 0.001; and resistin, P < 0.01), with median differences of +1,257.2 ng/mL (95% CI, 801.8–1,753.5 ng/mL) for adiponectin, +3,890.0 pg/mL (95% CI, 2,709.7–6,076.1 pg/mL) for leptin, and +826.5 pg/mL (95% CI, 268.7–1,544.1 pg/mL) for resistin (Fig. 5). After tocilizumab treatment, the leptin-adiponectin ratio increased significantly (P = 0.015) with a median difference of +2.1 pg/ng (95% CI, 0.42–2.97 pg/ng). The leptin–adiponectin ratio did not increase significantly (P = 0.918) following methotrexate treatment (median difference, +0.1 ng/μg; 95% CI, −0.2 to 0.2 ng/μg).
Fig. 4
Serum adipokine levels after methotrexate treatment. Levels of (A) adiponectin, (B) leptin, and (C) resistin at baseline (0 weeks) and after 24 weeks of methotrexate treatment (cohort I). The serum adiponectin, leptin, and resistin levels did not change significantly (P = 0.081 for adiponectin, P = 0.682 for leptin, and P = 0.070 for resistin). The data presented are the medians with their 25th and 75th percentiles.
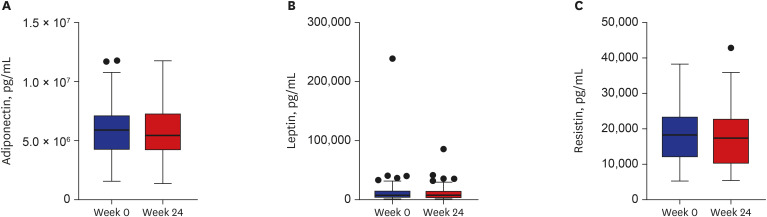
Fig. 5
Serum adipokine levels after tocilizumab treatment. Serum levels of (A) adiponectin, (B) leptin, and (C) resistin at baseline (0 weeks) and after 24 weeks of tocilizumab treatment (cohort III). The serum adiponectin, leptin, and resistin levels increased significantly (**P < 0.01; ***P < 0.001). The data presented are the medians with their 25th and 75th percentiles.
The change in adipokine concentration did not showed the correlation with the weight change in adiponectin (rho = −0.014, P = 0.923 and rho = −0.040, P = 0.803), leptin (rho = −0.282, P = 0.052 and rho = −0.284, P = 0.069) and resistin (rho = −0.121, P = 0.411 and rho = −0.107, P = 0.501) in both Cohorts I and III, respectively. In addition, in the pooled analysis of Cohorts I and III, levels of serum adiponectin, leptin, and resistin not differ between the patients who gained weight (n = 43) and those who lost weight (n = 34) (adiponectin, P = 0.308; leptin, P = 0.321; and resistin, P = 0.170).
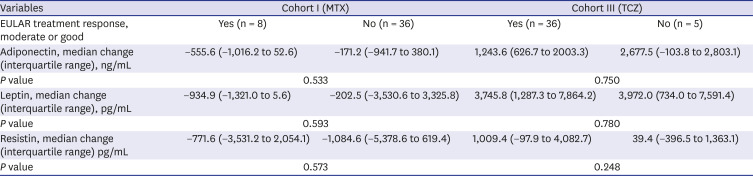
Regarding disease activity (DAS28ESR) and adipokine concentrations at baseline in pooled cohort of I and III (n = 85), adiponectin (correlation coefficient r = −0.183, P = 0.094) or leptin (r = 0.074, P = 0.500) concentration did not show a specific correlation with DAS28ESR, but a correlation was observed in resistin concentration (r = 0.278, P = 0.010). In the subgroup analysis based on treatment response, the difference of adipokine concentrations between the EULAR responder and the non-responder was not significant in both Cohorts I and III (Table 5).
Table 5
Subgroup analysis of adipokine changes according to the treatment response
DISCUSSION
In this study, we investigated changes in body weight and the adipokine levels in patients with active RA who were or were not treated with tocilizumab; tocilizumab inhibits the binding of IL-6 to its receptor. The patients' body weights increased after tocilizumab therapy, even among the non-responders, but no weight gains were observed among the patients who were treated with methotrexate. Therefore, weight gain appeared to be a drug-specific effect. As weight gain after treatment with TNF-alpha inhibitors has not been related to the therapeutic response,33 and weight gain after tocilizumab treatment did not appear to be associated with the therapeutic response in this study.
When we looked at the relationship between disease activity and adipokine concentrations at baseline, resistin concentration showed the positive correlation with DAS28ESR in pooled cohort of I and III. However, there was no significant decrease in resistin concentrations even when disease activity declined after tocilizumab therapy. Adipokine levels are affected by several individual characteristics of patients, such as body weight, fat mass, and insulin resistance, as well as RA. Therefore, we investigated the paired data to correct the individual characteristics of the patients that could act as a confounder, and analyzed the correlation of adipokines with EULAR response.
Obesity and rheumatoid cachexia have been associated with RA.6 However, the metabolic profile observed in patients with RA does not reflect what has been previously observed in the general population. A lipid paradox has been described, wherein low cholesterol and LDL cholesterol levels in patients with RA are associated with increased CV risks.3435 In addition, a low BMI has been associated with accelerated mortality in patients with RA, namely, the obesity paradox. Weight loss is a strong predictor of death in patients with RA, because RA cachexia rather than obesity has been associated with increased CV mortality in RA.3637 Therefore, it is probable that the weight gain observed after tocilizumab therapy is an additional beneficial effect in RA patients.
In this regard, adipokine profiles of RA patients differ from the general population in non-inflammatory conditions. Adiponectin is a protein produced by the adipose tissue. In general, low adiponectin levels have been associated with obesity, type 2 diabetes, and atherosclerosis and the role of adiponectin in the metabolic syndrome is clearly anti-inflammatory.132738 On the other hand, serum adiponectin concentrations are higher among patients with RA compared with those in healthy individuals, and were associated with increased radiographic damage and low amount of visceral fat.333940 Data on the effects of anti-TNF treatments on adiponectin levels are conflicting, for which the reasons are yet to be explained and might include differences by demographics or ethnicities of patients in those studies.17414243.
Leptin is produced in the adipose tissue, and it is a product of the OB gene.44 Moreover, leptin is a major determinant of obesity and is associated with the development of obesity or CV disease in RA.273345 Leptin is generally higher in patients with RA than in patients with degenerative arthritis and healthy individuals,4647 and high leptin levels are associated with high RA activity and more aggressive disease course.4849 Thus, leptin might be involved in the RA-related atherosclerosis. Date regarding the effects of anti-TNF treatments on leptin levels are also conflicting,4142 and does not seems to directly modulate leptin levels.27 Resistin was initially implicated in the development of insulin resistance. Although resistin concentrations do not differ between healthy individuals and patients with RA, resistin levels correlated positively with C-reactive protein levels, suggesting a pro-inflammatory role.3347 There is minimal information exists on the vascular effects of resistin and its relationship to CV risk in RA.
Recently, increased adiponectin levels, but not leptin or resistin levels, have been described after tocilizumab therapy,50 although differences in body weight after the administration of tocilizumab were unclear. The study did not limit the use of other RA medications, including steroids; therefore, any changes in weight or the adipokine levels may have been caused by dose reductions of other medications following a good response to tocilizumab therapy. In addition, the study involved European participants, and there may be ethnic differences in Asian populations.
In this study, the serum adiponectin, leptin, and resistin levels increased after tocilizumab treatment, although they did not increase after methotrexate treatment. The leptin–adiponectin ratio, which is an insulin-resistance proxy,2829 increased after tocilizumab therapy in our study, which led to concerns that CV disease risk factors, including insulin resistance, may deteriorate as the body weight increases following tocilizumab treatment. As with the interpretation of weight gain, the interpretation of the adipokine change should be interpreted differently in patients with RA to general population. The leptin–adiponectin ratio is known to decrease in highly active, therapy-resistant RA and to increase in early or obese RA.6 Therefore, the increase in leptin–adiponectin ratio may reflect a positive situation as opposed to RA cachexia. These findings disagree with findings from a recent study that showed that the use of tocilizumab contributed to a reduction in the leptin–adiponectin ratio in patients with RA in whom TNF inhibitors had failed compared with that in patients who switched to other TNF inhibitors.51 While the patients in that study had already failed to respond to TNF inhibitor treatment, and the investigators compared the effects of tocilizumab and other TNF inhibitors after switching, only half of the patients in our study were exposed to the effects of a TNF inhibitor; therefore, the study populations appear to differ.
As the changes in the adipokine levels did not differ between the patients who lost or gained weight, we could not attribute the weight gain observed after tocilizumab therapy to increases in the adipokine levels. Indeed, the number of patients was too small to detect statistical differences between subgroups and this is a major limitation of this study. In addition, we do not have information on diet peculiarities and physical activity of participants during the tocilizumab treatment periods, which is another important limitation. Lastly, information on comorbidities such as dyslipidemia, hypertension, and diabetes, which may affect adipokine levels, was not available. To correct individual characteristics of patients that can act as confounders, we used paired data and analyzed the association between changes in disease activity and changes in adipokine concentrations.
As far as we know, this is the first study to investigate the long-term effects of tocilizumab treatment on body weight among patients with RA. In Cohorts I and II, patients received fixed doses of glucocorticoids and methotrexate, and changes in their body weights were evaluated every 4 weeks, which minimized the risk of influencing weight changes as the steroid doses were reduced in good responders. We could also observe the increases in body weight immediately after the initiation of tocilizumab treatment in Cohort I. In Cohort III, we could observe the change of on body weight in real practice setting, such as adjusted dose of glucocorticoid glucocorticoids and methotrexate if they shows satisfactory response to the tocilizumab treatment. The results of this study, such as the proportion of patients who gained weight in each subgroup, the scale of weight gain, and lack of correlation to treatment effects, could provide the basis to explain drug characteristics to patients when selecting subsequent therapy.
In conclusion, a statistically significant weight gain occurred among the patients with RA after tocilizumab treatment, which was sustained over the 72-week treatment period. As the tendency to gain weight was not related to the therapeutic response, the changes may have been a feature of IL-6 inhibition itself. Further studies are required to determine the effects of this weight gain on CV outcomes.
 XML Download