

 PDF
PDF Citation
 Print
Print


INTRODUCTION
While health inequalities according to social factors have persisted globally,1 an increasing number of studies have argued that health inequalities are embedded in macro-level contexts, such as governmental policies. In this regard, many studies have examined differences in health inequality across European countries.23 However, there is a paucity of research that encompasses Korea (hereafter, Korea) in this global landscape. The very few comparative studies involving Korea adopted a cross-sectional approach,45 rather than utilizing more advanced methods such as longitudinal data analysis.
Against this backdrop, this study aimed to compare inequalities in the longitudinal trajectory of health measured by latent growth curves (LGCs) in Korea and other developed countries. Considering that comparisons of LGCs can be exceedingly complex, prior studies generally selected a few exemplary countries for comparisons based on theories regarding governmental policies.67 This study drew upon the seminal theory of Esping-Andersen8 and Ferrera9 on Europe, and Holliday on East Asia,10 taking into consideration the countries actually chosen in the various studies on the typology of welfare states11 and core literature with similar research questions and designs.612 This resulted in the selection of Sweden, Denmark, Germany, France, Spain, and Italy as focal nations of comparison with Korea. Based on the classification proposed by Esping-Andersen8 and Ferrera,9 Sweden and Denmark are a prototype of the social democratic welfare state, with a generous welfare system anchored upon the principles of universalism, full employment, and redistribution. Germany and France are categorized as an example of the conservative type, as welfare benefits are earnings-based, and work towards reproducing existing social stratification. The role of the family is particularly important. Spain and Italy are classified as Southern European type, which are known for a corporatist income maintenance system with a mixture of high generosity for some groups and low security for others, with universal healthcare arrangements.
Korea is considered an East Asian (also called as productivist or Confucian) welfare state.10 It has residual welfare arrangements with the least level of government intervention, as economic growth is deemed more important than considerations such as redistribution. Income maintenance is strictly subject to means testing. These seven countries belong to the group with very high human development and have similar levels of life expectancy at birth, with Human Development Index (HDI) scores ranging from 0.926 (Germany) to 0.884 (Spain), and life expectancies ranging from 83.3 years (Italy) to 80.4 years (Denmark).13 Meanwhile, these societies have been reported to demonstrate health disparities according to various social factors,214 meaning that there is a reasonable degree of variation in terms of health status within each nation. Along with differences in state-level policies, these basic similarities provide a good grounding for comparative research. Among the theoretical approaches of comparative studies, this is a type of ‘variation-finding,’ where cases with basic similarities (e.g., life expectancy) are selected, while core differences with regard to the main research question (e.g., governmental policies) remain.15
With regard to the associations between governmental characteristics and health, it would be logical to expect that Sweden and Denmark, as the most egalitarian, would demonstrate the lowest health inequalities. However, the results are mixed. The absolute levels of health equity are smallest in Scandinavian countries, but relative differences are not necessarily the lowest.23 The differences in relative (e.g., risk ratio) vs. absolute (e.g., risk differences) magnitudes of health inequalities have made it harder to reach a consensus on the effects of governmental characteristics on health inequalities. Interestingly, studies have estimated that health inequalities in Germany are lower than in Scandinavian countries, in contrast to the usual expectation. One study illustrated that, among Britain, Germany, Denmark, and the US, the health gap was the largest in the US, as expected, while the country with the lowest health gap was Germany, followed by Britain and Denmark.6 Although no studies have directly compared Korea to Europe, some studies have concluded that Korea's health inequalities are larger than those of Western societies,16 whereas others have reported otherwise.5 Compared to permanent workers, precarious workers in Korea are less healthy in terms of physical/mental health such as musculoskeletal diseases and depressive symptoms, whereas this is not the case for the Scandinavian countries.16 Nonetheless, Korea has lower inequalities in terms of age-standardized cancer and cardiovascular disease than nations such as the UK.5
The objectives of this study were: 1) to examine the effects of socioeconomic status on the health trajectory of middle-aged and older adults in Sweden, Denmark, Germany, France, Spain, Italy, and Korea; and 2) to explore which country has the lowest level of health inequality in these trajectories.
Go to : 
METHODS
Data
Two nationally representative and publicly available longitudinal datasets were used: the Survey of Health, Aging and Retirement in Europe (SHARE) and the Korean Longitudinal Study of Aging (KLoSA).1718 SHARE covers people aged 50 and above across 20 European countries since 2004, while KLoSA is based on interviews of those aged 45 and older since 2006. For the analyses of this study, middle-aged and older adults (aged 50 and above) who participated in the initial wave (2006/2007) and had at least one set of valid answers on self-reported health (SRH) during the 2006/2007–2014/2015 period (five waves) were selected. Therefore, 2,761 Swedish, 2,546 Danish, 2,580 German, 2,860 French, 2,372 Spanish, and 2,924 Italian respondents from 2007 onwards were included, as well as 8,465 Korean participants from 2006 onwards (Table 1). The average panel retention rate from the starting (2006/2007) to the ending wave (2014/2015) ranges from 112.4% in Sweden to 80.6% in France,19 and 82.2% in Korea.20 To maximize the available cases, the full numbers were utilized for the unconditional models, and listwise deletion was applied for the conditional models.
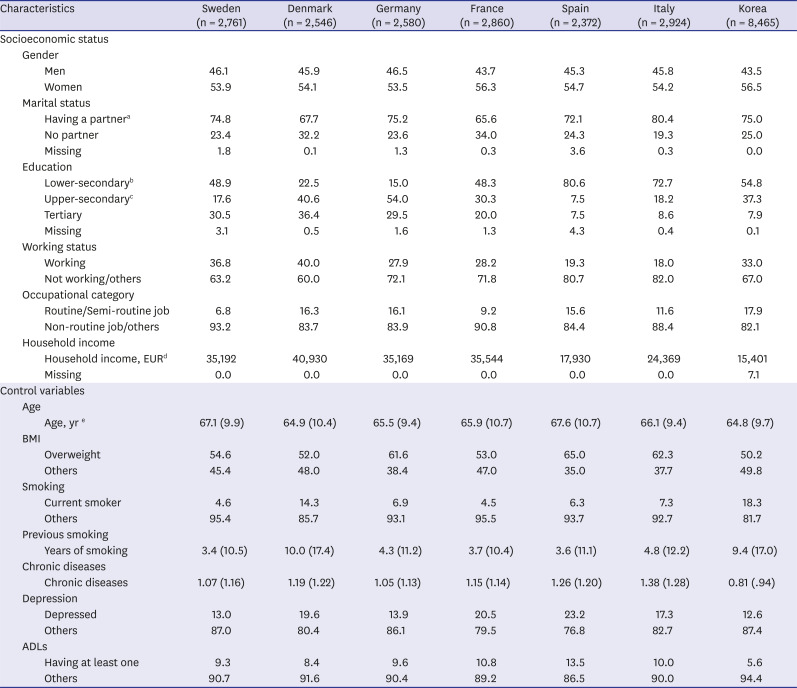
Table 1
Characteristics of respondents and distribution of covariates
Data are presented as mean (standard deviation) or percentage (%).
BMI = body mass index, ADL = activities of daily living.
a“Married and living together with spouse” or “Registered partnership”; bElementary in Korea; cSecondary in Korea; dMultiple imputation implemented. The five different standard errors are not included in the table (available upon request). Values in Korean won were converted to euros at the average exchange rate in 2006; eIn 2007 in Europe; 2006 in Korea.
![]()
Table 1 presents the characteristics of study subjects and the distribution of covariates. The average age and the proportion of men and women respondents were similar across countries. A smaller proportion of French and Danish middle-aged and older adults had partners than those in other countries. Generally, average social factors, such as education and income, were higher in Sweden, Denmark, Germany, and France than Spain, Italy, and Korea.
Dependent variable for LGCs: self-rated health
The dependent variable was SRH, which is a widely-used health outcome, as it is associated with all-cause mortality and morbidity, and captures a person's health condition in the most holistic manner.2122 As a succinct and reliable summary measure of health, SRH is one of the most frequently utilized health variables for cross-national comparisons.67 A 5-point SRH question (“Would you say your health is...”) with categories of “excellent” (= 5), “very good” (= 4), “good” (= 3), “fair” (= 2), and “poor” (= 1) was used for Denmark and Germany, whereas the wording in Korea was “very good” (= 5), “rather good” (= 4), “neutral” (= 3), “rather bad” (= 2), and “very bad” (= 1). SRH was repeatedly measured from 2006/2007 to 2014/2015 and its LGC was fitted for each country. For comparison purposes, standardized scores (mean = 0; standard variation = 1) were created for each country.
Social factors
Woman gender was coded as 1, whereas man gender was coded as 0. As for marital status, those who had a lawful or a registered partner were coded as 1, while the unmarried, separated, divorced, and widowed were coded as 0.
Education was categorized as lower-secondary, upper-secondary, and tertiary in Europe. In Korea, it consisted of elementary, secondary, and tertiary education. The lower-secondary (Europe) and elementary (Korea) groups referred to no formal education or levels 0–2 in the 1997 International Standard Classification of Education (ISCED-97), the upper-secondary (Europe) and secondary (Korea) groups referred to level 3 in the ISCED-97, and the tertiary groups referred to levels 4–6 in ISCED-97.67
Working status was coded as 1 for those who were working in the initial wave and 0 who were not working and others. According to previous studies,67 occupational class (in 2006/2007 or most recently) was sorted into two clusters: routine/semi-routine jobs (= 1) for plant and machine operators, assemblers, and elementary occupations; and other jobs (= 0) for legislators, senior officials, and managers; professionals, technicians, and associate professionals; clerks; service workers and shop and market sales workers; skilled agricultural and fishery workers; craft and related trades workers; and others. This is known to be the most comparable classification across countries, and the classification using these two types captures usually vulnerable labor conditions, such as non-standard work, short employment, and limited discretion, under the category of routine/semi-routine jobs.67
Household income was defined as the total household gross income during the previous year of the initial waves. We used the five sets of multiply imputed values calculated by the SHARE and KLoSA teams2728 and log-transformed them. The average exchange rate in 2006 when the survey was conducted was used to convert Korean won to euros.
Control variables
Based on the relevant literature,23671223242526293031 and with due consideration of the availability and comparability of the SHARE and KLoSA datasets, several control variables were entered. Age was mean-centered; the centered age was calculated by subtracting the respective national mean age from each individual's original age in 2006/2007. Body mass index (BMI; kg/m2) was dichotomized as 1 for individuals who were overweight or more and 0 for others. According to the respective guidelines of the SHARE and KLoSA teams, the BMI thresholds were > 25 kg/m2 in Europe, and > 23 kg/m2 in Korea.3233 When the threshold was changed to > 25 kg/m2 in Korea, the results were unchanged (data not shown).
Current smokers as of 2006/2007 were coded as 1 (0 = otherwise). Previous smoking was included by calculating total years of smoking. In addition, we included the number of the following eight chronic diseases that each respondent had (0–8 points): heart attack, high blood pressure or hypertension, high blood cholesterol, stroke, diabetes or high blood sugar, chronic lung disease or asthma, arthritis, and/or cancer. Those who felt depressed or had taken an anti-depressant during the last 2 weeks were coded as 1 (depressed; 0 = otherwise). Those who had difficulty with at least one of six comparable activities of daily living (ADLs) (dressing, walking/getting in or out of bed, bathing, showering, eating, and using the toilet) were coded as 1 for the ADLs (0 = otherwise).
Statistical analysis
Separate unconditional and conditional LGCs were fitted for each country, with standardized SRH as the dependent variable, and the social factors and control variables as the independent variables. LGCs are an analytical strategy in the key literature for the investigation of longitudinal health trajectories.67 An LGC consists of two components: intercept and slope. The intercept refers to the initial value that an individual has at the starting point of the study. The slope indicates whether and how steeply that initial value rises or declines as time passes.
The unconditional model is (notation style follows Sacker et al.6):
where yjt is the observed value of latent SRH for the jth person at the tth time point; αIj and αSj are the intercept and slope for the jth person, respectively; tjt is the score for time for the jth person at the tth time point; and αIj and αSj consist of the mean values (αI0 and αS0) and individual random elements (uIj and uSj) for the jth person. That is, in an LGC analysis, each individual has an LGC with its own intercept and slope. Some may have the best level of health at the baseline, with the highest value of the intercept, and later exhibit worsened health with a steep negative slope. Others may begin their starting point moderately (i.e., around the national average), but later sustain their initial level of health with a very gradual slope.
The conditional model is:
where the same definitions in equations (1)-(3) are applied; αIj and αSj are composed of the aforementioned 14 independent variables, as well as the mean values (αI0 and αS0) and individual random elements (uIj and uSj) for the jth person. This model allows us to see whether people's health trajectories, with individual intercepts and slopes, vary according to covariates of interest. For example, those who live with a spouse may show a relatively higher initial value of the intercept and a flat slope, meaning that they have a more advantaged start and little deterioration over time. In contrast, those who have a lower level of education may begin their trajectory with a lower intercept and a steeper slope, corresponding to a more disadvantaged beginning and a faster deterioration.
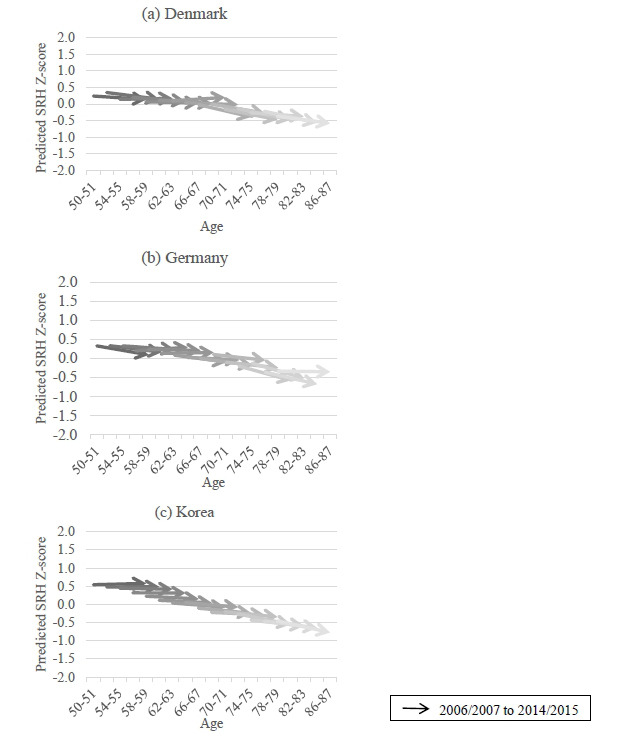
Mplus (ver. 8) was used for the analyses, with full-information maximum likelihood (FIML) as the main estimation method. This estimator is known to be highly effective at utilizing available observations in cases of missing data or attrition in panel datasets.72426 This method enabled the inclusion of respondents who replied at least once for the outcome variable. The aging vector graph approach was used to present growth patterns.634 This method is widely adopted in latent growth model analyses to illustrate long-term trends in outcome variables with relatively short panel surveys. Using a relatively short panel (e.g., less than 10 years) helps reduce panel data-related errors, such as selection bias. However, doing so makes it less feasible to generate a more prolonged trajectory (e.g., a few decades). Hence, it is recommended to draw the estimated trajectories of a variety of age groups on a single chart, with age as the x-axis. The combined trajectories provide a composite image of overall trends throughout a broader life-course within a society.
In the analysis, unconditional models of each country were fitted first. The average initial values and changes of LGCs in each country were compared in terms of the whole sample (Table 2) and subgroups by gender (Table 3). Next, conditional models were fitted for each country. Social effects on the initial values and changes in the LGCs were studied by interpreting the statistical significance, direction, and magnitude of the beta coefficients (Table 4). The impact of gender and marital status on the initial values and slopes was first compared across countries, followed by a comparison of the effects of education, working status, occupational category, and household income. Subsequently, a more intuitive picture of the health trajectory of each country was examined by comparing the aging vector graphs of the socially advantaged and the socially disadvantaged (Fig. 1).
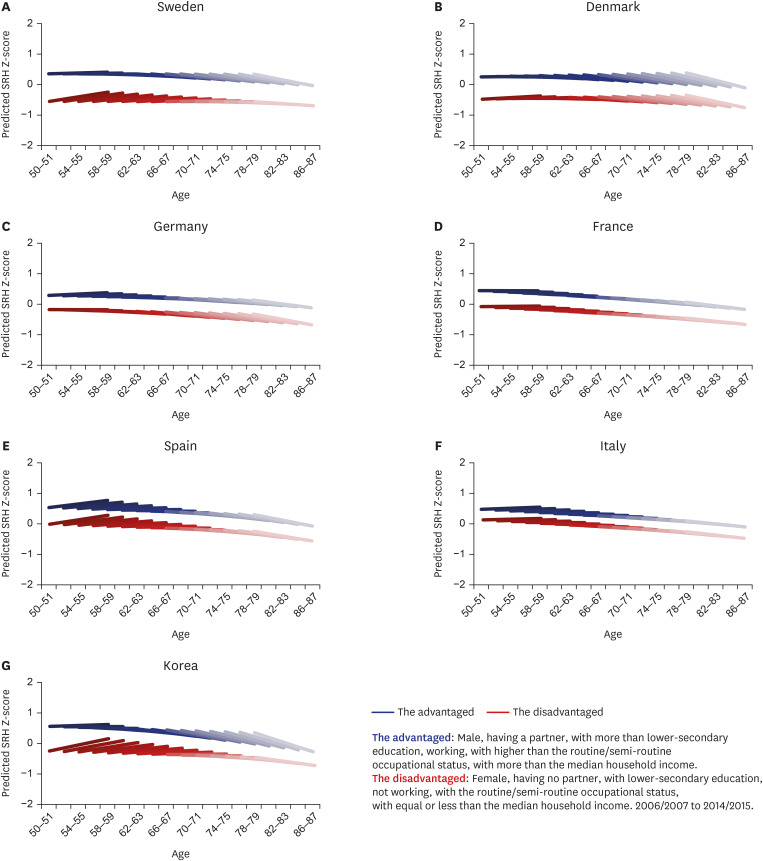 | Fig. 1Aging vector graphs of the socially advantaged and the socially disadvantaged.SRH = self-reported health.
|
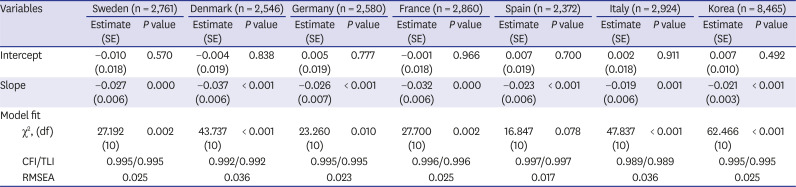
Table 2
Unconditional growth curve modela
SE = standard error, df = degrees of freedom, CFI = confirmatory fit index, TLI = Tucker-Lewis index, RMSEA = root square error of approximation.
aDependent variable: standardized self-rated health.
![]()
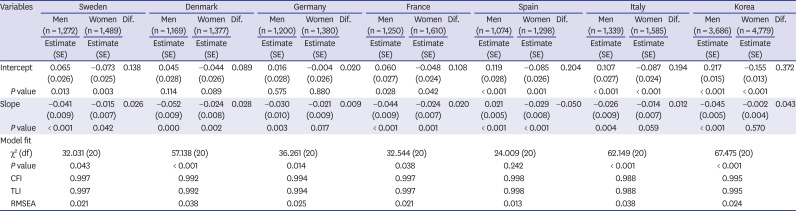
Table 3
Unconditional growth curve model by gendera
SE = standard error, df = degrees of freedom, CFI = confirmatory fit index, TLI = Tucker-Lewis index, RMSEA = root square error of approximation, Dif. = difference.
aDependent variable: standardized self-rated health.
![]()
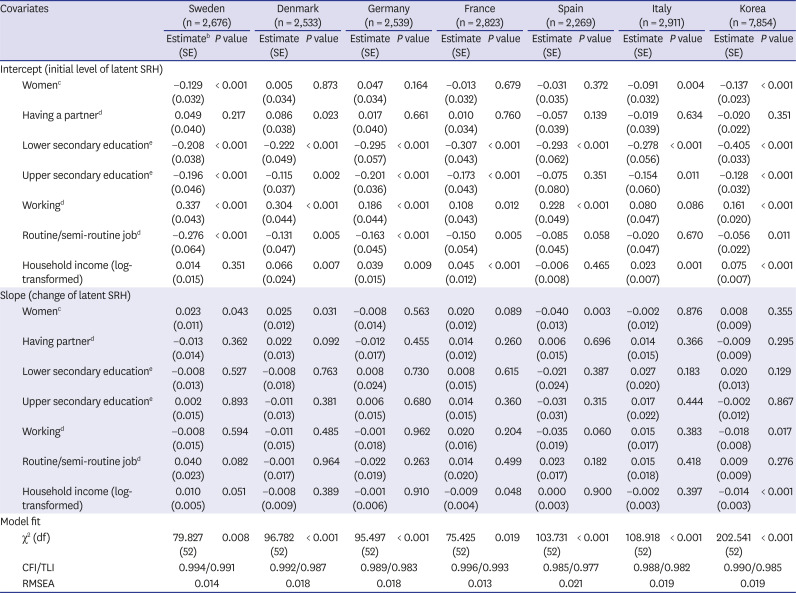
Table 4
Conditional growth curve modela
Age, BMI, current smoking, previous smoking, number of chronic diseases, depression, and ADLs were controlled.
SE = standard error, SRH = self-reported health, df = degrees of freedom, CFI = confirmatory fit index, TLI = Tucker-Lewis index, RMSEA = root square error of approximation, BMI = body mass index, ADL = activities of daily living.
aDependent variable: standardized self-rated health; bUnstandardized beta; cReference: men; dReference: others; eReference: tertiary education.
![]()
Ethics statement
This article does not contain data from any studies with human participants performed by any of the authors.
Go to :
RESULTS
The unconditional model showed that the starting point of the LGCs was around zero (national average), with slightly declining slopes (worsening SRH as one ages) ranging from −0.037 (Denmark) to −0.019 (Italy) (Table 2). This suggested a generally similar pattern of LGCs across the seven countries. A subgroup analysis by gender revealed that the starting point of the LGCs were lower among women than men, though the slopes were steeper among men than women except for Spain (Table 3). The difference in initial SRH between men and women was largest in Korea (0.372), followed by Spain (0.204) and Italy (0.194). The difference in terms of slope was also highest in Korea (0.043) and lowest in Spain (−0.050).
The conditional LGCs with social factors were fitted (confirmatory fit index [CFI]/Tucker-Lewis index [TLI] = 0.994/0.991, root mean square error of approximation [RMSEA] = 0.014 in Sweden; CFI/TLI = 0.992/0.987, RMSEA = 0.018 in Denmark; CFI/TLI = 0.989/0.983, RMSEA = 0.018 in Germany; CFI/TLI = 0.996/0.993, RMSEA = 0.013 in France; CFI/TLI = 0.985/0.977, RMSEA = 0.021 in Spain; CFI/TLI = 0.988/0.982, RMSEA = 0.019 in Italy; CFI/TLI = 0.990/0.985, RMSEA = 0.019 in Korea) (Table 4). As values of more than 0.95 for the CFI and TLI and less than 0.06 for RMSEA were used as thresholds, the goodness-of-fit of the models in this study was deemed excellent.35
According to these results, gender yielded dissimilar effects across countries, controlling for other factors. Women had lower SRH than men in Italy (−0.091, P = 0.004) and Korea (−0.137, P < 0.001), and faster worsening in Spain (−0.040, P = 0.003). Swedish older women also showed lower SRH (−0.129, P < 0.001), mixed with slightly slower decline (0.023, P = 0.043). In contrast, Danish women demonstrated more slowly deteriorating SRH (0.025, P = 0.031). Having partner was related to better initial health in Denmark (0.086, P = 0.023).
Controlling for other variables, most of the social factors (i.e., tertiary education, current working status, more prestigious occupational positions than semi-routine/routine ones, higher household income) were associated with higher initial SRH in Sweden, Denmark, Germany, France, and Korea except for the income in Sweden. However, these factors were less influential in Spain and Italy, with only two (lower-secondary education and working status) and three (lower-secondary, upper-secondary, and income) significant variables found in Spain and Italy, respectively.
The effects of lower-secondary education as compared with tertiary education were largest in Korea (−0.408, P < 0.001), and smallest in Sweden (−0.208, P < 0.001). The effects of upper-secondary as opposed to tertiary education were largest in Germany (−0.201, P < 0.001), and smallest in Denmark (−0.115, P = 0.003), although the effect sizes were generally smaller than those for lower secondary in contrast to tertiary education. Compared with non-working status, working status yielded effect sizes from 0.337 in Sweden (P < 0.001) and 0.304 in Denmark (P < 0.001), to 0.108 in France (P = 0.012). Compared with more privileged jobs, having a routine/semi-routine job had coefficients from -0.276 in Sweden (P < 0.001) and −0.056 in Korea (0.011). The effect of log-transformed household income were from 0.075 in Korea (P < 0.001) to 0.023 in Italy (P = 0.001). However, the effects of these social factors on LGC slopes were limited: Only currently working (−0.018, P = 0.017) and higher-income groups in Korea (−0.014, P < 0.001) and in France (−0.009, P = 0.048) were estimated to undergo sharper declines.
A graphical presentation comparing socially advantaged and disadvantaged illustrated that the difference in trajectory between advantaged and disadvantaged was largest in Sweden, closely followed by Korea and Denmark, and smallest in Italy (Fig. 1). This suggested that the SRH trajectories of those who were men, having a partner, with more than lower-secondary education, working, with higher than the routine/semi-routine occupational status, and with more than the median household income as opposed to those who were women, having no partner, with lower-secondary education, not working, with the routine/semi-routine occupational status, and with equal or less than the median household income were noticeably better in Sweden, Korea, and Denmark. This was not particularly so in Italy.
Go to :
DISCUSSION
SRH slowly declined in the unconditional LGCs among middle-aged and older adults in the six European countries and Korea. In terms of subgroup differences in unconditional models, the initial values of SRH were lower among women than men, with the largest gap found in Korea.
The major social factors of higher education, higher income, engagement in paid work, and more prestigious jobs seemed to have significant positive associations with the initial SRH values in Sweden, Denmark Germany, France, and Korea, with less numerous presence of significant variables in Spain and Italy. Overall, this result supports the universal importance of social determinants,1236 thereby suggesting there is only limited evidence that, Sweden and Denmark, as more advanced welfare states, produce less health inequality based on social factors. That the difference between advantaged and disadvantaged was largest in Sweden, whereas it was smallest in Italy, reaffirms this finding.
Until recently, studies on the welfare regime and its association with health have produced congruent3037 and incongruent63839 results. Generally, the findings of this study echoes with the incongruent ones, in which health inequalities according to socioeconomic status were not necessarily small in Scandinavian countries. This is explained that the efforts of generous welfare states can increase the average level of health in a society, without necessarily reducing the relative inequalities.40 Studies have underscored that Southern European countries, such as Spain and Italy, have a lower level of health inequality, which is often called as “Mediterranean Paradox.”3941 One hypothesis is that the stress of occupying a lower status can be higher in Northern Europe, where generous governmental support is already present, and such status can be considered as based on an individual's shortcomings. In contrast, this may not be a case in Southern Europe. Another hypothesis is that survival rates of the individuals with poor health are higher due to good policies in Northern Europe, which may lead to greater health inequalities in later life, which may not occur in Southern Europe.41
With regard to the magnitude of the estimated beta coefficients, the effect of primary versus tertiary education was particularly strong in Korea, as was working status in Sweden and Denmark. This is consonant with the crucial importance of education for health in Korea, where education functions as the most decisive factor in determining one's social class, even after considering other social factors.14 Hence, the implications for health are markedly deleterious for the older adults with the lowest levels of education in Korea. As for the importance of working in Sweden and Denmark, it can be inferred that as the labor market is segmented between working and non-working welfare-dependent groups, and as the degree of redistribution of pension is low in Sweden,4243 whether one is working or not can be critically important for the SRH of the Swedish older adults. Similarly, the active labor market policy—the “flexicurity” model that Denmark has endorsed since the early 1990s44—may have resulted in a greater importance of working per se.6 Although the policy is supposed to provide substantial financial support for unemployed or laid-off workers, as well as encourage flexible hiring and firing for enterprises in theory, it has been reported that insecurity and subsequent poor health have increased in practice.45
In a comparison of the slopes, working status and income in Korea showed a somewhat greater effect on health trajectory, with statistical significance. Although people who did not work or had lower incomes tended to be less healthy at baseline, the steepness of the decrease in their SRH showed the opposite tendency, with a larger effect size. A few studies have reported that less privileged groups demonstrated resilience, or slower deterioration.25 Convergence hypothesis46 or the ceiling effect47 of health can provide another explanation. Although Korean older adults who have a job or possess higher income can start their SRH at higher values, as time goes by, the effects may gradually disappear, thereby making their SRH to converge toward the average.
As for gender, the results showed rather unexpected results. In unconditional models, women expressed a lower SRH at baseline for all seven countries. In conditional models, Swedish, Italian and Korean older women exhibited poorer initial scores, and Spanish older women showed faster decline, whereas the converse pattern was found for their Danish counterparts. The gender health gap in Korea is not surprising, given that gender equity has not been an integral part of governmental policies in East Asian countries, not to mention that women's status in general has been among the lowest in the world.48 A similar explanation can be applied to the Spanish and Italian case: gender policies are not particularly well-developed and gender inequalities are reportedly high in Southern European countries.49 However, poorer initial SRH among Swedish older women runs counter to theoretical expectations. Some studies report the existence of a “Nordic Paradox” in which it is argued that women in Sweden are not necessarily healthy compared with men.50 It is analyzed that even though a lot of progressive gender policies are implemented in Sweden, women still have to endure gendered division of labor, less favorable working conditions, and longer time for housework, which may have resulted in relatively poorer health among Swedish women. Having considered this point, it is still inconsistent to have poorer SRH among Swedish women and better SRH among Danish women. This warrants further analysis.
Although the results for European countries were mixed in this study, the results for Korea are clearer: Korea demonstrated one of the least favorable trajectories for the socially disadvantaged as compared with the advantaged. Poorer conditions for women and the less-educated needs to be considered as well. A comparative study reported that Korea's health inequality was greater among East Asian nations.51 As the degree of health inequality in Korea relative to Europe has not been thoroughly examined, it can be a point this study can contribute to. For more exact results, further studies can be conducted regarding more specific study subjects with more detailed state policy exactly related to the subjects.5253
Lastly, social effects on the LGC slopes were not as prominent as those on the initial values. This has also been reported in most previous studies;6232526 for instance, in a previous study, covariates explained only approximately 9% of changes in health, whereas they accounted for as much as 40% of the initial degree of health.23 This suggests that baseline health is more likely to persist than to change; therefore, the initial health gaps between different social groups are also likely to continue.26
This study contributes to the characterization of longitudinal changes in health among older adults in Korea, as compared to six developed European countries. Caution is required, however, in making direct comparisons, as standardized SRH scores were used in the analyses presented in this study. The meaning of the average starting value was not directly compared. Further cross-cultural studies using more internationally interchangeable scales such as health-related quality of life (HRQOL) are warranted. The use of more rigorously constructed (e.g., through translation and back-translation in each language) survey instruments to assess HRQOL will facilitate more meaningful comparisons.
From a similar perspective, although all possible efforts were made to harmonize the two datasets, some intrinsic issues of comparative analysis remain. It is regrettable that parts of the questionnaires were not exactly identical, as well as the sample size and survey years. Should there be more synchronized datasets, further analyses involving more sophisticated harmonization would be necessary. Although the survey years were quite similar (2007 and every other year in Europe; 2006 and every 2 years in Korea), and no apparent enormous social changes took place between the two baseline years (2006 and 2007), practical difficulties may arise due to dissimilar sample size. For instance, it is easier to find statistical significance for social factors in a numerically larger group (Korea) than in a smaller group (Europe).
Furthermore, the results may have been confounded by cohort characteristics.24 Although the range of ages in this analysis is fairly wide to be deemed as a single cohort, the respondents might have shared unique historical and social experiences. For instance, lower educational attainment and under-nutrition during childhood and early adulthood were common experiences among the older Korean adults analyzed in this study, which may hamper more robust cross-cultural comparisons.
Selection bias is another concern. As the focal respondents had already reached mid-life at the time of recruitment, it is probable that left-truncation had occurred—that is, only the relatively healthy segment had survived to the point of inclusion in the survey.25 Furthermore, people with more disadvantaged social status are likely to have more missing data, and it is harder for them to continue participating in a panel for a long period.54 Although this study employed the FIML method to address this issue, the possibility remains that the negative effects of less privileged social status on health trajectories were underestimated.
Finally, more definitive conclusions might be drawn if more numerous cases were included. For example, Eastern European countries have begun to join the SHARE dataset recently, which will allow a stable longitudinal analysis in the near future.
This study aimed to examine 1) whether differences in the social factors of SRH trajectories were present among middle-aged and older adults in six European countries and Korea, 2) and which country showed the strongest patterns of equity in SRH trajectories. The unconditional patterns of SRH trajectory were similar and unfavorable for women across the countries. Social factors such as education and income generally exerted a significant impact on health trends among older adults. However, in terms of the difference between the advantaged and the disadvantaged group, and the gender gap, the results were mixed. Korea showed less favorable results for the disadvantaged than the advantaged as compared with Denmark, Germany, and France, which was consistent with theoretical expectations. In contrast, the relative SRH trajectory of the disadvantaged as against the advantaged was better as compared with Sweden and worse as compared with Spain/Italy, which was inconsistent with theories that would predict Korea's results were worse than Sweden and similar to Spain/Italy. Women had good SRH trajectory in Denmark and poorer SRH trajectory in Spain, Italy, and Korea, which were consistent. However, women in Sweden showed poorer outcome, which does not correspond to theoretical predictions.
These findings suggest that it is inconclusive whether Sweden and Denmark (with the most generous welfare arrangements) have better trajectories of health, and Spain, Italy, and Korea (with the least advanced state policies) have worse SRH paths among older adults. However, it can be inferred that Korean governmental policies may have produced a relatively worse context for the less-educated than the six European countries, as well as poorer settings for women than Denmark in terms of their initial SRH status. Understanding Korea's relative position regarding the inequalities of SRH trajectory in comparison with European countries can inform direction of state policies in future.
Go to :
 XML Download