

 PDF
PDF Citation
 Print
Print


INTRODUCTION
Liver cirrhosis is an end-stage liver disease, and its progression results in high mortality and occurrence of complications that dramatically lower the quality of life of patients with cirrhosis. The 1- and 2-year mortality of patients with decompensated cirrhosis was estimated to be 40% and 55%, respectively, and accounted for approximately 2% of global deaths.1 Therefore, many studies have been conducted to determine a useful marker for prognosis and survival prolongation in patients diagnosed with cirrhosis.2345 Based on the results of those studies, the Child-Pugh and the Model for End-stage Liver Disease (MELD) scoring systems are now widely used for clinical decision-making in patients with decompensated cirrhosis.
Serum vitamin D levels are associated with the viral status and treatment efficacy in chronic viral hepatitis,678 progression of liver fibrosis,8910 and prognosis in patients with chronic liver diseases such as cirrhosis.1011121314151617 Vitamin D not only acts as an essential molecule that sustains the homeostasis of muscle and bone metabolism but also modulates the immunologic cascade as an anti-inflammatory molecule and suppresses tumorigenesis in many organs.1819 Vitamin D3, the major and most effective form of vitamin D in humans, is produced by epidermal cells following sunlight exposure, and is then delivered to the liver by carrier proteins such as vitamin D-binding protein or albumin to undergo 25-hydroxylation. Next, 25-hydroxyvitamin D3 (25[OH]D3) is delivered to the kidney where it is hydroxylated again to calcitriol, the active form of vitamin D.20 During this process, any functional disorganization of the liver can affect serum levels of 25(OH)D3 since the liver is the main organ responsible for 25-hydroxylation of vitamin D and production of 25(OH)D3 carrier proteins. In fact, 25(OH)D3 might act as an immune modulator and affect the progression of chronic liver disease.67810
It remains unclear, however, whether serum vitamin D levels have any significant association with the prognosis of patients with cirrhosis that is independent of conventional prognostic models, such as Child-Pugh or MELD scores. In addition, since most previous studies examining the prognostic impact of vitamin D in the context of chronic liver disease were conducted in Western countries with Caucasians as test populations, the data on Asian patients with chronic liver disease are scarce, despite the fact that serum vitamin D levels can vary by ethnicity and region.2122
Thus, in this study, we elucidated whether serum 25(OH)D3 levels have any significant role in improving the predictive power of conventional prognostic models for end-stage liver diseases, using Korean patients diagnosed with liver cirrhosis.
Go to : 
METHODS
Study populations
We retrospectively analyzed a cohort of patients who were diagnosed with liver cirrhosis and had been hospitalized in the Department of Gastroenterology and Hepatology of Korea University Anam Hospital, Seoul, Korea, between November 2016 to October 2017. We checked serum 25(OH)D3 levels in all the patients admitted. We recruited 328 cirrhosis patients, and patients with malignant diseases (n = 113) and chronic kidney diseases (n = 35). Patients taking medications that affect vitamin D metabolism, such as vitamin D, calcium, or hormone supplements (n = 25), were excluded. The cohort consisted of the remaining 155 hospitalized patients with cirrhosis.
Measurement of serum 25(OH)D3
Serum 25(OH)D3 levels were assessed by liquid chromatography (LC)-mass spectrometry (MS) using a Triple Quad™ 4500 LC/MS/MS (AB SCIEX, Concord, Canada) because it has adequate sensitivity and provides high accuracy in metabolite identification for assessment of 25(OH)D and its subtypes.23
Diagnostic criteria and definition
The diagnosis of cirrhosis was based on liver histology, gross findings during surgery, or radiological findings of an irregular liver margin with ascites, varices, or thrombocytopenia (< 105 cells/mm3).5 Alcohol overuse was defined by a history of daily alcohol intake ≥ 60 g for men and ≥ 30 g for women.24 Hepatic encephalopathy (HEP) was defined based on the West Haven Criteria.25 Acute kidney injury (AKI) was diagnosed as an acute increase in serum creatinine levels by ≥ 0.3 mg/dL in < 48 hour or a ≥ 50% increase in serum creatinine levels from a baseline serum creatinine value in seven days, based on the International Ascites Club criteria.26 Severe vitamin D deficiency was defined as < 5.0 ng/mL of serum 25(OH)D3. The time for vitamin D measurements was categorized as autumn to winter (October–March) and spring to summer (April–September).27 The primary outcomes were defined as death and urgent liver transplantation (LT) during follow-up,5 and secondary outcomes were defined as cirrhosis complications such as spontaneous bacterial peritonitis (SBP), overt HEP, and AKI at baseline and their new occurrences within three months of inclusion. For the analyses of secondary outcomes, patients who died or failed to follow-up within three months of inclusion without the occurrence of each complication were excluded.
Statistics
We analyzed the data using R programming language (v 3.6.1; R Development Core Team, 2019), and compared continuous variables using the Mann-Whitney U test and Kruskal-Wallis test, whereas categorical variables were analyzed using the χ2 test, as appropriate. Pearson's correlation analyses were used to determine a correlation between serum 25(OH)D3 levels and prognostic models of cirrhosis. We conducted Cox proportional hazard regression analyses to investigate factors associated with primary outcomes, which comprised death and urgent LT. Patients lost to follow-up and who received elective transplantation were considered to be censored. The significantly associated factors with P < 0.05 in univariate analyses were included for multivariate analysis. The assumptions of hazards proportionality were confirmed by log-minus-log hazard plots. In addition, we calculated and compared the cumulative rates of primary outcomes using Kaplan–Meier plots and log-rank tests. We compared the discriminatory power of prognostic models for primary outcomes using C-statistics by receiver operating characteristic (ROC) curves. In addition, a calibration plot was drawn to verify the performance of the new model compared with actual outcomes, applying internal validation with bootstrap resampling. A Hosmer–Lemeshow test was used to assess the goodness of fit of the new model. A two tailed P < 0.05 was considered statistically significant.
Ethics statement
This study protocol was reviewed and approved by the Institutional Review Boards of the Korea University Anam Hospital (2018AN0398) and was performed in accordance with the ethical guidelines of the Declaration of Helsinki. A waiver of informed consent was obtained.
Go to :
RESULTS
Baseline characteristics of patients
For the 155 test subjects, the median age was 56.2 years (interquartile range [IQR], 48.7–69.3 years), and among them, 110 were men (71.0%). Alcohol and chronic hepatitis B accounted for 62.6% and 20.0% of all cirrhosis cases, respectively. The median MELD score was 15 (IQR, 11–21). Ascites was absent, mild/moderate, or severe in 60 (38.7%), 31 (20.0%), and 64 (41.3%) patients, respectively. Severe vitamin D deficiency was confirmed in 72 patients (46.5%). The main reasons for admission were jaundice (23.9%), ascites (21.9%), variceal bleeding (13.5%), HEP (9.7%), infection (9.7%), and AKI (5.2%).
Table 1 shows baseline characteristics for liver function and accompanying diseases based on Child-Pugh grade. The differences in age, gender, body mass index, and etiology of liver disease were not significant. Patients with a higher Child-Pugh grade exhibited significantly lower serum levels of 25(OH)D3, higher incidence of severe vitamin D deficiency, and higher MELD scores (P < 0.001).
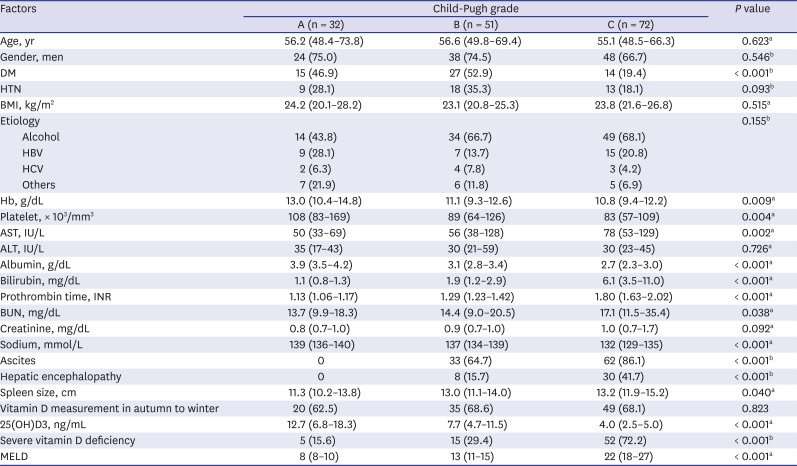
Table 1
Baseline characteristics based on Child-Pugh grades
Data are presented as number (%) and median (interquartile range). Severe vitamin D deficiency is defined as serum 25(OH)D3 levels lower than 5.0 ng/mL.
DM = diabetes mellitus, HTN = hypertension, BMI = body mass index, HBV = hepatitis B virus, HCV = hepatitis C virus, Hb = hemoglobin, AST = aspartate aminotransferase, ALT = alanine aminotransferase, BUN = blood urea nitrogen, 25(OH)D3 = 25-hydroxyvitamin D3, MELD = Model for End-stage Liver Disease.
aKruskal–Wallis test; bχ2 test.
![]()
Serum 25(OH)D3 levels as a representative for liver function
To determine the correlation between serum 25(OH)D3 and liver function in patients with cirrhosis, we conducted correlation analyses using Child-Pugh and MELD scores, as they are well-known representatives of liver function in advanced liver disease. Our results indicated that serum 25(OH)D3 levels were inversely correlated with Child-Pugh scores (Pearson correlation coefficient, −0.493; P < 0.001) and MELD score (Pearson correlation coefficient, −0.436; P < 0.001) (Fig. 1).
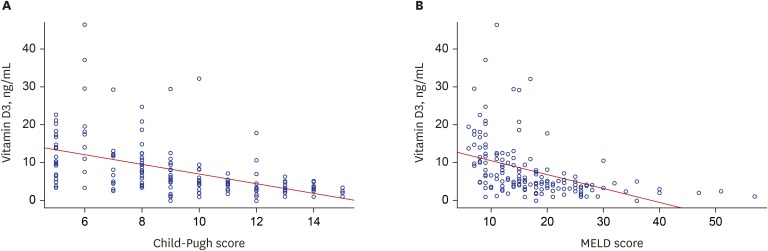 | Fig. 1Correlation between serum 25(OH)D3 levels and prognostic models for liver cirrhosis. (A) Correlation between serum levels and Child-Pugh scores and (B) MELD scores. Serum 25(OH)D3 levels were inversely correlated with Child-Pugh scores (Pearson correlation coefficient, −0.493; P < 0.001) and MELD scores (Pearson correlation coefficient, −0.436; P < 0.001).25(OH)D3 = 25-hydroxyvitamin D3, MELD = Model for End-stage Liver Disease.
|
Vitamin D deficiency as an independent predictor for survival
During a median follow-up period of 16.9 months (range, 0.1–31.8 months), 47 patients died, and 13 patients underwent urgent LT. The major causes of deaths in the study cohort were liver failure (40.4%), infection (27.7%), variceal bleeding (10.6%), and other causes (21.3%) such as stroke and heart disease. Patients with severe vitamin D deficiency at baseline died of infection (34.4%), liver failure (31.3%), and variceal bleeding (9.4%), whereas those without vitamin D deficiency expired because of infection (13.3%), liver failure (60.0%), and variceal bleeding (13.3%).
LT-free survival rates in the entire cohort were 78.6%, 70.6%, and 58.6% at 6-, 12-, and 24-months, respectively. Kaplan–Meier plots showed that patients with severe vitamin D deficiency had significantly lower LT-free survival rates than those without vitamin D deficiency (cumulative survival probabilities at 6-,12-, and 24-months were 61.2%, 51.5%, and 36.1% vs. 93.6%, 88.2%, and 77.3%, respectively; P < 0.001) (Fig. 2A).
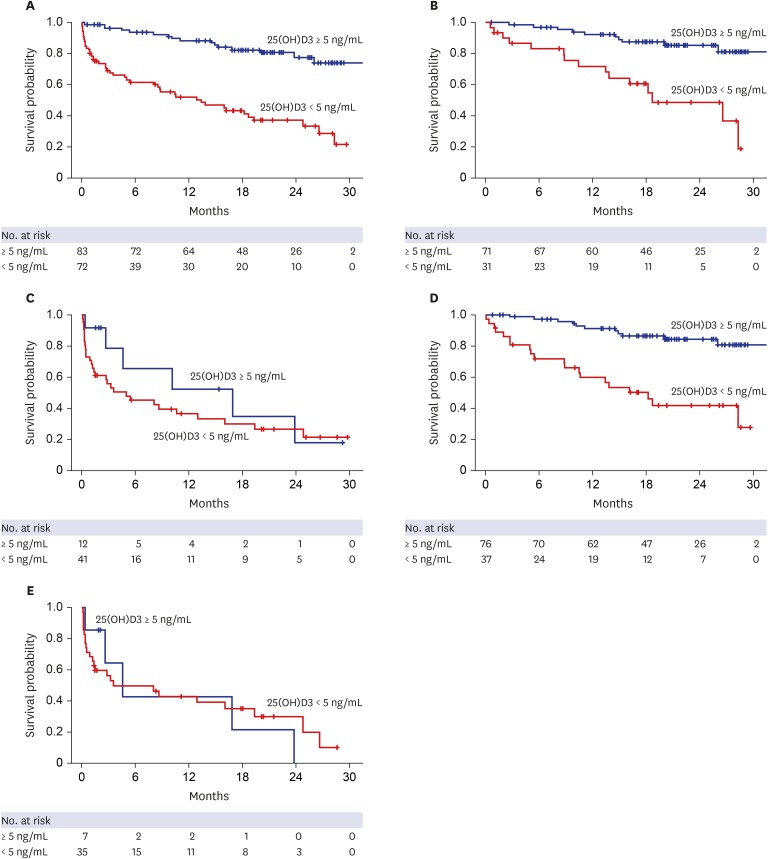 | Fig. 2Kaplan–Meier plots for primary outcomes based on the presence of severe vitamin D deficiency and MELD scores. (A) LT-free survival rates based on the presence of severe vitamin D deficiency (median survival time, not reached vs. 12.9 months for patients without and with severe vitamin D deficiency, respectively; P < 0.001). (B) LT-free survival rates in patients with Child-Pugh scores of 5–10 (median survival time, not reached vs. 18.7 months; P < 0.001). (C) LT-free survival rates in patients with Child-Pugh scores of 11–15 (median survival time, 16.8 vs. 4.9 months; P = 0.320). (D) LT-free survival rates in patients with a MELD score of ≤ 20 (median survival time, not reached vs. 16.2 months; P < 0.001). (E) LT-free survival rates in patients with a MELD score of > 20 (median survival time, 9.5 vs. 8.1 months, respectively; P = 0.890).LT = liver transplantation, MELD = Model for End-stage Liver Disease, 25(OH)D3 = 25-hydroxyvitamin D3.
|
To identify risk factors for primary outcomes (LT-free survival), we conducted a Cox proportional hazards regression analyses. Univariate analysis revealed that death or urgent LT were significantly associated with the presence of diabetes mellitus, ascites, encephalopathy, severe vitamin D deficiency, hemoglobin levels, prothrombin time international normalized ratio (PT INR), serum albumin, bilirubin, creatinine, and sodium levels, Child-Pugh score, and MELD score. The seasonal variability in vitamin D measurement did not significantly affect the primary outcome. Among these variables, serum bilirubin levels (hazard ratio [HR], 1.04; 95% confidence interval [CI], 1.01–1.08; P = 0.012), the presence of ascites (HR, 2.95; 95% CI, 1.28–6.83; P = 0.011), encephalopathy (HR, 2.01; 95% CI, 1.15–3.51; P = 0.014), and severe vitamin D deficiency (HR, 2.90; 95% CI, 1.53–5.51; P = 0.001) served as independent predictors for the primary outcome in the multivariate Cox model, excluding Child-Pugh and MELD scores. Alternative Cox models, including Child-Pugh or MELD score, in place of their component variables similarly demonstrated that severe vitamin D deficiency remained a significant independent predictor for primary outcome, even after adjusting for Child-Pugh or MELD scores (Table 2).
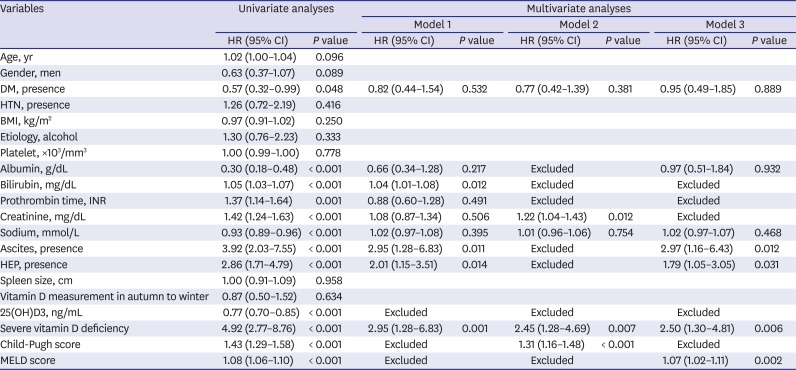
Table 2
Univariate and multivariate Cox regression analyses for mortality and urgent transplantation
Model 1, multivariate Cox model excluding Child-Pugh and MELD scores; Model 2, multivariate Cox model including Child-Pugh scores without its component variables; Model 3, multivariate Cox model including MELD scores without its component variables.
HR = hazard ratio, CI = confidence interval, DM = diabetes mellitus, HTN = hypertension, BMI = body mass index, AST = aspartate aminotransferase, ALT = alanine aminotransferase, INR = international normalized ratio, 25(OH)D3 = 25-hydroxyvitamin D3, MELD = model for end-stage liver disease.
![]()
Vitamin D deficiency and survival in relation to Child-Pugh or MELD scores
Next, in subgroup analyses, we investigated whether vitamin D deficiency acted as an independent predictor for survival in all spectrums of patients with cirrhosis. We found that the survival difference between those with and without severe vitamin D deficiency was only recognized in the subgroups corresponding to Child-Pugh scores of 5–10 (Fig. 2B) or MELD scores ≤ 20 (Fig. 2D). There was no significant difference in survival according to the presence or absence of severe vitamin D deficiency in patient groups with Child-Pugh scores of 11–15 (Fig. 2C) or MELD scores > 20 (Fig. 2E). In addition, serum 25(OH)D3 levels in those with and without severe vitamin D deficiency showed large differences in the patient groups corresponding to Child-Pugh scores of 5–10 (3.4 ± 1.3 and 13.0 ± 8.2 ng/mL, respectively) and MELD scores ≤ 20 (3.4 ± 1.3 and 12.7 ± 8.1 ng/mL, respectively). In contrast, in patient groups with high Child-Pugh or MELD scores, serum 25(OH)D3 levels in those with and without severe vitamin D deficiency were 2.9 ± 1.2 and 7.1 ± 3.7 ng/mL, respectively, for the group with Child-Pugh scores of 11–15, and 2.8 ± 1.2 and 6.4 ± 2.0 ng/mL, respectively, for the group with MELD scores > 20.
Predictive power of a combination model containing MELD score and vitamin D deficiency
To further confirm the usefulness of serum 25(OH)D3 levels in predicting the survival of patients with cirrhosis, we incorporated the presence of severe vitamin D deficiency into the MELD score and constructed a new prognostic model, named the MELD-D score. This score was calculated by adding five points to patients with MELD scores ≤ 20 and severe vitamin D deficiency, based on a beta regression coefficient of severe vitamin D deficiency after adjusting for MELD score. Patients with a MELD score > 20 or those without severe vitamin D deficiency, had a MELD-D score that was the same as the MELD score.
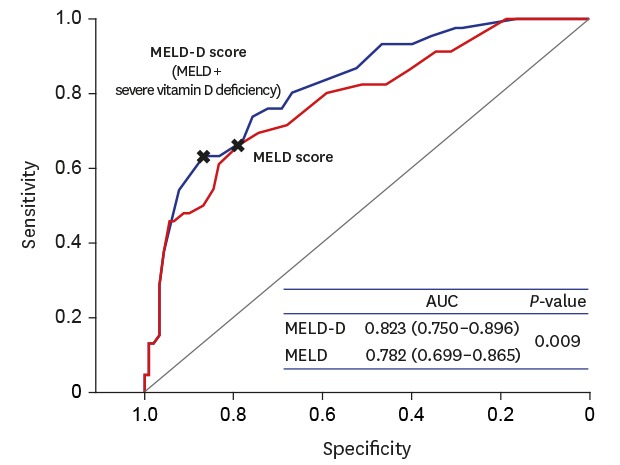
Then, we calculated the area under the ROC curve (AUROC) for 3-,6-, and 12-month mortality to compare the performance of the MELD and MELD-D scores. AUROC of the MELD-D score was significantly higher than those of the MELD score, as shown in Fig. 3A–C (0.889 vs. 0.855, 0.870 vs. 0.833, and 0.823 vs. 0.782; P = 0.018, 0.011, and 0.009, respectively). The MELD–D model showed a good overall calibration for 12-month mortality, even with a bias-corrected plot by internal validation (Fig. 3D). Hosmer-Lemeshow test also showed no significant difference between the predicted and actual probability (P = 0.525).
 | Fig. 3Comparing predictivity of MELD-D and MELD scores for short- and long-term survival. (A) AUROC curves for 3-month mortality. (B) AUROC curves for 6-month mortality. (C) AUROC curves for 12-month mortality. MELD-D scores had significantly higher AUCs than MELD scores through 3-,6-,12-months (AUC: 0.889 vs. 0.855, 0.870 vs. 0.833, and 0.823 vs. 0.782; P = 0.018, 0.011, and 0.009, respectively). (D) Calibration plot for 12-month mortality. The mean absolute error was 0.019 using 40 repetitions of bootstrap.MELD-D = Model for End-stage Liver Disease with vitamin D, MELD = Model for End-stage Liver Disease, AUROC = area under the receiver operating characteristic curve, AUC = area under the curve, PPV = positive predictive value, NPV = negative predictive value.
|
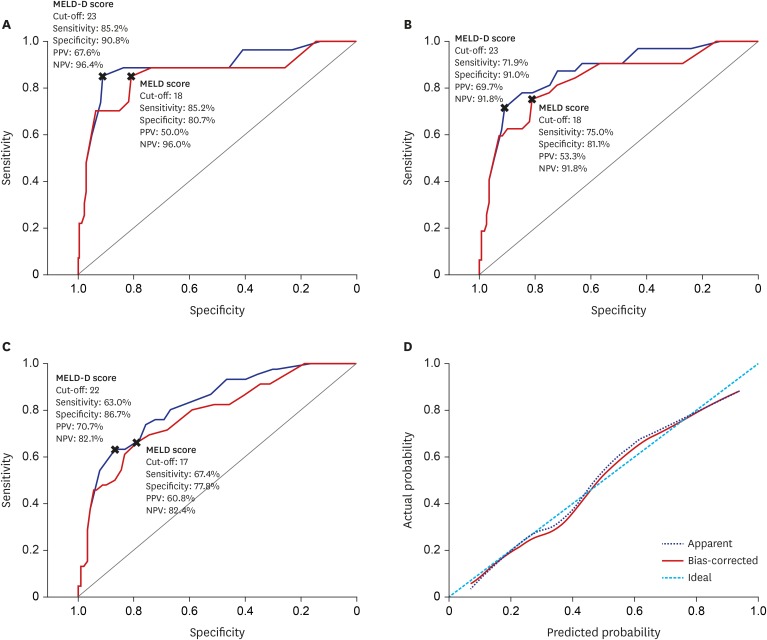
In addition, the MELD-D score could differentiate the survival of cirrhotic patients better than the MELD score when the entire cohort was divided into four optimal sections (6–10, 11–17, 18–25, > 25; P = 0.006 vs. 0.061) (Fig. 4). The cumulative survival probabilities at 3-,6-, and 12-months were 96.6%, 96.6%, and 96.6% for MELD-D 6–10; 95.8%, 93.7%, and 80.8% for MELD-D 11–17; 84.1%, 75.0%, and 63.2% for MELD-D 18–25; and 40.7%, 30.6%, and 30.6% for MELD-D > 25 sections, respectively.
 | Fig. 4Kaplan–Meier plot for primary outcome according to four categories of MELD and MELD-D scores. (A) MELD and (B) MELD-D scores were stratified into four categories: ≤ 10, 11–17, 18–25, and > 25. These categories resulted from the optimization process of MELD categorization. Cumulative survival rates during the follow-up period were globally more differentiated according to categories in MELD-D scores than MELD scores. Especially, between categories of ≤ 10 and 11–17, MELD-D scores significantly discriminated survival, but MELD scores did not (P = 0.008 vs. 0.081). The numbers mentioned to the right of each graph indicate P values between groups.MELD = Model for End-stage Liver Disease, MELD-D = Model for End-stage Liver Disease with vitamin D.
|
Serum 25(OH)D3 level as a risk factor for cirrhosis complications
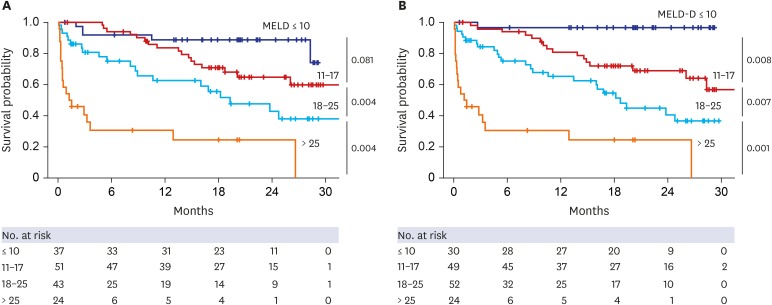
We investigated new occurrences of SBP, overt encephalopathy attack, and AKI in patients without each complication at baseline. Among 72 patients who had uninfected ascites at baseline and were followed over 3 months, serum 25(OH)D3 levels were significantly lower in those who experienced SBP (n = 8) than in those who did not (median [IQR], 2.8 [1.8–3.4] vs. 5.0 [3.7–8.4] ng/mL; P = 0.004) (Fig. 5A). Among the 110 patients who had no overt hepatic encephalopathy at baseline and were followed-up, serum 25(OH)D3 levels were significantly lower in those who newly developed overt encephalopathy within 3 months of inclusion (n=11) than in those who did not (3.9 [2.8–5.8] vs. 6.7 [4.5–12.3] ng/mL; P = 0.017). Of the 114 patients without AKI at baseline, serum 25(OH)D3 levels were significantly lower in those who suffered AKI within 3 months of inclusion (n = 15) than in those who did not (3.8 [3.1–5.8] vs. 6.7 [4.4–12.3] ng/mL; P = 0.009).
 | Fig. 5Levels of serum 25(OH)D3 and MELD-D based on the new occurrence of cirrhotic complications at baseline and within three months. (A) Levels of serum 25(OH)D3 according to new occurrences of cirrhotic complications, including SBP, HEP, and AKI. (B) MELD-D scores according to new occurrences of cirrhotic complications. The numbers above the thick lines at the top of graphs indicate P values between the patients with and without each complication, respectively. Lower 25(OH)D3 and higher MELD-D scores were associated with new occurrences of cirrhotic complications within three months.25(OH)D3 = 25-hydroxyvitamin D3, MELD-D = Model for End-stage Liver Disease with vitamin D, SBP = spontaneous bacterial peritonitis, HEP = overt hepatic encephalopathy, AKI = acute kidney injury.
|
Furthermore, MELD-D score was significantly increased in patients who experienced new episodes of complications within 3 months of inclusion than in those who did not (Fig. 5B). The score was 25.0 (23.5–31.0) vs. 17.5 (14.0–22.5) (P = 0.003) for SBP, 26.0 (20.0–28.5) vs. 15.0 (10.5–20.0) (P < 0.001) for overt encephalopathy, and 21.0 (15.0–24.5) vs. 14.0 (11.0–20.5) (P = 0.002), respectively.
Go to :
DISCUSSION
Recently, vitamin D has attracted attention as a pro-survival molecule. Many researchers have revealed that this molecule has pleiotropic effects in relation to cell differentiation, proliferation, and anti-inflammatory processes.28 Moreover, many studies have indicated that the deficiency of this vitamin is related to the progression and severity of various pathologic conditions, such as infection, cardiovascular disease, degenerative disease, and cancer.2930 In particular, close correlations were demonstrated between vitamin D levels and the status of chronic liver disease, possibly because of the importance of the liver's role in the activation of vitamin D. Several studies focused on the association of serum 25(OH)D levels and the severity and prognosis of patients diagnosed with cirrhosis.11121314151617 In most studies, except one,13 vitamin D levels were significantly correlated with the conventional liver function scoring systems, such as Child-Pugh and MELD scores. In the present study, we have clearly shown that serum 25(OH)D3 levels were inversely correlated with Child-Pugh and MELD scores.
However, it is controversial whether serum vitamin D levels have any potential role in predicting the mortality of cirrhosis patients independently of conventional prognostic models. Putz-Bankuti et al.12 found a significant association of serum 25(OH)D levels with hepatic decompensation and mortality in patients with chronic liver failure; however, these associations were largely attenuated towards non-significant trends after adjustments for Child-Pugh or MELD scores. Furthermore, a French study showed no significant association between vitamin D deficiency and mortality in patients with cirrhosis, although those with vitamin deficiency were more susceptible to bacterial infection.13 In contrast, two studies from Germany and Belgium demonstrated that low vitamin D levels had independent associations with survival even after adjusting for MELD scores.1114 Largely consistent with these latter two studies, the present study demonstrated that serum 25(OH)D3 levels could be an independent prognostic factor for survival, as shown in Table 2.
Unlike these two studies, however, our study clarified that the independent prognostic role of serum 25(OH)D3 levels were not relevant in all spectra of patients with liver cirrhosis but were limited only to those with mild to moderate degrees of hepatic decompensation. This could be explained as follows. First, serum vitamin D levels might reflect the deterioration of liver function earlier than Child-Pugh or MELD scores. Levels of transporters of vitamin D (vitamin D-binding protein and albumin) and enzymatic activity of the cytochrome P450 family for hydroxylation could decrease in the early phase of liver dysfunction.31323334 These changes may be directly reflected in the reduced serum 25(OH)D3 levels, but might not yet affect Child-Pugh or MELD scores.
Second, the actual differences in serum 25(OH)D3 levels between those with and without severe vitamin D deficiency might not be so prominent as to affect survival in severely decompensated patients with a high Child-Pugh score > 10 or MELD score > 20, compared with those without these scores.
Third, vitamin D deficiency itself appears to render patients with mild hepatic decompensation more susceptible to increased hepatic decompensation. According to recent studies, decompensation of cirrhosis is frequently caused by gut microbiota invasion, endotoxemia, and systemic inflammation developing with the progression of portal hypertension and impaired liver function.3536 Vitamin D appears to modulate T-cell immune response and exert anti-inflammatory and anti-bacterial effects.1836 In particular, vitamin D-dependent LL-37 activation pathway is one of the major antibacterial mechanisms in humans.37 Furthermore, vitamin D has been demonstrated to regulate tight junctions, epithelial barriers, and gut microbiota of the intestine, suggesting a protective effect against endotoxemia from the gut.38 Indeed, many clinical studies have shown an association between low 25(OH)D levels and hepatic decompensation, such as SBP and HEP, in patients with cirrhosis.11121517 The present study also showed that the risks of impending SBP, overt encephalopathy, and AKI had significant associations with lower levels of serum 25(OH)D3. High susceptibility to decompensation events ultimately affects survival of patients with cirrhosis.
Serum 25(OH)D levels in the present study were slightly lower in the overall population and in each Child-Pugh grades, as compared to the study based on European participants.12 Most of the previous studies on vitamin D in chronic liver diseases have been performed on Western populations. Therefore, the data in the present study would provide clinically meaningful information for patients in Asian countries because vitamin D levels can vary according to ethnicity and region.21 Besides, unlike in previous studies, the present study focused on serum 25(OH)D3 levels instead of 25(OH)D levels. Serum 25(OH)D includes 25(OH)D2, which is less effective than 25(OH)D3 and exists in the body only after the intake of dietary supplements.20 Thus, serum 25(OH)D3 levels might serve as a more reliable marker than 25(OH)D levels without the influence of external factors.
The present study also has certain limitations. The results were analyzed based on a retrospective design and included only hospitalized patients with cirrhosis, although all the cirrhotic patients hospitalized during the study period were included. Therefore, selection bias might have occurred, and all confounding factors related to vitamin D metabolism, such as genetic polymorphism, could not be implicated in the analyses. Moreover, the relatively small sized cohort limited further statistical analysis and disallowed internal cross-validation of MELD-D scores. Thus, a validation study must be performed using a large cohort of patients with cirrhosis.
Our results suggest that serum 25(OH)D3 level testing would be helpful in managing patients with cirrhosis. The MELD-D score, combined with MELD score and 25(OH)D3 levels, had a better predictivity for short-term and long-term prognosis, than the conventional MELD score. In addition, low serum 25(OH)D3 levels and high MELD-D scores appear to be closely associated with a significantly high risk of impending SBP, overt HEP, and AKI, ultimately leading to death. Thus, careful observation of these patients and the avoidance of aggravating factors, such as hypovolemia, infection, and hepatotoxic agents are required. Although controversy remains regarding the effect of sunlight exposure and vitamin D3 supplementation, these factors could be considered in cirrhotic patients with severe vitamin D3 deficiency.
In conclusion, serum 25(OH)D3 level is a significant independent prognostic factor for patients with liver cirrhosis and has a differential impact on disease outcomes according to MELD and Child-Pugh scores. Therefore, serum 25(OH)D3 levels should be measured in patients with cirrhosis. Additionally, our results warrant a validation of MELD-D model for diverse large cohorts of patients with cirrhosis.
Go to :
 XML Download