

 PDF
PDF Citation
 Print
Print


INTRODUCTION
Influenza is an acute respiratory disease caused by infection of the influenza virus, which usually recovers in healthy adults, but in high-risk groups such as the elderly and chronic patients, the patients infected with influenza is at high risk for severe influenza contraction or complications such as pneumonia, and some patients may be led to death caused by severe complications.1
In Korea, the influenza epidemic during the winter season continues every year. Statistical monitoring data of infectious disease portals operated by the Korea Centers for Disease Control and Prevention (KCDC) showed that the peak of influenza-like-illness proportion continued to increase since the 2014–2015 influenza season, especially during the 2016–2017 fifty-second influenza season, and the proportion of influenza-like-illness rose to 86.2.2
Influenza is a disease that can be prevented by vaccination, and the effects of vaccination vary from year to year depending on the age of the recipient, the immunity that accompanies underlying disease and vaccination, and the antigenic consistency of the vaccine and epidemic strains. When the vaccine and epidemic strains coincide, the prevention effect in the elderly was 70%–90% compared to healthy adults, vaccination was effective in 50%–60% to prevent hospitalization due to influenza, and in 80% to prevent death.34 In 82% of the chronic respiratory illnesses, vaccination was found to be effective to prevent hospitalization.5 However, it is known that the effect of vaccination cannot be confirmed when there is an antigenic mismatch.67
In Korea, influenza vaccination is recommended to those who are recommended for prior vaccination according to the practical standards and methods of vaccination presented in notification by KCDC article 2018-1. Recommended influenza immunization priorities include health care workers, female in pregnancy, 50–64 aged group (population), the elderly (65 years or older), children and adolescents, and patients with chronic illness. In addition, children under age 2, the elderly (65 years or older), and patients with chronic diseases are classified into a high-risk group with severe influenza or complications.3 In Korea, as part of the national vaccination program, free vaccinations are provided for infants and the elderly (65 years or older). The vaccination rate in the 2017–2018 season was relatively high at 78.0% for children aged 6–59 months and 82.4% for those aged 65 or over in 2016–2017.13
In Korea, free vaccinations for infants and the elderly (65 years or older) are provided during the winter season. Despite the high vaccination rates, the number of patients diagnosed with influenza is increasing every year.89 Hence, this study identified the effect of the age-period-cohort (APC) in order to comprehend the epidemiologic characteristics of influenza outbreaks by using the health insurance claims data of the National Health Insurance Service that include Korean nationals. If APC analysis that can identify age group, time and space, and specific generation at high risk based on national health insurance claims data is applied, various public health interventions including vaccination can take effect along with providing more specific and meaningful information for quantitative evaluation.
The specific purpose is as follows: Identify the number of episodes by year and age diagnosed with influenza; Calculate the crude incidence rate (CIR; per 1,000 person) by year, age, and cohort (= birth year); Identify the effect of APC.
Go to : 
METHODS
Study design and data source
In the National Health Information DB of the National Health Insurance Service, data from July 2008 to June 2018 were used, based on the sickness details tables, medical services statement tables, and the qualification and insurance tables.8 In addition, since health insurance database is a claims data, it was reconstructed as epidemiologic research unit, episode of care.
Influenza disease was reset from July 1 to June 30 of the following year, considering the characteristics of the disease that occurs during the winter season.
Establish an episode of care
Health insurance database is a claims data that may be claimed separately for a variety of reasons, even though it was actually one episode of case. Because a single disease uses different medical services for different periods and times, separate claims are generated, and therefore separate claims can be used as epidemiological data only after they are connected and integrated.10
In this study, the analysis process grouped all claims that were directly connected in time as one episode of care, that is, the time between the end date and the date within 1 day of the end date and the next start date. The interval between the leading end dates and trailing start dates for the same person, which is a window period, is as follows (Fig. 1). Assuming that claim events within the same season are considered as one and the same episode of care, 100 days were set as a window period. In this way, 94.9% of all segregation claims were included within 100 days. When the claims data was converted to episode of care after applying 100 days of window period, there were some differences from year to year, but about 99% of all influenza patients experienced one outbreak. That is, only about 1% of patients experience more than one outbreak (Table 1).
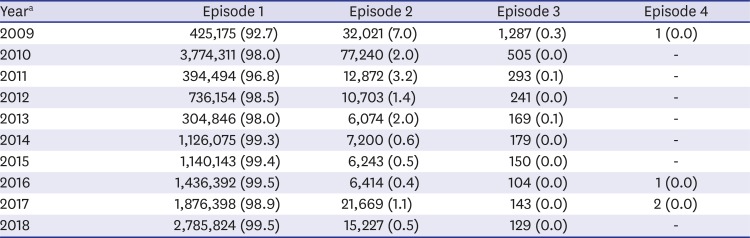
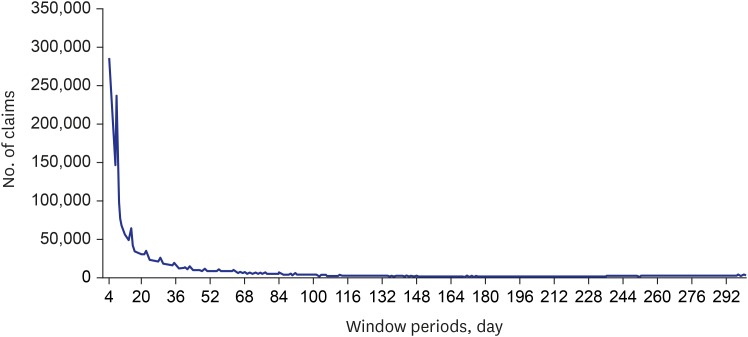
Table 1
Number of episodes for 100 days' window period diagnosed with influenza by year
Data are presented as number (%).
aEach year (starts from July 1st and ends at June 30th) is denoted by the calendar year in which it ends.
![]()
Case definition
In the health insurance claims data, primary diagnosis refers to the disease that causes the greatest demand for the treatment or examination (the disease that causes the most use of medical resources) and is listed first. Additional diagnosis is a condition that occurs with the main condition during the treatment period.8
Unlike severe diseases such as myocardial infarction, stroke, or cancer, influenza is less likely to be justified as a primary diagnosis. That is, if influenza occurs among existing chronic patients or other hospitalized patients, it is not likely to occupy the position of primary diagnosis but is likely to be added as an additional diagnosis or other illness. In consideration of these points, the influenza corporal subjects included all primary, additional and other diagnoses. The disease code was defined as J09, J10, and J11.
Study subjects
Using the 40T in the National Health Information DB, all cases of medical statement in 20T, qualifications, and insurance were combined, with the claims diagnosed as all sicknesses including primary, additional, and other diagnoses of influenza. A total of 24,605,290 claims were used to construct a 100-day episode of care. The final study consisted of 100-day episode of care constructed from all cases of influenza, and a total of 14,400,754 episodes were selected for analysis.
Variables
In the National Health Information DB, sickness details tables (40T), medical services statement tables (20T), qualification and insurance tables, and population group tables were used. 20T is a collection of medical services statement claimed by medical care institutions when patients use medical services. 40T includes disease codes extracted from 20T.8 The parameters of sex, age at onset of care, start year and month of treatment, start date of treatment, form code, disease number 1 (primary diagnosis), disease number 2 (secondary diagnosis), and disease treatment distribution were selected from sickness details tables. In the medical services statement tables, variables such as medical institution number, medical institution type code, medical department code, total hospital visit days, total prescription days, and payment status were selected. In the qualification and insurance tables, the month of care start date, adjusted address code, subscriber classification, and insurance variables were selected. Sex, base month, municipality, income level, and age variables were used in the population table and the insurance tables. The two tables were used as denominators representing the total population when we calculated incidence rate and APC effects. The keys connecting all the tables were a common key and a personal identification number.
Statistical analysis
The health insurance claims used in this study were reconstructed into 100-day episodes of care to be used as epidemiological data to perform basic analysis, calculation of CIR, and APC effect analysis.
In the basic and incidence analysis, the age was grouped on the unit of 5, the cohort was initiated with 3 years unit and reset to 5 years unit group. The incidence rate of influenza by age and cohort by year was calculated by using the number of the corresponding cases as a numerator. The entire population table was created using the population table and the insurance table was used as the denominator.
The APC effect analysis analyzed three effects related to time to summarize the social variation, causes of disease, increase in age, and population characteristics, which is different from the original method that uses only age and period. The identification problem of the APC analysis, in which the three effects cannot be estimated simultaneously due to collinearity, in which the sum of age and cohort is the period variable, was solved using the Glimmix model using the statistical package SAS (SAS Institute Inc., Cary, NC, USA).11 In other words, the hierarchical APC (HAPC) analysis was performed using the mixed effect model. The specification of the model is as follows:
i, age group; j, time period; k, birth cohort.
In addition, assuming the Poisson distribution and correcting the population with the offset option, the relative risk was able to be calculated directly, rather than the odds ratio. In the HAPC analysis model, the fixed effect variables were analyzed using age, metropolitan city, income level by insurance type, and random effect variables with period and cohort (= birth year) variables.
Ethics statement
This study was exempted from deliberation by the Hanyang University Institutional Review Board (IRB) for the exemption from IRB deliberation that does not include personally identifiable information (HYU-2019-04-021).
Go to :
RESULTS
Number of influenza episodes of care by year, sex and age
In terms of the number of episodes diagnosed as influenza, the number of episodes between the ages of males and females aged 0–9 was the highest in the 2017–2018 season after the 2009–2010 season (Table 2). In the 2016–2017 season a large number of episodes from 10 to 19 years were seen. In the 2017–2018 season, males and females over 45 years of age had more episodes than in the 2009–2010 season.
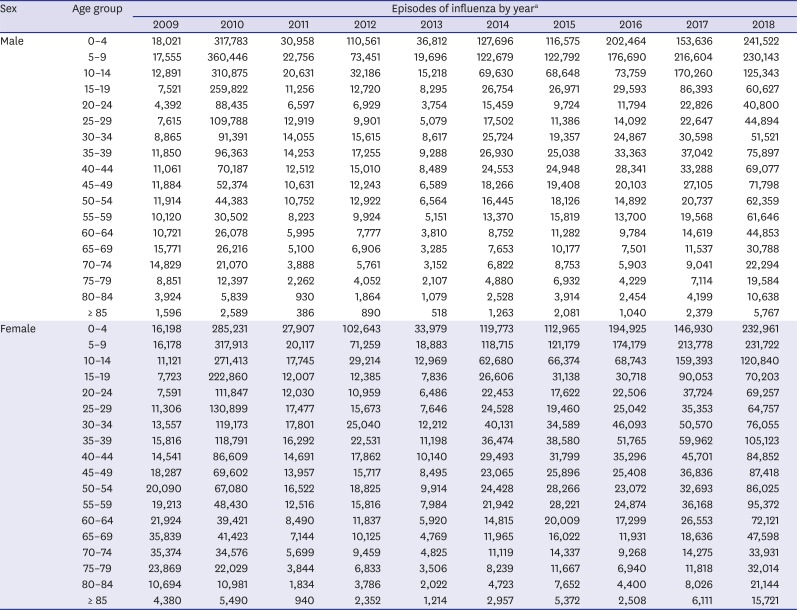
Table 2
Number of episodes according to age group for influenza by year
aEach year (starts from July 1st and ends at June 30th) is denoted by the calendar year in which it ends.
![]()
Incidence rates of influenza by year, sex and age
The incidence rate of males and females diagnosed with influenza CIR, (per 1,000 person) showed that between 2009 and 2010 0–9 years had the highest incidence rate (Table 3). Also, the incidence rate in school-age and adolescent ages was high. In 2016, the 2015–2016 season, the incidence rate of males aged 0–4 was 171.02 episodes per 1,000 people, and females were 173.31. In 2017, the 2016–2017 season, the incidence rate was 139.48 for males aged 10–14, 140.94 for females, 52.96 for males aged 15–19, and 60.07 for females. The incidence rate of the 2017–2018 season, in the ages of 40–50 and 60–64 was higher compared to that in the pandemic influenza season.
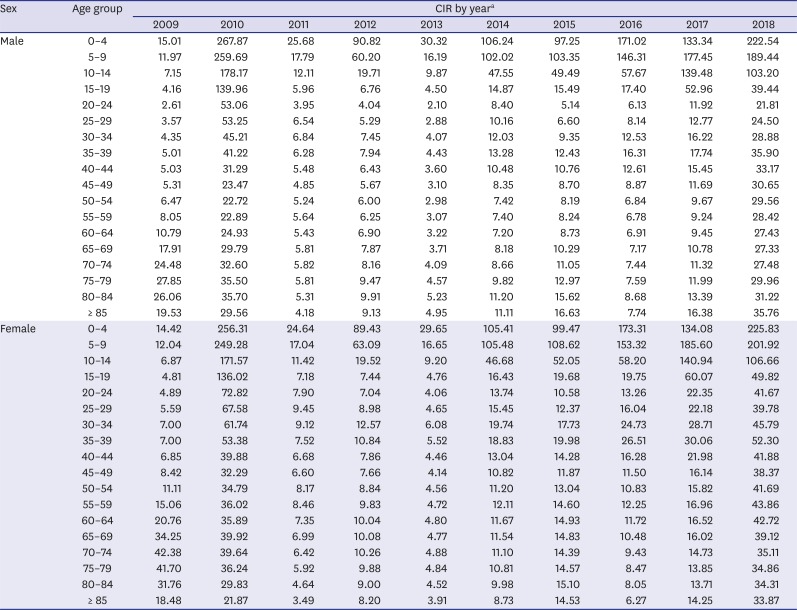
Table 3
Age-specific CIR for influenza by year
CIR = crude incidence rate.
aEach year (starts from July 1st and ends at June 30th) is denoted by the calendar year in which it ends.
![]()
Incidence rates of influenza by year, sex, and cohort
According to the CIR, (per 1,000 person) diagnosed as influenza, on 2010, the 2009–2010 season the incidence rate of males born in the 1923–1942 was 31.46–31.29 episodes per 1,000 people, 66.24 for males who were born between 1988–1992, and 172.24–253.39 for males who were born on 1993–1997 and higher (Table 4). The incidence of females was 63.32 for those who were born between 1978 and 1982, 69.54 for those who were born between 1983–1987, and 166.10–240.32 for those who were born on 1993–1997 and higher. There was an overall decline in 2009–2010 season after the pandemic influenza outbreaks but from 2014, cohort incidence rates continued to increase. In 2017, the 2016–2017 season, the incidence rate was 52.66 for males born in 1998–2002, 59.67 for females, 138.39 for males from 2003–2007, 139.76 for females, 176.06 for males born in 2008–2012, and 184.11 for females, which showed high incidence rates. In 2018, the season of 2017–2018, males were found to have a high incidence of 29.19 for 1963–1967 born and 243.79 for 2013–2017 born. Females had a higher incidence for 1953–1967 born and 1978–1987 born, 41.13 for the 1993–1997 born and 251.38 for 2013–2017 born. Overall incidence rate was higher in females.
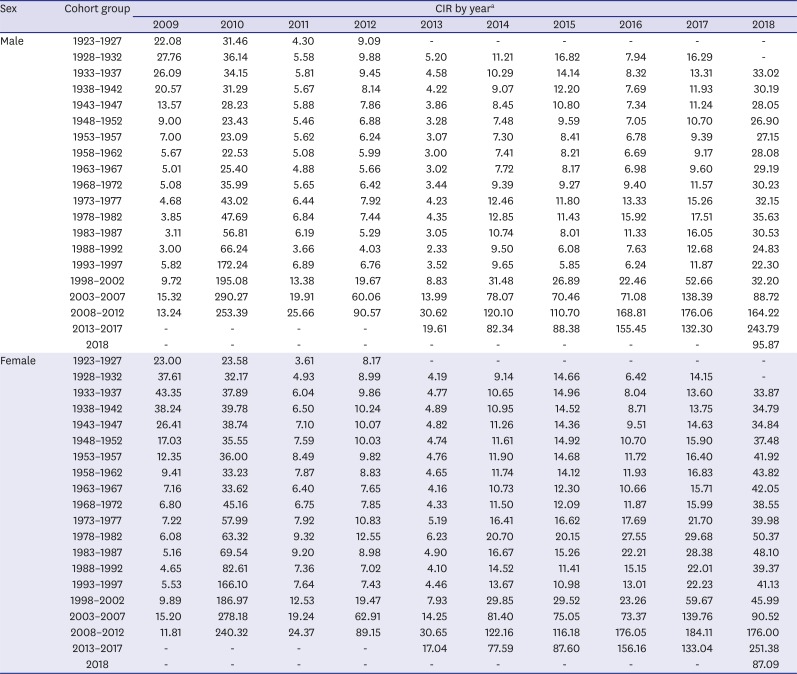
Table 4
Cohort-specific CIR for influenza by year
CIR = crude incidence rate.
aEach year (starts from July 1st and ends at June 30th) is denoted by the calendar year in which it ends.
![]()
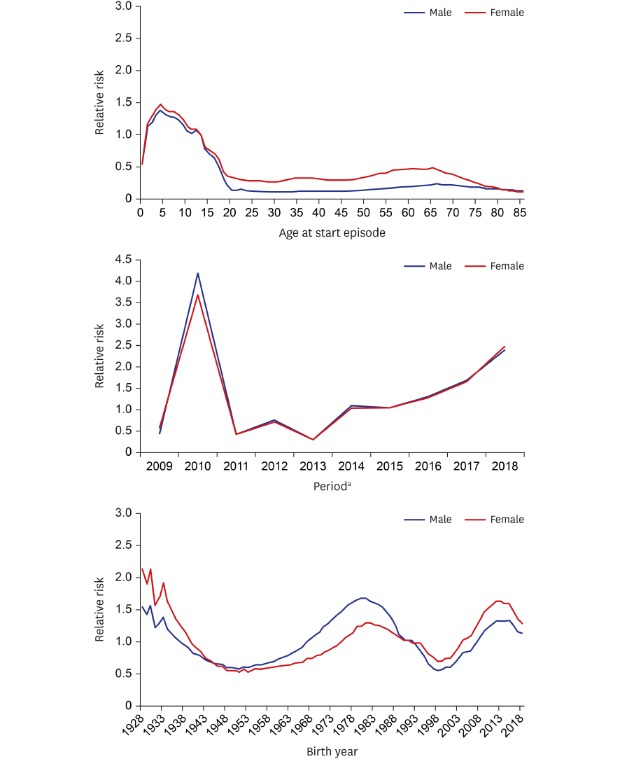
Analysis of APC effect on influenza outbreaks
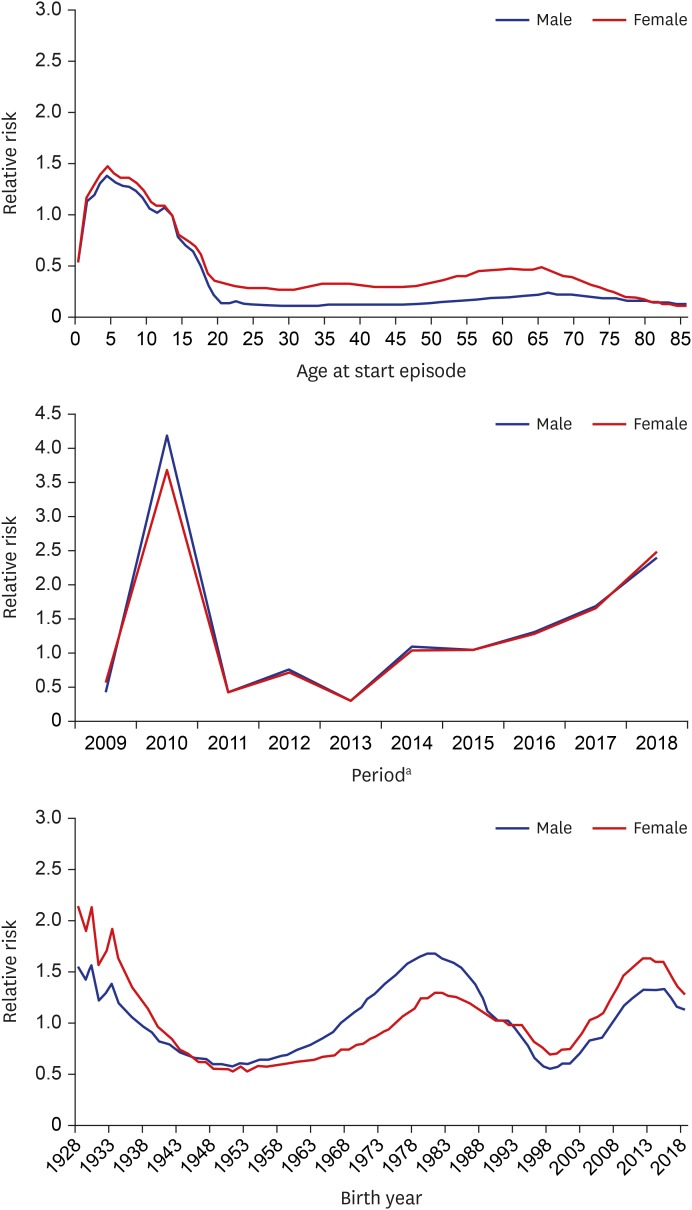
The APC effect analysis was conducted in all episodes diagnosed with influenza. As a result, on age effect, the relative risk was 1.38 for males and 1.48 for females at age 4 based on age 13 (Fig. 2). In addition, it was confirmed that the relative risk was 1.23 for males and 1.32 for females at age 8 or school age. At age 13, higher relative risks were observed in females. The period effect was identified at the highest relative risk in 2010, the season of 2009–2010, and has been continuously increasing since the 2013–2014 season. The cohort effect was gradually high in males and females born in the 1937's or lower. Males were found to have higher relative risks for 1970–1988 born and females in 1977–1988 born and the relative risk was higher in males. From people born in 2008 or later, the relative risk was high in females. Males born in 2015, and females born between 2012 and 2013, the relative risk was high.
Go to :
DISCUSSION
Influenza is a disease that can be prevented by vaccination, and in Korea, influenza vaccination is recommended to those who are recommended for vaccination. As part of the National Immunization Support Program, free vaccinations are provided every year for infants and seniors aged 65 and over. Since 2015, free influenza vaccination was provided for the elderly aged 65 and older born before 1950.12.31. Infants born between 2015.10.1 and 2016.6.30 in 2016–2017 season, and infants born between 2012.9.1 and 2017.8.31 in 2017–2018 season were given vaccination.31213
Although infants and the elderly aged 65 years or older who are part of the National Immunization Complimentary Support Program are included in the high-risk group and given priority for influenza vaccination resulting in high vaccination rate, patients diagnosed with influenza tend to continuously increase.89 This study aims to identify the epidemiological characteristics associated with influenza outbreaks and to use it as basic data for reducing influenza outbreaks.
This study reconstructed the data of the medical specification unit into the episode of care unit, which was claimed as influenza, by using the data of the health insurance claims data of the National Health Insurance Service. The interval between episodes of care was determined to be 100 days and the task of grouping the reclaim within 100 days into the same episode was performed. In addition, after 100-day episodes of care were established for influenza, calculation of CIR by year, age, and cohort, and analysis of APC effect adjusted for income level by insurance type, and metropolitan city were performed at the episode level.
Since pandemic influenza in 2014, the CIR by age and cohort has increased continuously. Especially, influenza incidence was high in infants and the elderly by age, while high incidence was observed in cohorts born between 1973 and 1982. The APC effect analysis revealed that the age group with the highest relative risk was infants. In addition, the risk of influenza outbreaks was the highest in 2010 (1/7/2009 to 30/6/2010) due to the novel influenza virus pandemic. Its vaccine was subsequently developed and early intervention with the vaccine could decreased the risk for several years, but the risk has increased since 2014. The cohort effect was found with a higher relative risk in children born in 2012–2018, 1978–1987, and 1937.
In multivariate analysis, which took into account APC effect (= birth year), the group at highest risk for influenza was the newly born infants. In the overall age effect, people in their 30s and 40s were not at high risk. Nevertheless, in the cohort effect, high relative risks were observed in children born after 2010 and adults born in the 1980s presumed to be parents' generation of the children. The recent simultaneous increase in the relative risks in infants and their parents has suggested the potential impact of family propagation.
Influenza caused by droplet infection can be transmitted through cough, sneeze and conversation within easy distance. Family in the community is one of important factors of influenza transmission. Contact between family members is frequent and, therefore, households can provide easy transmission of influenza.14 In addition, children among family members are more vulnerable to inflection to play an important role in transmission because they spend a lot of time in nurseries, kindergartens and schools with others.1516 In the previous study on the risk of infectious disease transmission, it was suggested that close contact increased the risk of transmission and the closest contact occurred at home or during leisure activities.17
In other terms, strengthening immunizations for infants may reduce the burden of influenza disease among young parents who are an active socioeconomic population.
Infants and the elderly aged 65 years or older who were eligible for the National Immunization Vaccine Support Project revealed decreased CIRs due to free vaccination in the first season but incidence increased from the following year. Free vaccinations were expanded and enforced for infants, but the incidence of influenza was high. As well as in the elderly aged 65 years or older, free vaccinations were expanded to private medical institutions but the incidence increased. Influenza immunization effects vary from year to year depending on the age of the vaccinated, the accompanying underlying diseases, the immune status, and the antigenic consistency of the vaccine and epidemic strains of the year. Antigenic mismatch can lead to high influenza prevalence in the vaccinated subjects,18 but despite the high immunization rates in infants and the elderly aged 65 years or older, the patients continue to increase and therefore it will be needed to consider the effects of vaccination.
Recently, two strains of influenza B virus were prevalent in Korea, and the quadrivalent influenza vaccine showed excellent immunogenicity against the virus that was not included in the trivalent vaccine.1819 Currently, the vaccine used in free vaccination in Korea is inactivated influenza vaccine (trivalent, IIV3), and it is recommended that the trivalent vaccine should contain one type of B virus other than the recommended strain.3 Since influenza viruses cause large and small epidemics through antigenic drift, it is necessary to switch to quadrivalent vaccines containing influenza B antigens to reduce antigenic mismatch caused by antigenic drift. In addition, converting the vaccine to a quadrivalent vaccine, in the free immunization support program, will reduce medical expenses due to the decreased burden of disease in infants and the elderly.
The limitations of this study were as follows: First, since the National Health Insurance Service's data were billing claims data, the influenza diagnosis information could only be confirmed by the disease codes. The clinical data of medical institutions can confirm the type of virus based on symptoms and test results to reflect the accuracy of influenza diagnosis, the number of morbidity experiences and severity of influenza-induced illnesses caused by the virus type, but the National Health Insurance Service's data cannot confirm clinical results. Analysis of Tamiflu and Relenza was possible, but it was necessary to reduce the year of use in the data considering the timing of stabilization of prescription. Second, since influenza is a disease that can be prevented by vaccination, vaccination information is very important, but because it is not claimed due to non-payment, it was not possible to use vaccination information from the claims data. Therefore, influenza diagnosis and vaccination could not be confirmed. Further studies will be needed to determine the influenza outbreak according to influenza vaccination.
In the APC effect analysis, the influenza outbreak was confirmed by reconstructing data by billing statement units at 100-day intervals using the National Health Insurance Service's health insurance claims data including the whole nation. After the outbreak of pandemic influenza, from 2014 the influenza incidence has been increasing every year, and high influenza incidence and relative risk were confirmed in the cohort covered by free vaccination. In addition, the simultaneous increase in influenza outbreaks among high-risk infants and their parents' generations may suggest the possibility of family transmission.
Since influenza can be primarily prevented by vaccination, reinforcement of vaccination in infants may reduce the disease burden in their parents, and also the risk of infection caused by family transmission. Furthermore, a new national vaccination program may be needed to reduce secondary complications such as pneumonia and medical uses caused by influenza infection.
Go to :
 XML Download