

 PDF
PDF Citation
 Print
Print


Introduction
The detection of thyroid nodules has been increased since ultrasonography commonly used for thyroid examination. Even very small sized nodules (1-2 mm) can be found by high resolution ultrasonography. In some prospective studies using ultrasonography, 20 to 70 percent of subjects had thyroid nodules.1-3) Among them, only 5 to 10% of thyroid nodules are known to be malignant,4,5) and most are benign and requires no treatment throught the life. However, benign nodules also can cause clinical conditions requiring surgical treatment by compressive symptoms such as neck fullness, dysphagia, odynophagia, and dyspnea6) or some benign nodules have a malignant potential and may later be diagnosed with thyroid cancer.7) Therefore, when thyroid nodules with low or very low suspicious ultrasonographic pattern detected, 12 to 24 months of follow-up of ultrasonography is recommended.8,9) However, the adequate interval of follow-up to monitor the changes of nodular size is not yet determined, because there exists only limited knowledge about the changes; one report in iodine deficient area showed that 61.2% of benign thyroid nodules showed a continuous growth during 5 year follow-up,10) and the other report performed in moderately iodine-deficient area demostrtated that only one-third of benign thyroid nodules showed continuous growth during 40 months’ follow-up.11)
Because the relation between iodine deficiency and occurrence of goiter and hypothyroidism is well established,12) those result could suggest iodine-deficiency as a risk factor of changes in nodular size. Also, a study in China showed the possibe relation between iodine and the risk for the occurrence of diffuse goiter showed U-shape curve in the 3 areas with different iodine intakes,13) suggesting a possible difference in the natural history of benign thyroid nodules in iodine sufficient condition compared with iodine deficient area. However, there is only a few studies reported unitl now.14,15)
It is not yet clear what risk factors influence the change in nodule size except iodine supplementation status. However, previous studies have suggested that metabolic abnormalities, such as imparied glucose metabolism,16) metabolic syndrome and insulin resistance17) and type 2 diabetes melliuts,18) may affect the thyroid volume and nodule prevalence. Therefore, it is possible that these metabolic abnormalities affect the change in nodule size.
Korea belongs to the iodine sufficient area19) and thyroid ultrasonography has been performed very commonly for the health checkups. So, to investigate the changes of nodular size in iodine sufficient area, we retrospectively analysed the size change of benign thyroid nodules using a relatively large database of the health checkups in two large heathcare centers. Also we evaluate predictive clinical factors for the changes of thyroid nodule size.
Go to : 
Materials and Methods
Subjects
From 2003 to 2011, 19,058 subjects underwent thyroid sonography 2 or more times in Seoul National University Hospital Healthcare System or the Health Promotion Center of Seoul National Bundang Hospital. Among the subject, 9935 showed no nodule and 941 had only pure cysts at initial sonography. Remained 8182 subjects showed one or more pure solid or mixed solid and cystic nodule(s) at baseline exammination. Among them, 303 subjects were excluded because the duration of follow-up was less than 3 months, and 126 were also excluded because they underwent some management for the nodules during the follow-up period; 125 underwent surgery and 1 radiofrequency ablation. Finally, 7753 were included in this study (male 41.7%, mean age 52.1±9.4 years old). Their median duration of follow up was 27.0 months (interquartile range [IQR] 13.3–48.1), and the number of sonography underwent was mean 3.1±1.4 (median [IQR] 3.0 [2.0–4.0]) times. We retrospecitvely reviewed the medical records of all subjects about sex, age, date and numbers of thyroid sonography, nodule size, body mass index, waist circumference, body fat %, systolic and diastolic blood pressure, smoking history and laborytory results including thyroid stimulating hormone (TSH), free T4, fasting glucose, HbA1c, and total cholesterol. Blood samples were taken from all participants after overnight fasting. The protocols of all laboratory tests were identical to that of our previous study.20) When we analyzed for each parameter, we excluded the case of taking drugs that could affect the result of each parameter (e.g., thyroid hormone, anti-hypertensive or anti-diabetic medication, etc.).
Thyroid sonographic examination was performed in our health care centers by several radiologists using high-resolution ultrasonography. Thyroid nodules were defined as one or more discrete lesions which were within the thyroid gland but radiologically distinct from surrounding thyroid parenchyma. If there are coexistence of cyst and nodule in one patient, we classified it as a nodule. We used the maximal diameter of nodule recorded at baseline examination as its representative, and then compared final maximal diameter of the nodule at last follow up exammination. When multiple nodules were found, we measured maximal diameter of largest nodule and compared the size change of that nodule. Significant change was defined when maximal diameter increased or decreased 3 mm or more to minimize operator-dependent differences in size assessement.21) Heterogeneous echogenicity includes coarse or diffuse micronodulative patterns without definite focal nodule. They had decreased or increased parenchymal echogenicity, which was established by comparing the brightness of the echoes from the thyroid with those from the surrounding neck muscles and connective tissue.22) This study was approved by the Institutional Review Board (IRB) and ethics committe of Seoul National Univeristy Hospital (No 1106-113-367) and Seoul National Univeristy Bundang Hospital (No B-1107-132-007).
Statistical Analysis
Comparisons between two groups (no change vs. decreased or increased group) were analyzed by Mann-Whitney’s U test for continuous variables. Continuous variables were expressed as mean±standard deviation (SD). For categorical variables, we used χ2 test. Two-sided p<0.05 was considered significant. Multivariate logistic regression analysis was used to evaluate the influence of several risk factors to changes of nodule size. Confidence intervals (CIs) were set to 95%. Time to changes of nodule size was determined by using life-table methods. We performed Cox proportional hazard regression to evaluate the effect of age, sex, initial size of nodules, TSH, smoking, body mass index, fasting glucose, total cholesterol and diffuse parenchymal abnormality to changes of nodule size. Data were analyzed by using IBM SPSS statistics, version 20 (IBM, Chicago, IL, USA).
Go to :
Results
Changes of Nodule Size According to the Duration of Follow-Up
When we compare the size of last examination with the initial result, thyroid nodules were decreased in 895 subjects (11.5% of total) during median 35.2 months of follow-up (ranges 3.0-87.3 months) and increased in 1041 subjects (13.5%) during median 37.1 months (ranges 3.0-91.3 months). Thyroid nodule was unchanged in 5817 subjects (75.0%) during median 25.7 months (ranges 3.0-91.3 months).
To examined the changes of nodular sizes according to each follow-up durations, we calcuated the rate of change by the year (Fig. 1A). In this analysis, the results of all sonographic examination performed during the follow-up in one subject were included regardless of the number. Subsequent thyroid sonography was done within 1 year of follow-up in 1834 sujbects. Among them, nodules were increased in 145 (7.9%) and decreased in 194 (10.6%). The rate of increased nodule was on an increasing trend according to the duration (annual percent change 2.6%, p<0.001), and after 5 years or more of follow-up, 21.4% of 885 nodules were increased. In contrast, the rate of decreased nodule was unchanged during the follow-up; 11.8% of nodules were decreased after 5 and more years of follow-up.
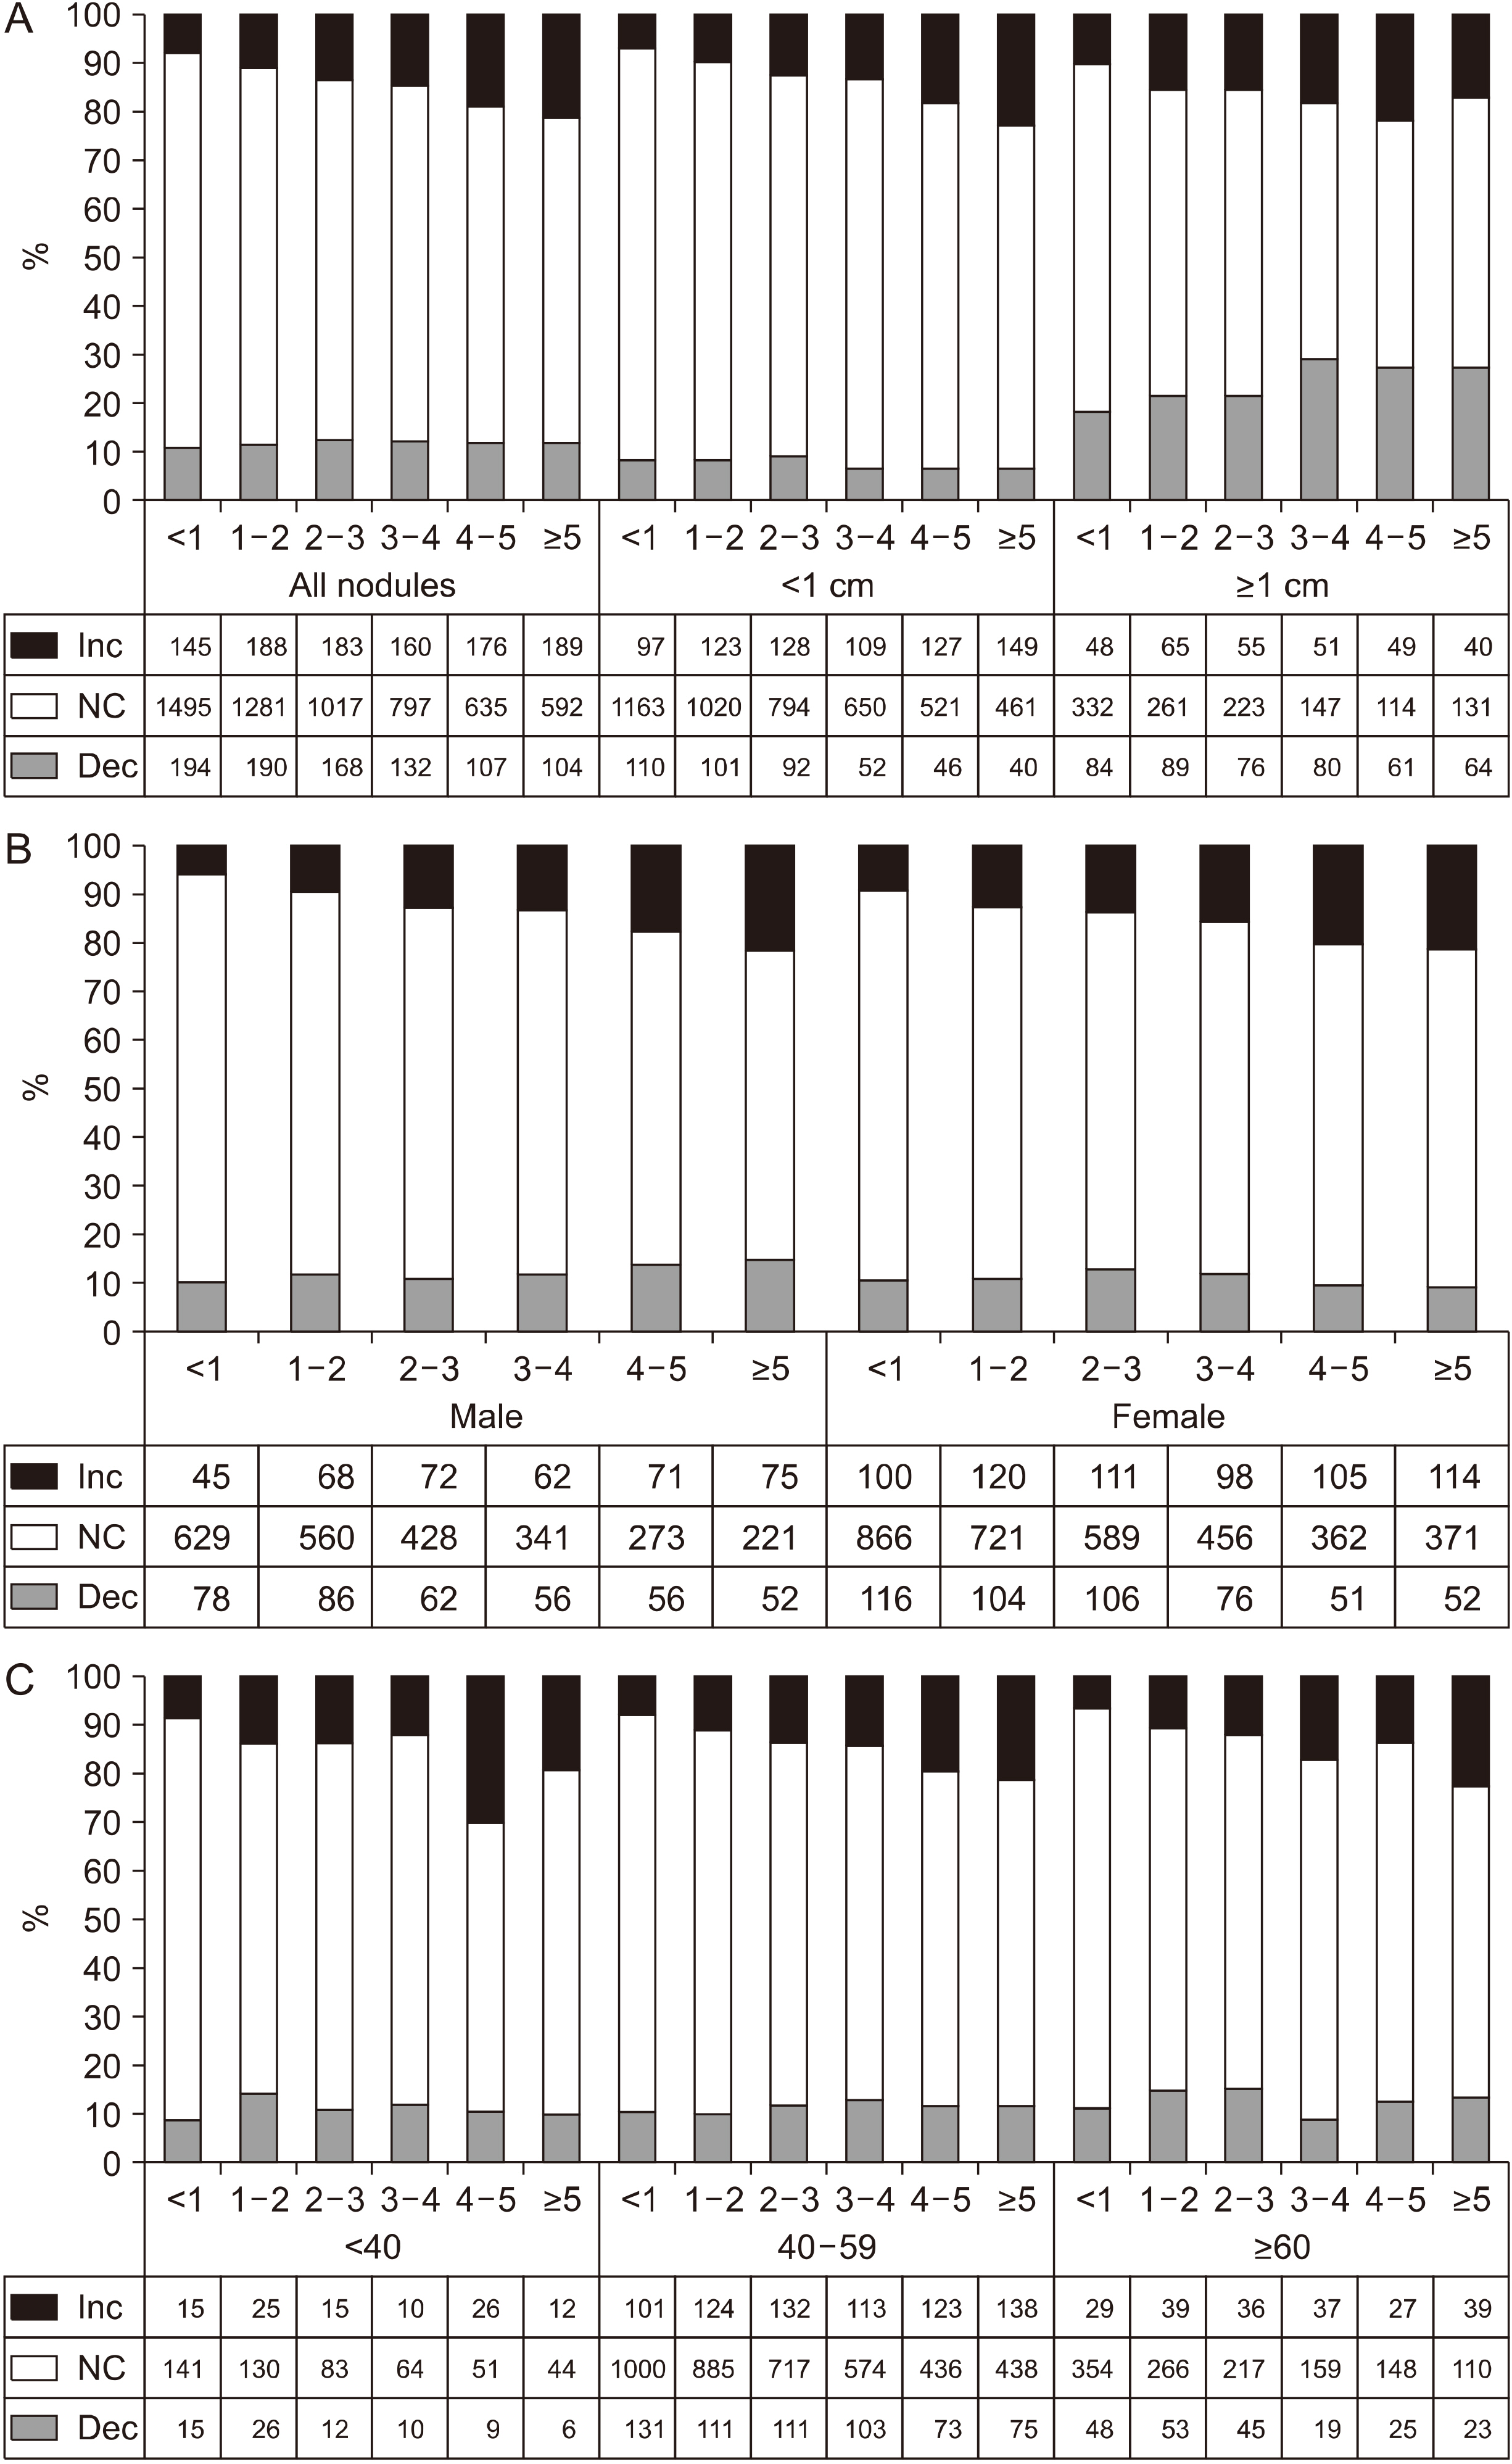 | Fig. 1The rate of change in the size of the thyroid nodules according to the follow-up period (years), the numbers (<1, 1-2, 2-3, 3-4, 4-5, >5) on the horizontal axis indicate the duration of follow-up of the nodule. (A). All nodules and when divided by size (1 cm). (B) When divided by gender. (C) When divided by age categories (<40, 40-59, ≥60 years). Dec: decrease, Inc: increase, NC: no change
|
When we investigated the changes based on the initial size of the nodule, the incresing rate or its time-trend was similar to the total nodules in less than 1 cm (annaul pecent change 3.0%, p<0.001; Fig. 1A). While increasing trend was not significant in nodules sized 1 cm or more. The reduction rate in nodule size did not chagned over time, but, the nodules less than 1 cm had significantly less reduction than all nodules (mean 7.4±1.2 vs. 11.7±0.6%, p=0.002). While the nodules sized 1 cm or more showed greater reduction rate than all nodules (mean 24.0±4.3 vs. 11.7±0.6%, p=0.002). The pattern of nodule change was similar when we classified the nodule by gender or age (Fig. 1B, 1C).
Comparison of Baseline Demographic or Clinical Characteristics of Subjects According to the Change of Noduar Size
Baseline demographic or clinical characteristics of subjects showing no change, decrease, or increase of their nodular size were summarized in Table 1. Comparison was made between no change group and decreased or increased group. There was no significant difference of age and sex among the groups except more female percentage was shown in increased group (57.8% vs. 62.2%). Significant difference was observed in follow-up duration, baseline size, rate of diffuse parenchymal abnormality and rate of abnormal TSH in both increased and decreased group. As expectedly, both groups showed longer duration of follow-up, larger size and more rate of diffuse parenchymal abnormality and abnormal TSH than no change group (Table 1).
Table 1
Baseline characteristics of study subjects according to changes of nodule size
| Size of thyroid nodule | Total | No change | Decreased† | Increased† |
|---|---|---|---|---|
| N (%) | 7753 | 5817 (75.0) | 895 (11.5) | 1041 (13.5) |
| Sex | ||||
| Male (%) | 3235 (41.7) | 2452 (42.2) | 390 (43.6) | 393 (37.8)§ |
| Female (%) | 4518 (58.3) | 3365 (57.8) | 505 (56.4) | 648 (62.2)§ |
| Age (years), mean±SD | 52.1±9.4 | 52.1±9.4 | 52.1±9.5 | 51.7±9.5 |
| <40 | 694 (9.0) | 513 (8.8) | 78 (8.7) | 103 (9.9) |
| 40-59 | 5385 (69.5) | 4050 (69.6) | 604 (67.5) | 731 (70.2) |
| ≥60 | 1674 (21.5) | 1254 (21.6) | 213 (23.8) | 207 (19.9) |
| Numbers of thyroid ultrasound, mean±SD | 3.1±1.4 | 3.0±1.4 | 2.9±1.3 | 3.5±1.7§ |
| Duration of follow up (months), mean±SD (median, ranges) |
32.4±20.7 (27.0, 3.0-91.3) |
30.8±20.3 (25.7, 3.0-91.3) |
36.1±21.1‡ (35.2, 3.0-87.4) | 39.1±21.3§ (37.1, 3.0-91.3) |
| Size at baseline (mm), mean±SD | 8.2±5.7 | 7.5±4.9 | 11.5±7.3‡ | 9.1±7.1§ |
| <5.0 | 2165 (27.9) | 1750 (30.1/80.8) | 125 (14.0/5.8)‡ | 290 (27.9/13.4)§ |
| 5.0-9.9 | 3618 (46.7) | 2859 (49.1/79.0) | 316 (35.3/8.7)‡ | 443 (42.6/12.2)§ |
| 10.0-19.9 | 1595 (20.6) | 1029 (17.7/64.5) | 346 (38.7/21.7)‡ | 220 (21.1/13.8)§ |
| ≥20.0 | 375 (4.8) | 179 (3.1/47.7) | 108 (12.1/28.8)‡ | 88 (8.5/23.5)§ |
| Diffuse parenchymal abnormality (%)* | 8.2 | 6.7 | 15.3‡ | 10.5§ |
| TSH (mU/L), mean±SD | 2.0±3.1 | 2.0±3.4 | 2.1±2.6 | 1.9±1.8§ |
| <0.4 | 193 (2.6) | 118 (2.1) | 38 (4.5)‡ | 37 (3.7)§ |
| 0.4-4.1 | 6831 (91.8) | 5183 (92.5) | 752 (89.1)‡ | 896 (89.7)§ |
| >4.1 | 420 (5.6) | 300 (5.4) | 54 (6.4)‡ | 65 (6.6)§ |
| Free T4 (ng/dL), mean±SD | 1.24±0.30 | 1.23±0.28 | 1.26±0.43 | 1.23±0.24 |
| Smoking (ex-smoker or current smoker) (%) | 38.1 | 38.3 | 37.8 | 36.9 |
| Systolic blood pressure (mmHg), mean±SD | 117.9±16.2 | 117.7±16.1 | 118.4±15.6 | 118.4±16.8 |
| Diastolic blood pressure (mmHg), mean±SD | 75.8±11.9 | 75.7±11.9 | 76.4±11.6 | 76.2±12.2 |
| Body mass index (kg/m2), mean±SD | 23.4±2.9 | 23.4±2.9 | 23.6±2.9 | 23.4±2.9 |
| Waist circumference (cm), mean±SD | 84.5±8.1 | 84.5±8.1 | 84.9±8.1 | 84.3±8.1 |
| Body fat (%) | 26.5±5.7 | 26.4±5.7 | 26.7±5.7 | 27.0±5.6 |
| Fasting glucose (mg/dL) | 98.1±17.9 | 97.9±17.9 | 98.7±17.3‡ | 98.7±18.0 |
| HbA1c | 5.74±0.60 | 5.75±0.61 | 5.75±0.54 | 5.72±0.61 |
| <6.5% | 6791 (92.9) | 5128 (93.1) | 765 (93.1) | 898 (91.7) |
| ≥6.5% | 520 (7.1) | 382 (6.9) | 57 (6.9) | 81 (8.3) |
| Total cholesterol (mg/dL) | 198.2±34.1 | 197.8±34.0 | 200.8±33.9‡ | 198.7±35.2 |
![]()
Both changes in nodular size were observed more frequently in large-sized nodules, especially, the decreasing rate was significantly increased in nodules larger than 1 cm was more (21.7% in 10.0-19.9 mm sized nodules, 28.8% in nodules sized 2 cm or more) than smaller sized group (5.8 and 8.7% in nodules sized <0.5 and 5.0-9.9 mm), on the other hand, the increasing rate of nodules appeared to be significantly higher in nodules sized 2 cm or more (23.5% vs. 12.2-13.8%, p<0.05).
Interestingly, both decreasing (15.3% vs. 6.7% of no change group, p<0.001) and increasing (10.5% vs. 6.7% of no change group, p<0.001) rate was elevated with the presence of thyroiditis, and the difference was larger in decreasing group. The changes of nodular size are also more common among subjects showing abnormal TSH levels, whether it is decreased or elevated, than those with normal TSH levels and it was more obvious in subjects with TSH levels less than 0.4 mU/L. However, free T4 levels were not different among the groups.
In metabolic parameters, decreased group showed higher fasting glucose and cholesterol level than no change group although the differences of those parameters were only minimal. Smoking status or blood pressure was also similar among the groups.
Because the nodules larger than 1 cm are now recommended for the further evaluation,23) we did same analysis for larger nodules larger than 1 cm (Table 2). In most parameters, the difference of characteristics was similar to the results of all sized nodules in Table 1, however the statistical significance was diminished in some parameters; rate of diffuse parenchymal abnormality was not shown significant difference and abnormal TSH level was different only in increased group. Interestingly, age was younger in increased group, and although there was no statistical significance, the proportion of size-decreased nodules was lower (20.7% in age less than 40 years group vs. 22.4% in 40-59 years old group or 25.4% in age 60 years or more group, p=0.543) and that of size-increased nodules was higher (22.1% in age less than 40 years group vs. 15.9% in 40-59 years old group or 13.2% in age 60 years or more group, p=0.060) in younger age group. Male sex was significantly higher in decreased group. Duration of follow-up was still longer, and size of nodule was larger in both decreased and increased group.
Table 2
Baseline characteristics of study subjects according to changes of nodule size in thyroid nodules 1 cm
| Total | No change | Decreased† | Increased† | |
|---|---|---|---|---|
| N | 1970 | 1208 (61.3) | 454 (23.0) | 308 (15.6) |
| Sex | ||||
| Male (%) | 784 (39.8) | 465 (38.5) | 203 (44.7)‡ | 116 (37.7) |
| Female (%) | 1186 (60.2) | 743 (61.5) | 251 (55.3) | 192 (62.3) |
| Age (years old) | 53.2±9.7 | 53.4±9.7 | 53.7±9.6 | 52.0±10.1§ |
| <40 | 145 (7.4) | 83 (6.9) | 30 (6.6) | 32 (10.4) |
| 40-59 | 1310 (66.5) | 809 (67.0) | 293 (64.5) | 208 (67.5) |
| ≥60 | 515 (26.1) | 316 (26.2) | 131 (28.9) | 68 (22.1) |
| Numbers of thyroid sonography | 3.0±1.4 | 2.9±1.4 | 3.2±1.5‡ | 3.3±1.7§ |
| Duration of follow up (months)mean±SD (median, ranges) |
32.5±21.1 (27.8, 3.0-90.7) |
30.2±20.8 (25.2, 3.0-90.7) |
35.6±21.2‡ (35.1, 3.0-87.4) | 36.1±20.5§ (35.0, 3.0-85.9) |
| Initial nodule size (mm) | 15.6±6.5 | 14.9±5.9 | 16.5±7.0‡ | 17.0±7.7§ |
| 10.0-19.9 | 1595 (81.0) | 1029 (64.5) | 346 (21.7)‡ | 220 (13.8)§ |
| ≥20.0 | 375 (19.0) | 179 (47.7) | 108 (28.8) | 88 (23.5) |
| Diffuse parenchymal abnormality (%) | 8.6 | 7.5 | 10.8 | 9.6 |
| TSH (mU/L) | 1.93±2.76 | 1.91±2.87 | 2.10±3.16 | 1.78±1.27 |
| <0.4 | 65 (3.6) | 31 (2.8/47.7) | 16 (3.9/24.6) | 18 (6.4/27.7)§ |
| 0.4-4.1 | 1654 (91.3) | 1030 (92.5/62.3) | 375 (90.4/22.7) | 249 (88.0/15.0) |
| >4.1 | 93 (5.1) | 53 (4.8/57.0) | 24 (5.8/25.8) | 16 (5.7/17.2) |
| Free T4 (ng/dL) | 1.24±0.33 | 1.23±0.33 | 1.25±0.38 | 1.25±0.25 |
| Smoking (ex-smoker or current smoker) (%) | 36.9 | 36.5 | 38.0 | 36.4 |
| Systolic blood pressure (mmHg) | 118.9±16.4 | 118.5±16.6 | 119.8±16.0 | 119.2±16.4 |
| Diastolic blood pressure (mmHg) | 76.0±11.6 | 75.6±11.8 | 77.2±11.3‡ | 75.7±11.3 |
| Body mass index (kg/m2) | 23.6±2.9 | 23.6±2.9 | 23.7±3.0 | 23.7±2.8 |
| Waist circumference (cm) | 85.0±8.2 | 85.0±8.2 | 85.2±8.3 | 84.7±8.2 |
| Body fat (%) | 27.1±5.8 | 27.0±5.9 | 27.0±5.7 | 27.7±5.5 |
| Fasting glucose (mg/dL) | 99.4±19.2 | 98.6±20.7 | 98.6±15.5 | 99.8±17.9 |
| HbA1c | 5.79±0.64 | 5.81±0.69 | 5.73±0.50 | 5.76±0.65 |
| <6.5% | 1627 (91.4) | 993 (90.5) | 379 (93.6) | 255 (91.4) |
| ≥6.5% | 154 (8.6) | 104 (9.5) | 26 (6.4) | 24 (8.6) |
| Total cholesterol (mg/dL) | 198.4±34.9 | 197.4±34.3 | 200.4±33.9 | 199.3±38.1 |
![]()
Predictive Factors Associated with Size Changes of Thyroid Nodules
To know predictive factors associated with size changes of thyroid nodule, we evaluated the effects of several variables by Cox proportional hazards regression analysis. As shown Table 3, the significant risk factors related to the reduction of the size of thyroid nodule were young age, male sex, larger initial nodule size, and thyroiditis. In contrast, regarding the increase in the size of the thyroid nodule, young age, larger initial nodule size and diffuse parenchymal abnormality were significant risk factors. We did same analysis for 1 cm or more thyroid nodules, and as a result, the factors associated with reduction still male sex and larger size. In addition, young age and large initial nodule size were still identified as risk factors for size increase in nodules larger than 1 cm. When analyzing thyroid nodules sized 1 cm or more, the effect of diffuse parenchymal abnormality on size increase was not statistically significant.
Table 3
Risk factors for changing thyroid nodules by cox proportional hazard model using backward elimination method
![]()
Go to :
Discussion
In this study, 13.4% of thyroid nodules were increased in size and 11.5% were decreased during median 27.0 (3.0-91.3) months of follow-up. Young age, male sex, larger initial nodule size and diffuse parenchymal abnormality were related to the decreased size of nodues. Young age, larger nodule size and diffuse parenchymal abnormality also affect the increasing of thyroid nodules. However, the effect of diffuse parenchymal abnormality for size change was not observed in larger nodules sized 1 cm or more. Metabolic factors such as fasting blood glucose, cholesterol, and BMI did not affect the change in nodule size.
The increasing rate of thyroid nodule was previously reported from 4.0 to 61.2%10,11,15,24,25) and decreasing rate was from 13.1 to 33.1%10,11,25) according to various criteria or duration of follow-up in each study. These criteria of size change of those previous studies were as follows: more than 15% or 30% change in volume,10,15,24) 50%11,15) or 3 mm of increase15) in nodule maximal diameter or a 20% increase ≥2 nodule diameters with a minimum increase of 2 mm.25) In our study, we defined significant change when maximal diameter increased or decreased 3 mm or more,21) and this criterion includes more patients compared to the criterion in which the maximum diameter changes by 50% or more, and fewer patients than the criterion in which the calculated volume changes by 15% or more.15) Based on these results, we applied a criterion for a change of at least 3 mm in diameter. Alexander et al.15) reported 26% increasing rate when they used same criteria to our study in maximal diameter of ≥3 mm during mean 20 months of follow-up. This study was conducted in United states and this is an area with sufficient iodine.
Iodine deficiency is the most important etiologic factor for goiter development and hypothyroidism,26) while contrary result is also exist that insufficient iodine supply induced goiter.12) For growth of thyroid nodule, Quadbeck et al.10) reported 61.2% of the nodule increased ≥30% in volume during 5-year follow-up in iodine deficient area. Relatively small proportion (13.5%) of thyroid nodules were increased in our study during similar duration of follow up. Similary, the cumulative incidence of nodular goiter was significantly smaller in iodine excessive area than mildly deficient area (0.8% vs. 5.0%) in recent study.13) In other words, our results suggest that where there is sufficient iodine, such as in South Korea, the likelihood of a change in the size of the nodule is lower than where it lacks iodine. Those results support the etiologic relation of iodine status. It has been suggested that sufficient iodine supply could inhibit the increased secretion of TSH,27) and indeed, suppression of TSH with levothyroxine therapy could effectively prevente the increases of nodule size in long-term prospective study.28) However, in our study, when TSH was higher than normal (>4.1 mU/L), there was a tendency that a size change occurred, but it was confirmed in the Cox proportional hazard analysis that it was not a risk factor for size change of thyroid nodule.
About risk factors associated with thyroid nodule growth, several sonographic characteristics or clinical factors have been suggested in previous studies. Longer duration of follow-up and lower cystic component was significant predictors of nodule growth (volume change ≥15%) in a multivariate analysis.15) Hypoechoic nodule type was a statistically significant predictor of nodule growth (volume change ≥15%) in other study.11) In recent prospective study, the presence of multiple nodules, larger volume of main nodule (>0.2 ml) and male gender were associated with nodule growth, whereas old age (≥60 years) was associated with lower risk of growth.25) All of these results are those from iodine deficient area. In our results, larger size of thyorid nodule and young age were also significant risk factors for nodule growth, suggesting that these risk factors would be similar regardless of iodine-intake status.
Interestingly, in our study, thyroiditis, or parencymal change, was identified as a risk factor for size change of thyroid nodule. However, when we analyzed only the nodules with size of 1 cm or more, the effects of diffuse parenchymal abnormality disappeared. These results are likely to be caused by difficulty in distinguishing focal thyriditis from small hypoechoic thyroid nodules with ultrasonography.29) Therefore, it is possible that diffuse parenchymal abnormality which was mistaken for a small thyroid nodule may changed over time. Therefore, when we find a nodule less than 1 cm in size, it is necessary to determine the follow-up schedule considering that diffuse parenchymal abnormality and small thyroid nodules are difficult to differentiate.
Another interesting point of our result is that previous studies have published several data on elevated blood glucose and increased thyroid volume and nodule prevalence,16,17) and our results show no association between increased nodule size and elevated blood glucose.
This study has some limitations. First, cytologic confirmation (fine-needle aspiration) was not performed in our heathcare institutes, so we could not confirm whether any cytologic exammination was performed or what was the cytologic result after the exammination. However, we excluded subjects who underwent surgery for thyroid. The subjects who had nodules with indetermiate or maligant features on sonographic findings were routinely recommended fine needle aspiration during the follow-up, so, most nodules included in our study are possibly benign. A second potential limitation is a lack of other sonographic characteristics in the variables. Due to its retrospective nature, there was no unifed criteria for description of sonographic findings. So we could not include sonographic findings to the variables. Also due to interobserver variabltiy, we could not subdivied cystic component of thyroid nodules. In addition, although there is a high possibility of affecting the size change of the nodule depending on the ratio of the cystic portion in the nodule or the presence or absence of the cystic portion, it is difficult to analyze in our study, so a prospective study is needed in the future. Lastly, we compared only the largest nodules detected at initial exammination, so it is hard to tell exact change of the other thyroid nodules in process of time. Although these limitation, our study might provide very meaningful information because iodine intake is known to be a major environmental factor for thyroid nodular disease and there is scanty data about the changes of thyorid nodule in iodine sufficient condition.
In conclusion, 11.5–13.5% of benign thyroid nodules were increased or decreased during median 27 months of follow-up in iodine sufficient condition. Young age, larger initial size and diffuse parenchymal abnormality were common predictive factors affecting both the increase and decrease of thyroid nodules.
Go to :
 XML Download