Journal List > Ann Lab Med > v.41(1) > 1145840

Zou, Wang, Cheng, Ma, Lin, Hu, Yu, Xia, Li, Yin, Liu, Zhang, Zhang, Lian, Xu, and Qiu: Reference Intervals for Thyroid-Associated Hormones and the Prevalence of Thyroid Diseases in the Chinese Population

Abstract

Background

Thyroid diseases are highly prevalent worldwide, but their diagnosis remains a challenge. We established reference intervals (RIs) for thyroid-associated hormones and evaluated the prevalence of thyroid diseases in China.

Methods

After excluding outliers based on the results of ultrasound screening, thyroid antibody tests, and the Tukey method, the medical records of 20,303 euthyroid adults, who visited the Department of Health Care at Peking Union Medical College Hospital from January 2014 to December 2018, were analyzed. Thyroid-associated hormones were measured by the Siemens Advia Centaur XP analyzer. The RIs for thyroid-associated hormones were calculated according to the CLSI C28-A3 guidelines, and were compared with the RIs provided by Siemens. The prevalence of thyroid diseases over the five years was evaluated and compared using the chi-square test.

Results

The RIs for thyroid stimulating hormone (TSH), free thyroxine (FT4), free triiodothyronine (FT3), total thyroxine (TT4), and total triiodothyronine (TT3) were 0.71–4.92 mIU/L, 12.2–20.1 pmol/L, 3.9–6.0 pmol/L, 65.6–135.1 nmol/L, and 1.2–2.2 nmol/L, respectively. The RIs of all hormones except TT4 differed significantly between males and females. The RIs of TSH increased with increasing age. The prevalence of overt hypothyroidism, overt hyperthyroidism, subclinical hypothyroidism, and subclinical hyperthyroidism was 0.5% and 0.8%, 0.2% and 0.6%, 3.8% and 6.1%, and 3.3% and 4.7% in males and females, respectively, which differed from those provided by Siemens.

Conclusions

Sex-specific RIs were established for thyroid-associated hormones, and the prevalence of thyroid diseases was determined in the Chinese population.

INTRODUCTION

Thyroid diseases are associated with chronic diseases and an increased mortality; they are highly prevalent worldwide and require expensive treatment [1, 2]. Subclinical thyroid diseases have attracted substantial research attention owing to the difficulty in their diagnosis and treatment. It was estimated that 1.95% and 5.55% of adults in China suffer from subclinical hyperthyroidism and hypothyroidism, respectively, and 2–4% of these individuals will develop clinical thyroid diseases every year, depending on the levels of antithyroid peroxidase autoantibodies (TPO-Ab) and thyroid stimulating hormone (TSH) [3, 4]. Thus, accurate biochemical measurements are essential for making an appropriate diagnosis and initiating timely treatment for individuals suffering from these diseases.
The reference intervals (RIs) are essential for physicians for interpreting and evaluating the results of thyroid function tests, including the levels of TSH, free thyroxine (FT4), free triiodothyronine (FT3), total thyroxine (TT4), and total triiodothyronine (TT3) [5]. However, various clinical laboratories use the RIs proposed by the manufacturer of these tests, which are mainly based on data from non-Chinese populations. In addition to ethnicity, the RIs for thyroid-associated hormones are influenced by several other factors, including the time of day, age, sex, iodine levels, and inter-assay differences [68]. Considering these facts, each laboratory should establish population-based and method-specific RIs, as recommended by the International Federation of Clinical Chemistry, Clinical & Laboratory Standards Institute (CLSI), and American Thyroid Association [911].
RIs are generally established using direct methods that require strict exclusion criteria, which are typically expensive and time-consuming. An indirect method using big data from the database of a clinical laboratory and appropriate statistical procedures can be used to establish reliable and accurate RIs for thyroid-associated hormones and has already been demonstrated as a simpler, faster, and more cost-effective method than direct methods [1214]. However, a comprehensive assessment for five thyroid-associated hormones and thyroid diseases in a large cohort of healthy Chinese population is still lacking.
Therefore, we aimed to establish RIs for thyroid-associated hormones in euthyroid Chinese adults undergoing regular check-ups using chemiluminescence immunoassay and the indirect data mining approach and compared the obtained RIs with those provided by the manufacturer of the Advia Centaur XP automatic chemiluminescence immunoassay analyzer (Siemens, Berlin, Germany). Additionally, the prevalence of clinical and subclinical thyroid diseases in this population was evaluated over five years.

MATERIALS AND METHODS

Data collection

From January 1, 2014 to December 31, 2018, records of 280,206 healthy individuals were extracted from the Hospital Information System (HIS) and Laboratory Information System (LIS) of Peking Union Medical College Hospital (PUMCH), Beijing, China. Ultimately, data of 20,303 euthyroid individuals were included in this study and analyzed anonymously. The specific exclusion criteria are depicted in Supplemental Data Fig. S1.
Furthermore, a total of 150,431 individuals from 90,700 check-ups with thorough measurements of thyroid-associated hormones were selected to evaluate the prevalence of clinical and subclinical thyroid diseases. Overt hyperthyroidism was defined as TSH levels below the lower limit and both FT3 and FT4 levels above the upper limit, whereas overt hypothyroidism was defined as TSH levels above the upper limit and FT4 levels below the lower limit. Subclinical hypothyroidism was defined as serum TSH levels above the upper limit and FT4 levels within the RI [8], and subclinical hyperthyroidism was defined as serum TSH levels below the lower limit with normal levels of FT3 and FT4 [3].
All information was obtained from the medical records. The following analyses were performed for all individuals as part of their check-up. Individuals were asked to sit for 10–15 minutes, and then the height, weight, and blood pressure were measured by well-trained nurses and doctors. The body mass index (BMI) was calculated as the weight divided by the height squared. Fasting blood samples were drawn into 5 mL red-capped Vacuette tubes containing a procoagulant gel (Greiner Bio-One, Kremsmünster, Austria) and centrifuged at 3,000 rpm for 10 minutes. Five thyroid-associated hormones in fresh samples were assessed on a Siemens Advia Centaur XP automatic chemiluminescence immunoassay analyzer with the corresponding reagents, calibration materials, and quality control materials, ALT, creatinine (Cr), triglyceride (TG), total cholesterol (TC), and glucose (Glu) levels were measured using a Roche C8000 automatic biochemical analyzer (Roche, Mannheim, Germany) with the corresponding reagents, calibrators, and quality control materials.
This study was approved by the Ethics Committee of PUMCH. As this was a retrospective study, no informed consent was required (S-K766).

Statistical analysis

Excel 2010 (Microsoft Inc., Redmond, WA, USA), SPSS 20.1 software (IBM Inc., Armonk, NY, USA), and MedCalc Statistical Software 15.0 (Mariakerke, Belgium) were used for statistical analyses. Normally distributed data are presented as mean±SD, and non-normally distributed data are presented as median (interquartile range). Multiple regression analysis (MRA) was used to calculate partial correlation coefficients (rp) of main indices, including sex, age, BMI, and systolic blood pressure (SBP), for all five thyroid-associated hormones. All RIs of the thyroid-associated hormones were calculated as the median and 2.5th to 97.5th percentiles (P2.5P97.5), using the original data without outliers. The prevalence of thyroid diseases among the subgroups was compared by the chi-square test. The result was considered statistically significant when P was <0.05.

RESULTS

Demographic characteristics of the individuals enrolled in the study

The demographic characteristics of enrolled individuals are summarized in Table 1. The median age was 37 years, and the average BMI was 23.7 kg/m2. Although few RIs differed between the sexes, the females were generally younger than the males, with relatively lower BMI, SBP, diastolic blood pressure, ALT, Cr, TG, and Glu levels.

Distribution of thyroid-associated hormone levels according to sex

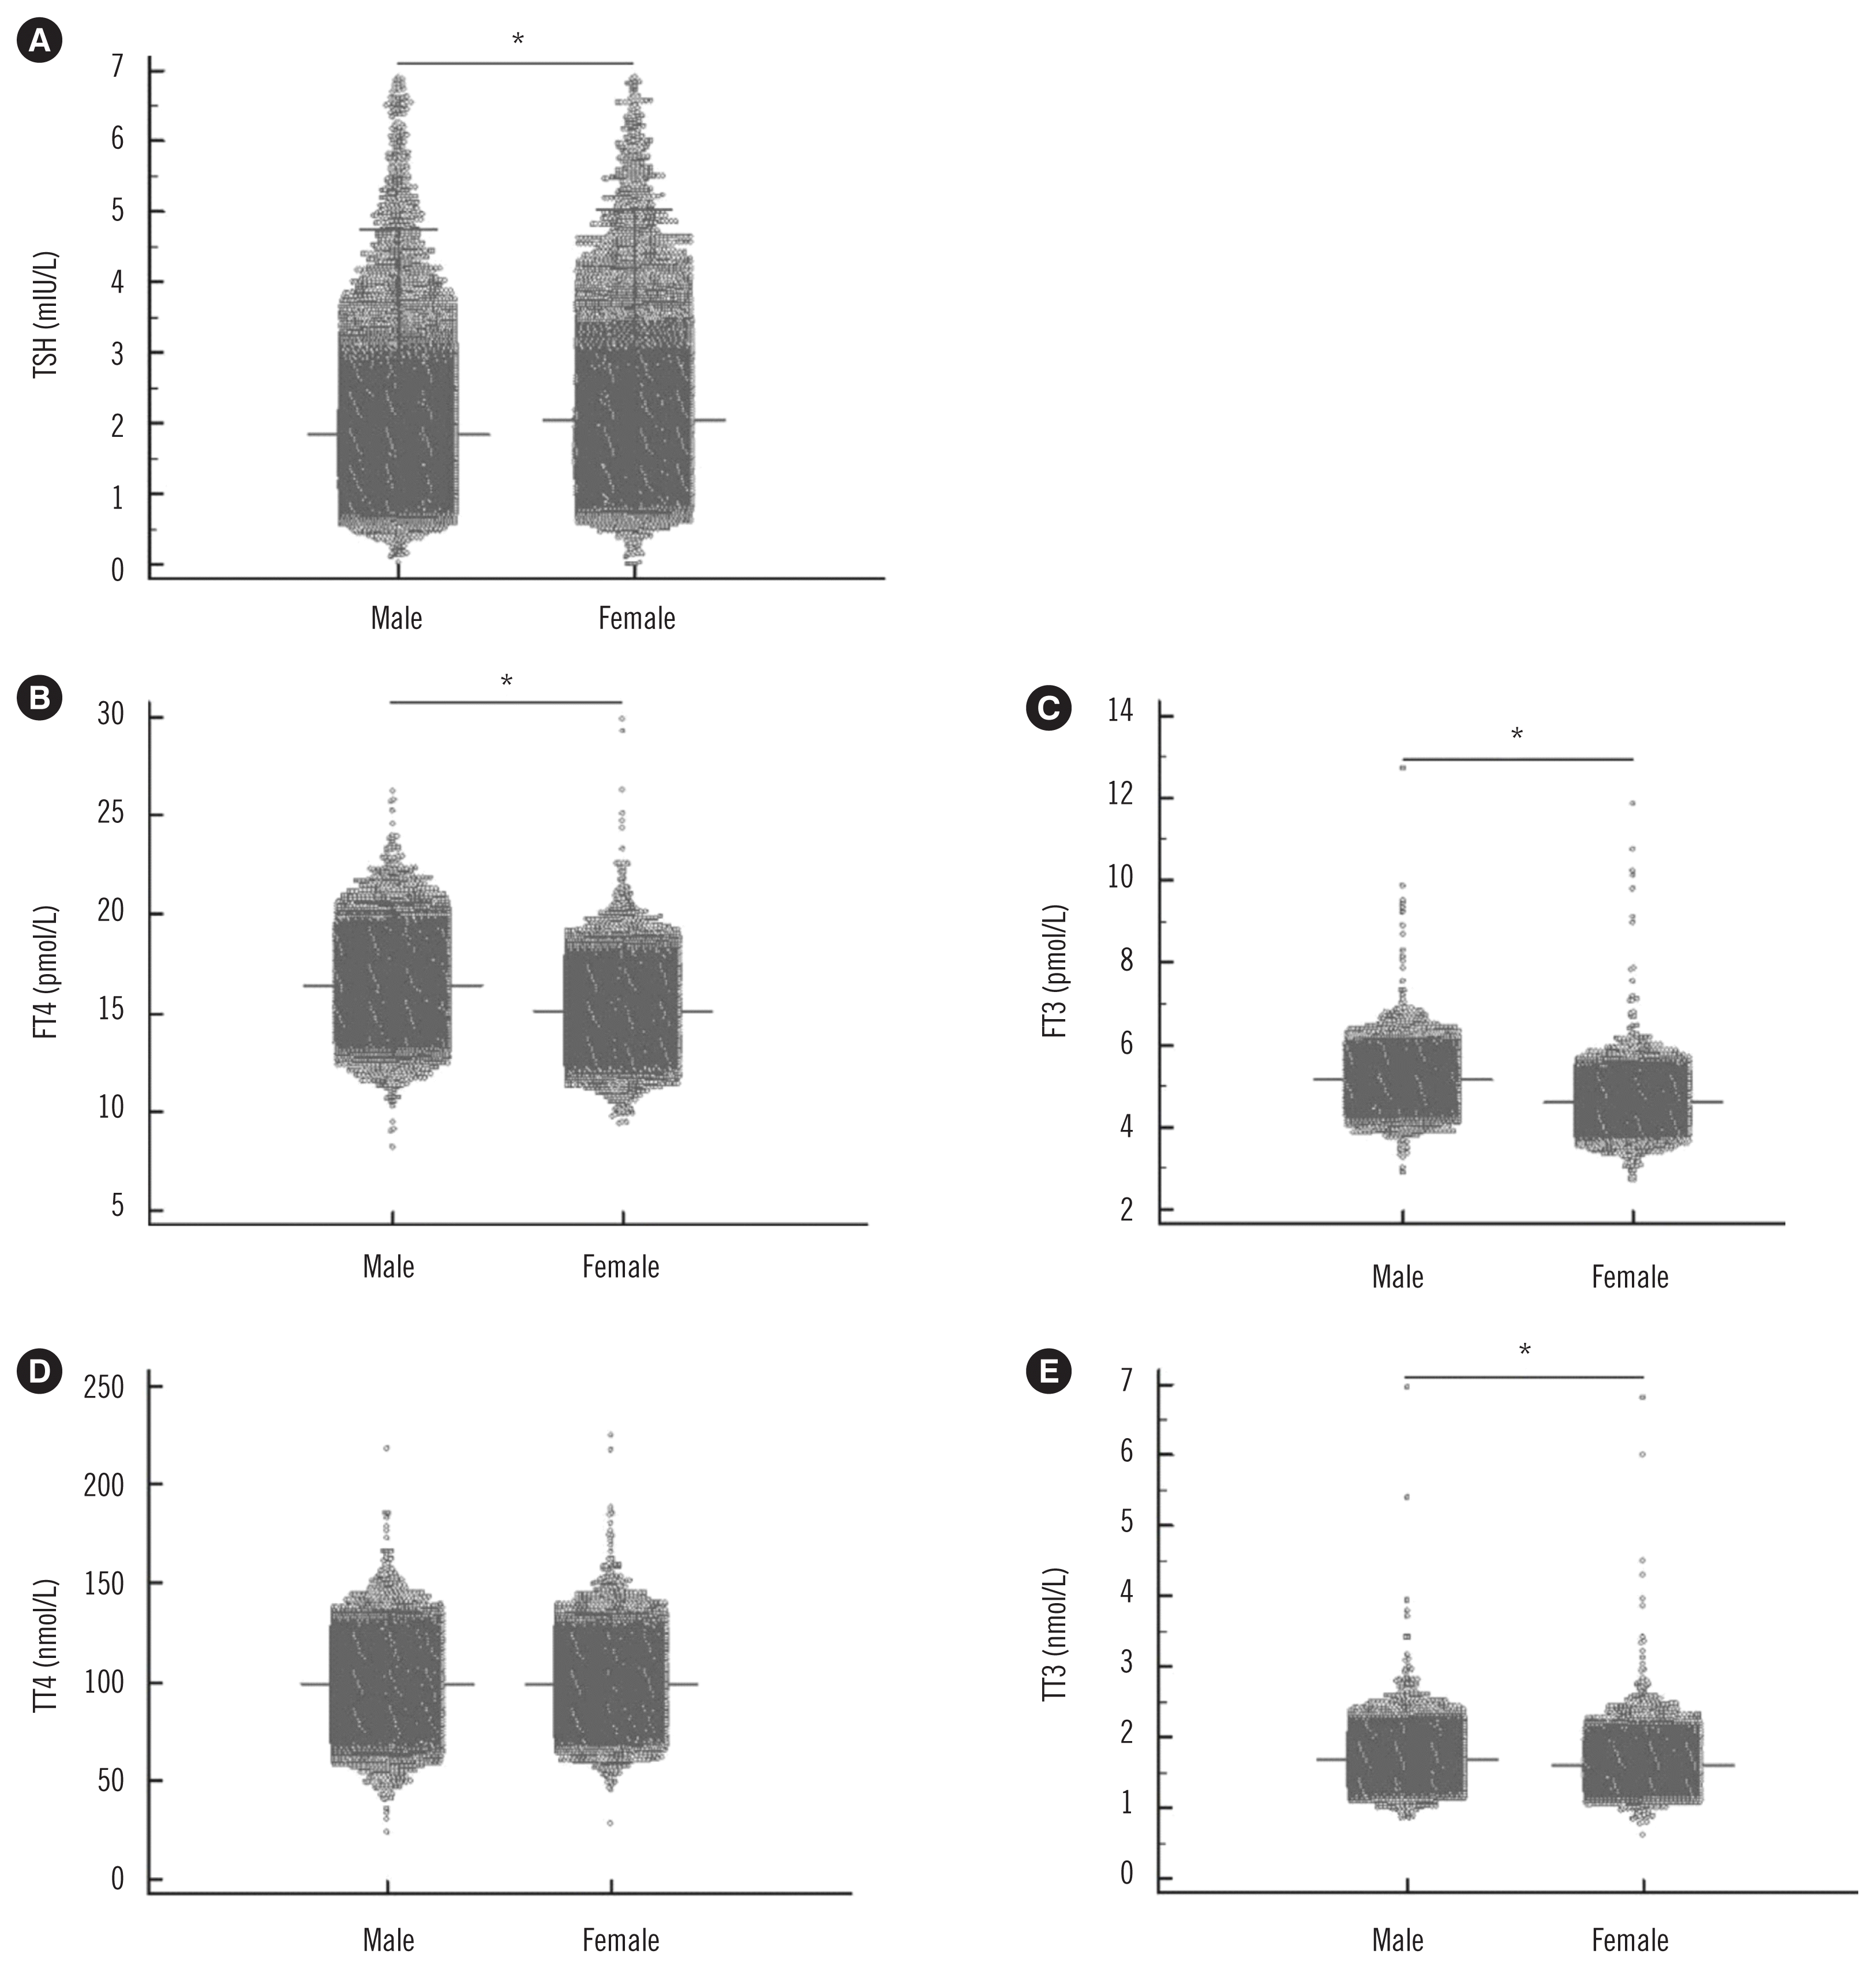
The results of MRA for all five thyroid-associated hormones are shown in Table 2. All coefficients for sex were significantly higher than those for other indices. Therefore, the distributions of thyroid-associated hormones are presented separately for females and males (Fig. 1). The serum TSH level was higher in females than in males (P<0.001). In contrast, the levels of FT4, FT3, and TT3 were higher in males than in females (all P<0.001). There was no sex difference for TT4 levels (P=0.226).

RIs for thyroid-associated hormones in the Chinese population

The RIs for the thyroid-associated hormones, namely, TSH, FT4, FT3, TT4, and TT3, in the euthyroid Chinese population without stratification by sex were 0.71–4.92 mIU/L, 12.2–20.1 pmol/L, 3.9–6.0 pmol/L, 65.6–135.1 nmol/L, and 1.2–2.2 nmol/L, respectively. Collectively, our data suggested that it would be useful to establish sex-specific RIs for these five hormones. Furthermore, the distribution of TSH increased with increasing age. Therefore, we divided the whole population into five subgroups according to the distribution of age (group 1: 19–29 years old, N=4,746; group 2: 30–39 years old, N=6,578; group 3: 40–49 years old, N=4,989; group 4: 50–59 years old, N=2,705; and group 5: ≥60 years old, N=1,285). Subgroup analysis and merging showed that the TSH distribution varied between two age groups (<50 years old and ≥50 years old). Moreover, the RIs provided by Siemens were modified for healthy people in China, as listed in Table 3. The RI for TSH, FT4, FT3, and TT3 was narrower and that for TT4 was lower than the values provided by Siemens.
The RIs for thyroid-associated hormones in other studies from different regions established with various methods and analytical platforms are summarized in Table 4; these values substantially differed from those obtained in this study [6, 1533]. Moreover, only a few studies excluded individuals based on thyroid ultrasound screening results.

Prevalence of thyroid diseases in the Chinese population

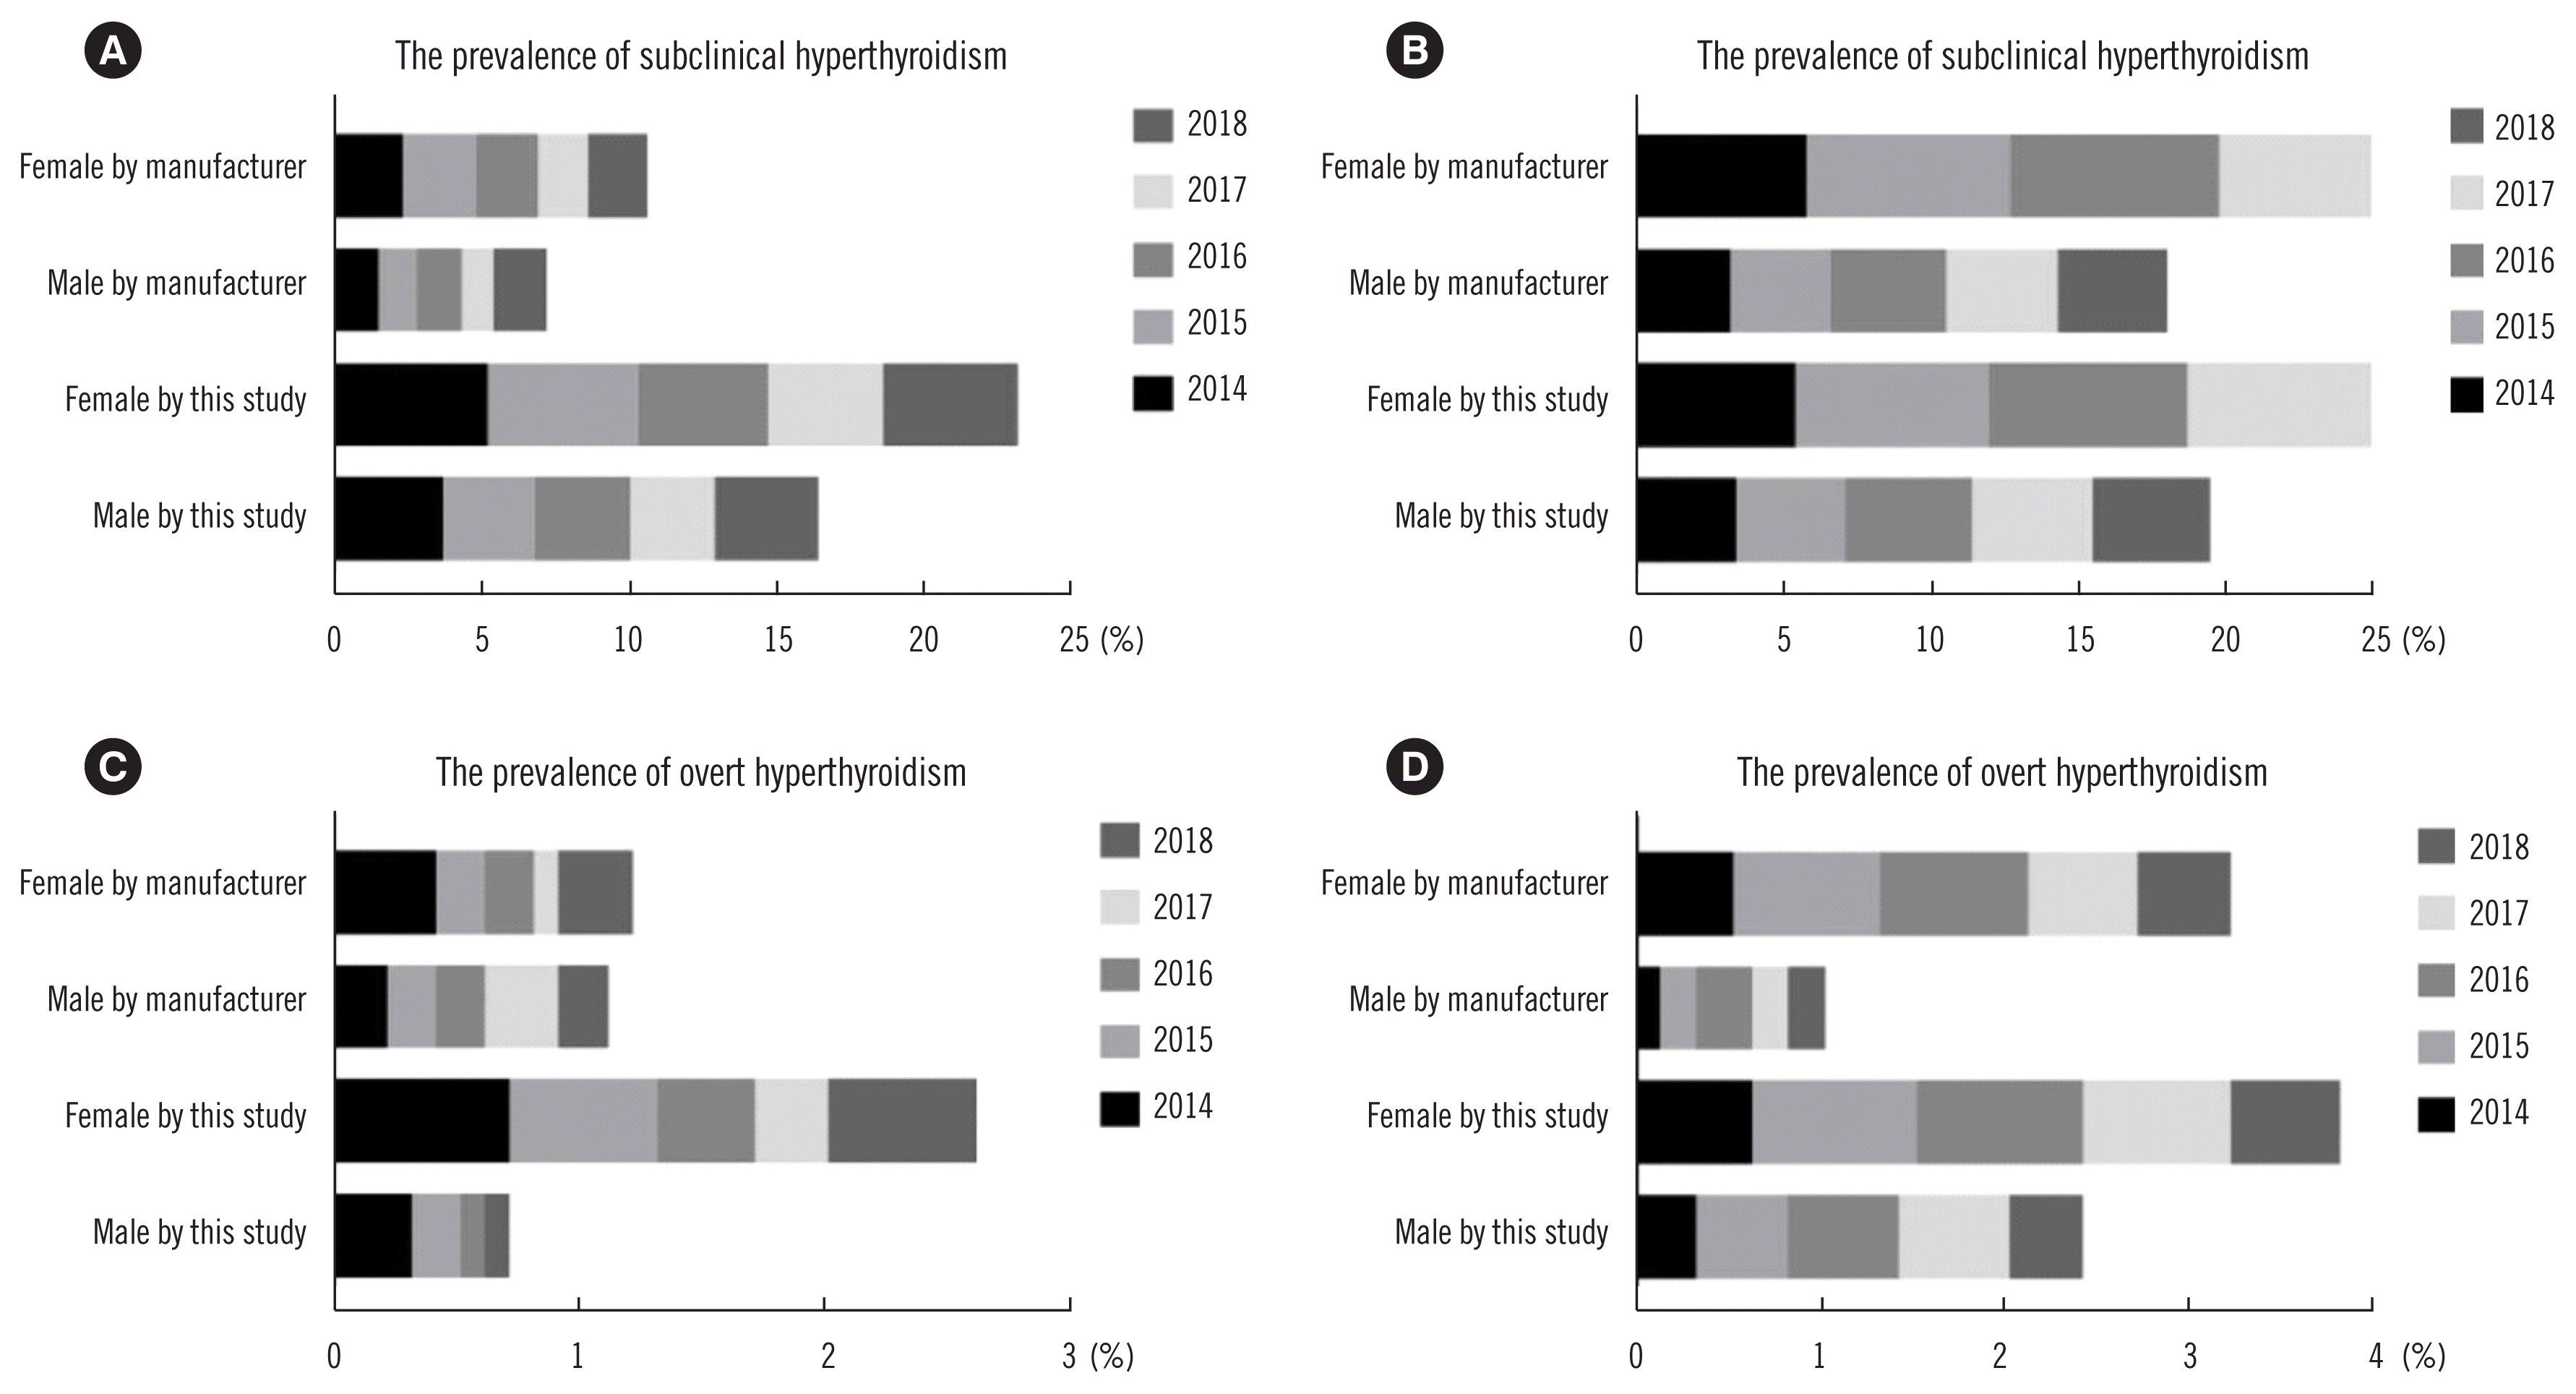
Among 90,700 records with consistent thyroid-associated hormone measurements, 8.6% (5.1% male, 11.8% female) were positive for TPO-Ab, 10.1% (4.4% male, 15.3% female) were positive for anti-thyroglobulin antibodies (TG-Ab), 4.5% were positive for both thyroid antibodies (2.0% male, 6.9% female), and 14.1% (7.5% male, 20.2% female) were positive for either TPO-Ab or TG-Ab. Therefore, the prevalence of abnormal thyroid antibodies was significantly higher in females than in males. Prevalence was also analyzed using our sex-specific RIs (Fig. 2). The distribution of both clinical and subclinical thyroid diseases was also determined using the RIs provided by Siemens. Compared with the results from Siemens, the prevalence of subclinical hyperthyroidism and overt hypothyroidism in both males and females was significantly higher in this study. In addition, the prevalence of overt hyperthyroidism in males was lower but higher in females (all P<0.001) than that calculated by Siemens. Furthermore, the prevalence of thyroid diseases was higher in females than in males overall (all P<0.001).

DISCUSSION

In this cross-sectional study, we downloaded all available data from the HIS and LIS of PUMCH. After eliminating individuals who did not meet the strict inclusion criteria, 20,303 individuals were included (i.e., 13.50% of the original database). All records regarding quality control, external quality assessment, and other changes during this period were reviewed and deemed to be sound. Several suitable statistical methods were used to analyze these data, and the RIs were defined according to the P2.5 and P97.5.
Significant differences were observed between males and females for TSH, FT3, FT4, and TT3 levels, and clear age-dependent shifts were observed for TSH. The sex-specific RIs for TT4 in our study were lower than the RIs suggested by Siemens. Our results are in accordance with those of some recent studies [16, 18]; however, they differ from other studies [5, 34]. In addition, we found a large difference between males and females for FT4 and FT3 (rp=−0.331 and −0.431, respectively), which was consistent with the study by Wang, et al. [30] but was greater than those found in other studies [5, 25]. These differences across studies may be due to the different exclusion criteria and characteristics of the populations and should be compared in future studies. Furthermore, compared with the RIs for TSH reported from the National Health and Nutrition Examination Survey III study [35], the modified RI used in our clinical laboratory was higher (TSH: 0.71–4.92 vs 0.45–4.12 mIU/L).
We further calculated the prevalence of clinical and subclinical thyroid diseases in both males and females, which were higher than those calculated by the RIs provided by Siemens, with the exception of the prevalence of subclinical hypothyroidism in females and overt hyperthyroidism in males. In addition, the prevalence of subclinical hypothyroidism and subclinical hyperthyroidism was higher than that reported in previous studies (5.0% vs 3.7% or 4.3%, and 4.0% vs 0.7% or 0.5%, respectively) [35, 36], which could lead to an inappropriate diagnosis and delayed treatment. Furthermore, we evaluated the percentages of TPO-Ab and TG-Ab positivity separately for males and females. Generally, females had a higher prevalence of thyroid diseases than males. Thus, consistent and reliable diagnostic criteria need to be established, and more regional studies need to be conducted.
Although previous studies [6, 1333] have established RIs for thyroid-associated hormones, the present study has several unique advantages. The indirect method used in this study is more convenient and economical, with no need for volunteer recruitment and additional measurements. We enrolled a large cohort of Chinese individuals undergoing health check-ups over a five-year period, and variation in results due to the use of different methods was prevented by conducting the analyses at the same facility (PUMCH). Furthermore, complete information, including the results of thyroid ultrasound and antibody tests, was available for all included individuals, according to the rigorous inclusion criteria, which was in accordance with the direct method [15]. Therefore, the established RIs may be more accurate and suitable for clinical laboratories. Nevertheless, this study has limitations. Due to the significant differences between different immunoassay methods [37], the RIs established in this study are most suitable for the Chinese population as measured by the Advia Centaur XP automatic chemiluminescence immunoassay analyzer. Additionally, the effects of age and sex have been reported to disappear when a population is more rigorously selected [38]. Although China is known to have a population with an adequate intake of dietary iodine, the iodine status, which has been associated with thyroid diseases, should be further evaluated [39].
Overall, our results emphasize the importance of establishing sex-specific RIs for thyroid-associated hormones, which could reduce the possibility of misclassification of patients with mildly reduced or elevated levels. Notably, more efforts are required to standardize or harmonize hormonal assays to reduce the biases and coefficients of variation between different methods [40]. Thus, more details need to be considered, and individuals should be assessed continuously in further specific clinical studies for an independent evaluation of the clinical efficiency of our established RIs.

Supplementary Information

Supplemental Data Fig. S1
Exclusion criteria used in this study. N=280,250: records of all health check-up conducted at Peking Union Medical College Hospital from January 1, 2014, to December 31, 2018. N=20,303: individuals finally enrolled in this study.
alm-2021-41-1-77s1.pdf

ACKNOWLEDGEMENTS

The authors want to specially thank the staff in the Department of Health Care of PUMCH for their hard work on data management.

Notes

AUTHOR CONTRIBUTIONS

LQ, TX, and XL designed this study. XC, LX, SL, YH, HL, DZ, and KZ carried out the measurements. YZ and DW wrote the paper. SY, YY, CM, and HL reviewed and edited the manuscript. All authors read and approved the manuscript.

CONFLICTS OF INTEREST

The authors have no conflict of interest to declare.

RESEARCH FUNDING

This work was funded by research grants from the Capital’s Funds for Health Improvement and Research (CFH-2020-1-4014), CAMS Initiative for Innovative Medicine (CAMS-2018-I2M-AI-005), and the Chinese Geriatrics Society (T/CGSS 014-2018) and Teaching reform project of Peking Union Medical College (10023201900101).

REFERENCES

1. M⊘llehave LT, Linneberg A, Skaaby T, Knudsen N, Ehlers L, J⊘rgensen T, et al. Trends in costs of thyroid disease treatment in Denmark during 1995–2015. Eur Thyroid J. 2018; 7:75–83.
crossref pmid pmc
2. Selmer C, Olesen JB, Hansen ML, von Kappelgaard LM, Madsen JC, Hansen PR, et al. Subclinical and overt thyroid dysfunction and risk of all-cause mortality and cardiovascular events: A large population study. J Clin Endocrinol Metab. 2014; 99:2372–82.
crossref pmid
3. Yan YR, Liu Y, Huang H, Lv QG, Gao XL, Jiang J, et al. Iodine nutrition and thyroid diseases in Chengdu, China: an epidemiological study. QJM. 2015; 108:379–85.
crossref pmid
4. Biondi B, Cappola AR, Cooper DS. Subclinical Hypothyroidism: a review. JAMA. 2019; 322:153–160.
5. Grasbeck R, Saris NE. Establishment and use of normal values. Scand J Clin Lab Invest. 1969; 26(S110):62–63.
6. Wang Y, Zhang YX, Zhou YL, Xia J. Establishment of reference intervals for serum thyroid-stimulating hormone, free and total thyroxine, and free and total triiodothyronine for the Beckman Coulter DxI-800 analyzers by indirect method using data obtained from Chinese population in Zhejiang Province, China. J Clin Lab Anal. 2017; 31:e22069.
7. Ehrenkranz J, Bach PR, Snow GL, Schneider A, Lee JL, Ilstrup S, et al. Circadian and circannual rhythms in thyroid hormones: determining the TSH and free T4 reference intervals based upon time of day, age, and sex. Thyroid. 2015; 25:954–61.
crossref pmid
8. Giovannini S, Zucchelli GC, Iervasi G, Iervasi A, Chiesa MR, Mercuri A, et al. Multicentre comparison of free thyroid hormones immunoassays: the Immunocheck study. Clin Chem Lab Med. 2011; 49:1669–76.
crossref pmid
9. Thienpont LM, Faix JD, Beastall G. Standardization of FT4 and harmonization of TSH measurements–a request for input from endocrinologists and other physicians. Endocr Pract. 2016; 22:374.
pmid
10. Solberg HE. International Federation of Clinical Chemistry. Scientific committee, Clinical Section. Expert Panel on Theory of Reference Values and International Committee for Standardization in Haematology Standing Committee on Reference Values. Approved recommendation (1986) on the theory of reference values. Part 1. The concept of reference values. J Clin Chem Clin Biochem. 1987; 25:337–42.
crossref
11. Alexander EK, Pearce EN, Brent GA, Brown RS, Chen H, Dosiou C, et al. 2017 Guidelines of the American Thyroid Association for the diagnosis and management of thyroid disease during pregnancy and the postpartum. Thyroid. 2017; 27:315–89.
crossref
12. Hoffmann RG. Statistics in the practice of medicine. JAMA. 1963; 185:864–73.
crossref
13. Han L, Zheng W, Zhai Y, Xie X, Zhang J, Zhang S, et al. Reference intervals of trimester-specific thyroid stimulating hormone and free thyroxine in Chinese women established by experimental and statistical methods. J Clin Lab Anal. 2018; 32:e22344.
crossref
14. Milinković N, Ignjatović S, Žarković M, Jovičić S, Radosavljević B, Singh S, et al. Indirect estimation of age-related reference limits of thyroid parameters: A cross-sectional study of outpatients’ results. Scand J Clin Lab Invest. 2014; 74:378–84.
crossref pmid
15. Clerico A, Trenti T, Aloe R, Dittadi R, Rizzardi S, Migliardi M, et al. A multicenter study for the evaluation of the reference interval for TSH in Italy (ELAS TSH Italian Study). Clin Chem Lab Med. 2018; 57:259–67.
crossref pmid
16. Park SY, Kim HI, Oh HK, Kim TH, Jang HW, Chung JH, et al. Age- and gender-specific reference intervals of TSH and free T4 in an iodine-replete area: data from Korean National Health and Nutrition Examination Survey IV (2013–2015). Plos One. 2018; 13:e0190738.
crossref
17. Ali NI, Alamoudi AO, Adam I. Reference intervals of thyroid hormones in a previously iodine-deficient area in Darfur, Sudan. Ther Adv Endocrinol Metab. 2018; 9:293–7.
crossref pmid pmc
18. Tozzoli R, D’Aurizio F, Metus P, Steffan A, Mazzon C, Bagnasco M. Reference intervals for thyrotropin in an area of Northern Italy: the Pordenone thyroid study (TRIPP). J Endocrinol Invest. 2018; 41:985–94.
crossref
19. Hickman PE, Koerbin G, Simpson A, Potter JM, Hughes DG, Abhayaratna WP, et al. Using a thyroid disease-free population to define the reference interval for TSH and free T4 on the Abbott Architect analyser. Clin Endocrinol (Oxf). 2017; 86:108–12.
crossref pmid
20. Barth JH, Spencer JD, Goodall SR, Luvai A. Reference intervals for thyroid hormones on Advia Centaur derived from three reference populations and a review of the literature. Ann Clin Biochem. 2016; 53:385–9.
crossref pmid
21. Kim M, Kim TY, Kim SH, Lee Y, Park SY, Kim HD, et al. Reference interval for thyrotropin in a ultrasonography screened Korean population. Korean J Intern Med. 2015; 30:335–44.
crossref pmid pmc
22. Sriphrapradang C, Pavarangkoon S, Jongjaroenprasert W, Chailurkit LO, Ongphiphadhanakul B, Aekplakorn W. Reference ranges of serum TSH, FT4, and thyroid autoantibodies in the Thai population: The National Health Examination Survey. Clin Endocrinol (Oxf). 2014; 80:751–6.
crossref pmid
23. Langén VL, Niiranen TJ, Mäki J, Sundvall J, Jula AM. Thyroid-stimulating hormone reference range and factors affecting it in a nationwide random sample. Clin Chem Lab Med. 2014; 52:1807–13.
crossref pmid
24. Kutluturk F, Yildirim B, Ozturk B, Ozyurt H, Bekar U, Sahin S, et al. The reference intervals of thyroid stimulating hormone in healthy individuals with normal levels of serum free thyroxine and without sonographic pathologies. Endocr Res. 2014; 39:56–60.
crossref pmid
25. Marwaha RK, Tandon N, Ganie MA, Mehan N, Sastry A, Garg MK, et al. Reference range of thyroid function (FT3, FT4 and TSH) among Indian adults. Clin Biochem. 2013; 46:341–5.
crossref pmid
26. Völzke H, Schmidt CO, John U, Wallaschofski H, Dörr M, Nauck M. Reference levels for serum thyroid function tests of diagnostic and prognostic significance. Horm Metab Res. 2010; 42:809–14.
crossref pmid
27. Ross HA, den Heijer M, Hermus AR, Sweep FC. Composite reference interval for thyroid-stimulating hormone and free thyroxine, comparison with common cutoff values, and reconsideration of subclinical thyroid disease. Clin Chem. 2009; 55:2019–25.
crossref pmid
28. Barth JH, Luvai A, Jassam N, Mbagaya W, Kilpatrick ES, Narayanan D, et al. Comparison of method-related reference intervals for thyroid hormones: studies from a prospective reference population and a literature review. Ann Clin Biochem. 2018; 55:107–12.
crossref pmid
29. Mirjanic-Azaric B, Avram S, Stojakovic-Jelisavac T, Stojanovic D, Petkovic M, Bogavac-Stanojevic N, et al. Direct estimation of reference intervals for thyroid parameters in the Republic of Srpska. J Med Biochem. 2017; 36:137–44.
crossref pmid pmc
30. Wang P, Gao YJ, Cheng J, Kong GL, Wang Y, Wu XY, et al. Serum thyroid hormone reference intervals in the apparently healthy individuals of Zhengzhou area of China. Genet Mol Res. 2014; 13:7275–81.
crossref pmid
31. Zarković M, Cirić J, Beleslin B, Cirić S, Bulat P, Topalov D, et al. Further studies on delineating thyroid-stimulating hormone (TSH) reference range. Horm Metab Res. 2011; 43:970–6.
crossref
32. Çavuşoğlu AÇ, Bilgili S, Erkızan Ö, Arıcan H, Karaca B. Thyroid hormone reference intervals and the prevalence of thyroid antibodies. Turk J Med Sci. 2014; 40:665–72.
33. Friis-Hansen L, Hilsted L. Reference intervals for thyreotropin and thyroid hormones for healthy adults based on the NOBIDA material and determined using a Modular E170. Clin Chem Lab Med. 2008; 46:1305–12.
crossref pmid
34. Roelfsema F, Pereira AM, Veldhuis JD, Adriaanse R, Endert E, Fliers E, et al. Thyrotropin secretion profiles are not different in men and women. J Clin Endocrinol Metab. 2009; 94:3964–7.
crossref pmid
35. Hollowell JG, Staehling NW, Flanders WD, Hannon WH, Gunter EW, Spencer CA, et al. Serum TSH, T(4), and thyroid antibodies in the United States population (1988 to 1994): National Health and Nutrition Examination Survey (NHANES III). J Clin Endocrinol Metab. 2002; 87:489–99.
crossref pmid
36. Aoki Y, Belin RM, Clickner R, Jeffries R, Phillips L, Mahaffey KR. Serum TSH and total T4 in the United States population and their association with participant characteristics: National Health and Nutrition Examination Survey (NHANES 1999–2002). Thyroid. 2007; 17:1211–23.
crossref pmid
37. Clerico A, Ripoli A, Fortunato A, Alfano A, Carrozza C, Correale M, et al. Harmonization protocols for TSH immunoassays: a multicenter study in Italy. Clin Chem Lab Med. 2017; 55:1722–33.
crossref pmid
38. Boucai L, Hollowell JG, Surks MI. An approach for development of age-, gender-, and ethnicity-specific thyrotropin reference limits. Thyroid. 2011; 21:5–11.
crossref pmid pmc
39. Dold S, Zimmermann MB, Jukic T, Kusic Z, Jia Q, Sang Z, et al. Universal salt iodization provides sufficient dietary iodine to achieve adequate iodine nutrition during the first 1000 days: A cross-sectional multicenter study. J Nutr. 2018; 148:587–98.
crossref pmid
40. Soh SB, Aw TC. Laboratory Testing in Thyroid Conditions-Pitfalls and Clinical Utility. Ann Lab Med. 2019; 39:3–14.
pmid

Fig. 1
Levels of (A) TSH, (B) FT4, (C) FT3, (D) TT4, and (E) TT3 according to sex. *P<0.001.
Abbreviations: TSH, thyroid stimulating hormone; FT4, free thyroxine; FT3, free triiodothyronine; TT4, total thyroxine; TT3, total triiodothyronine.
alm-2021-41-1-77f1.gif
Fig. 2
Prevalence of thyroid diseases in checkups at Peking Union Medical College Hospital and estimated by the manufacturer (Siemens). The annual number of enrolled males and females from 2014 to 2018 was 14,345 and 13,616, 10,589 and 9,320, 6,653 and 8,353, 5,900 and 8,279, and 6,116 and 7,529, respectively. (A) Annual prevalence of subclinical hyperthyroidism. (B) Annual prevalence of subclinical hypothyroidism. (C) Annual prevalence of overt hyperthyroidism. (D) Annual prevalence of overt hypothyroidism.
alm-2021-41-1-77f2.gif
Table 1
Demographic characteristics of the individuals included in the study
Variables* Males Females Total
N 10,170 (50.1%) 10,133 (49.9%) 20,303
Age (yr) 39 (31–48) 36 (29–45) 37 (30–47)
BMI (kg/m2) 25.2±3.5 22.1±3.2 23.7±3.7
SBP (mm Hg) 125±17 111±16 118±18
DBP (mm Hg) 78±10 69±9 73±11
ALT (U/L) 23 (17–33) 13 (10–18) 17 (12–26)
Cr (μmol/L) 82.8±12.6 60.8±9.0 71.8±15.5
TG (mmol/L) 1.34 (0.93–2.00) 0.85 (0.64–1.18) 1.05 (0.74–1.60)
Glu (mmol/L) 5.3±1.2 5.0±0.7 5.2±1.0

* BMI, SBP, Cr, and Glu are presented as mean±SD, and all other indices are presented as the median (interquartile range).

Abbreviations: BMI, body mass index; SBP, systolic blood pressure; DBP, diastolic blood pressure; Cr, creatinine; TG, triglycerides; Glu, glucose.

Table 2
Partial correlation coefficients from multiple regression analysis
Thyroid-related hormone R2 Sex Age BMI SBP
TSH 0.01 0.13 0.03 0.03 0.04
FT4 0.13 −0.33 −0.15 −0.08 0.10
FT3 0.25 −0.43 −0.18 0.08 0.05
TT4 0.01 0.02 0.01 −0.03 0.07
TT3 0.05 −0.08 0.01 0.14 0.05

Abbreviations: R2, coefficient of determination; TSH, thyroid stimulating hormone; FT4, free thyroxine; FT3, free triiodothyronine; BMI, body mass index; SBP, systolic blood pressure: TT4, total thyroxine; TT3, total triiodothyronine.

Table 3
Reference intervals for thyroid-associated hormones established in this study and those recommended by the manufacturer
Sex TSH (mIU/L) FT4 (pmol/L) FT3 (pmol/L) TT4 (nmol/L) TT3 (nmol/L)
This study Male <50 yr old: 1.82 (0.69–4.66)
≥50 yr old: 1.86 (0.64–5.03)
16.4 (12.8–20.6) 5.1 (4.3–6.2) 99.1 (64.2–135.1) 1.7 (1.2–2.3)
Female <50 yr old: 2.01 (0.74–4.87)
≥50 yr old: 2.20 (0.77–5.66)
15.1 (11.9–18.9) 4.6 (3.8–5.5) 99.0 (68.2–134.7) 1.6 (1.2–2.2)

Manufacturer Total (0.55–4.78) (11.5–22.7) (3.5–6.5) (82.6–138.0) (0.9–2.8)

Abbreviations: TSH, thyroid stimulating hormone; FT4, free thyroxine; FT3, free triiodothyronine: TT4, total thyroxine; TT3, total triiodothyronine.

Table 4
Comparison of reference intervals of thyroid-associated hormones with those of previous studies
Reference Year Country Subject Method Platform TSH (mIU/L) FT4 (pmol/L) FT3 (pmol/L) TT4 (nmol/L) TT3 (nmol/L)
Clerico, et al. [15] 2018 Italy 146,801 Indirect Access TSH 3rd IS, using UniCel DxI 0.36–5.28 N N N N

Park, et al. [16] 2018 Korea 5,987 Indirect Roche Diagnostics (Mannheim, Germany) 0.59–7.03 16.09±0.04 N N N

Ali, et al. [17] 2018 Sudan 1,753 Indirect Radioimmunoassay gamma counter (Riostad, Germany) 0.5–3.0 N N 72.0–161.0 0.8–2.8

Tozzoli, et al. [18] 2017 Italy 136,650 Indirect Siemens Dimension Vista 1500 analyzer 0.32–3.36 N N N N

Hickman, et al. [19] 2016 Australia 1,606 Indirect Abbott Diagnostics (Sydney, Australia) 0.43–3.28 10.8–16.8 N N N

Wang, et al. [6] 2016 China 15,956 Indirect Beckman Coulter DxI-800 0.66–4.95 12.29–20.03 3.75–5.81 73.45–138.93 1.24–2.18

Barth, et al. [20] 2016 UK 721 Indirect Siemens ADVIA Centaur XP analyzer 0.5–4.4 10–20 N N 1.1–2.4

Kim, et al. [21]* 2015 Korea 19,465 Indirect TSH-CTK-3 kit (DiaSorin S.p.A., Saluggia, Italy) 0.73–7.06 N N N N

Sriphrapradang, et al. [22] 2014 Thailand 1,947 Indirect Roche (Mannheim, Germany) 0.34–5.11 12.7–23.3 N N N

Langén, et al. [23] 2014 Finland 1,849 Indirect Abbott Laboratories (Lake Bluff, IL, USA) 0.3–3.4 N N N N

Kutluturk, et al. [24]* 2014 Turkey 408 Indirect Roche (Mannheim, Germany) 0.38–4.22 N N N N

Marwaha, et al. [25]* 2013 India 1,916 Indirect Cobas-Roche Elecys 1,010 analyzer 2.2±0.9 10.1±24.8 4.6±0.9 N N

Völzke, et al. [26]* 2010 Germany 1,203 Indirect LIA-mat analyzer from Byk Sangtec 0.25–2.12 8.3–18.9 3.8–7.0 N N

Ross, et al. [27] 2009 Netherlands 1,381 Indirect Abbott Diagnostics 0.51–3.48 9.8–16.9 N N N

Barth, et al. [28] 2017 UK 261 Direct Abbott Architect 0.51–3.67 10.6–15.5 N N N
Beckman Unicel DxI 0.57–3.60 7.9–13.0 N N N
Roche Cobas 0.60–4.31 12.5–19.6 N N N
Siemens Advia Centaur XP 0.63–4.29 11.8–19.0 N N N

Mirjanic-Azaric, et al. [29] 2017 Srpska 250 Direct Roche Diagnostics (Mannheim, Germany) 0.75–5.32 8.97–14.71 4.11–6.32 73.49–126.30 1.15–2.3

Wang, et al. [30]* 2014 China 211 Direct Siemens ADVIA Centaur XP analyzer 0.89–5.93 11.69–18.84 3.88–5.59 76.7–145.0 0.76–1.38

Zarković, et al. [31]* 2011 Serbia 316 Direct Siemens Immulite 2000 0.45–3.43 N N N N

Çavuşoğlu, et al. [32] 2010 Turkey 509 Direct DxI 800, Beckman Coulter 0.41–4.25 7.85–13.64 4.02–5.90 N N

Friis-Hansen, et al. [33] 2008 Norway 489 Direct Roche Modular E170 0.64–4.7 N N N N

* Indicates that the study included ultrasound screening results.

Abbreviations: TSH, thyroid stimulating hormone; FT4, free thyroxine; FT3, free triiodothyronine: TT4, total thyroxine; TT3, total triiodothyronine.

TOOLS
Similar articles