INTRODUCTION
METHODS
Study population and design
Table 1
| Variable | All patients (N=215) | Sepsis (N=109) | Septic shock (N=106) | P |
|---|---|---|---|---|
| Patient enrollment | ||||
| ICU* | 92 (42.8) | 29 (26.6) | 63 (59.4) | <0.001 |
| Emergency room | 123 (57.2) | 80 (73.4) | 43 (40.6) | <0.001 |
|
|
||||
| Age (yr) | 71 (58–79) | 70 (58–79) | 72 (59–79) | >0.9 |
|
|
||||
| Males | 127 (59.1) | 65 (59.6) | 62 (58.5) | 0.9 |
|
|
||||
| Clinical outcomes | ||||
| Hospital stay (day) | 15 (6–31) | 15 (7–28) | 16 (5–43) | 0.7 |
| Vasopressor use† | 123 (57.2) | 17 (15.6) | 106 (100.0) | <0.001 |
| Renal replacement therapy | 22 (10.2) | 7 (6.4) | 15 (14.2) | 0.07 |
| 30-day all-cause mortality (day) | 66 (30.7) | 18 (16.5) | 48 (45.3) | <0.001 |
|
|
||||
| Comorbidities | ||||
| Cardiovascular | 116 (54.0) | 68 (62.4) | 48 (45.3) | 0.07 |
| Cerebrovascular | 97 (45.1) | 48 (44.0) | 49 (46.2) | 0.8 |
| Renal and genitourinary | 60 (27.9) | 35 (32.1) | 25 (23.6) | 0.5 |
| GI & hepatobiliary | 20 (9.3) | 8 (7.3) | 12 (11.3) | 0.8 |
| Respiratory | 20 (9.3) | 11 (10.1) | 9 (8.5) | >0.9 |
| Hemato-oncological | 8 (3.7) | 5 (4.6) | 3 (2.8) | >0.9 |
| Others | 7 (3.3) | 4 (3.7) | 3 (2.8) | >0.9 |
|
|
||||
| Type of infections | ||||
| Bacteremia | 214 (99.5) | 108 (99.1) | 106 (100.0) | 0.3 |
| Respiratory | 98 (45.6) | 39 (35.8) | 59 (55.7) | 0.06 |
| Urinary | 63 (29.3) | 41 (37.6) | 22 (20.8) | 0.2 |
| GI & hepatobiliary | 56 (26.0) | 21 (19.3) | 35 (33.0) | 0.3 |
| Soft tissue | 10 (4.7) | 6 (5.5) | 4 (3.8) | >0.9 |
| Others‡ | 7 (3.3) | 4 (3.7) | 3 (2.8) | >0.9 |
|
|
||||
| SOFA score | 7 (4 –10) | 5 (3–8) | 13 (10–15) | <0.001 |
| Cardiovascular | 3 (0–4) | 0 (0–1) | 4 (4–4) | <0.001 |
| Central nervous system | 0 (0–2) | 0 (0–1) | 2 (0–3) | <0.001 |
| Coagulation | 1 (0–2) | 1 (0–2) | 2 (0–2) | 0.02 |
| Liver | 0 (0–1) | 0 (0–1) | 1 (0–2) | 0.03 |
| Renal | 1 (0–2) | 1 (0–2) | 1 (1–2) | 0.05 |
| Respiratory | 3 (1–4) | 1 (0–3) | 4 (2–4) | <0.001 |
|
|
||||
| Laboratory parameters | ||||
| WBC (×109/L) | 12.8 (6.8–16.9) | 11.7 (6.7–15.1) | 14.6 (7.2–20.1) | 0.02 |
| CRP (mg/L) | 162 (102–254) | 157 (92–225) | 184 (115–270) | 0.08 |
| Lactate (mmol/L) | 3.56 (2.00–6.04) | 2.03 (1.38–3.34) | 4.89 (3.71–9.55) | <0.001 |
| Procalcitonin (μg/L) | 17.7 (6.5–44.4) | 13.7 (5.1–24.4) | 26.7 (8.7–68.1) | <0.001 |
| Creatinine (μmol/L) | 139.7 (84.0–249.3) | 114.1 (75.2–245.8) | 163.6 (102.6–253.8) | 0.04 |
| eGFR (mL/min/kg/1.73 m2) | 42.3 (22.0–82.8) | 54.4 (23.3–90.5) | 37.0 (21.5–69.0) | 0.06 |
| Proenkephalin (pmol/L) | 103.0 (52.5–207.5) | 75.7 (44.4–183.9) | 118.7 (71.7–245.3) | 0.02 |
P values were derived using the Mann–Whitney test or Chi-squared test to compare sepsis and septic shock patients.
* The 92 ICU patients were enrolled from medical (N=60, 65.2%), surgical (N=24, 26.1%), and neurological (N=8, 8.7%) ICUs;
Assay
Statistical analysis
RESULTS
Distribution of PENK levels
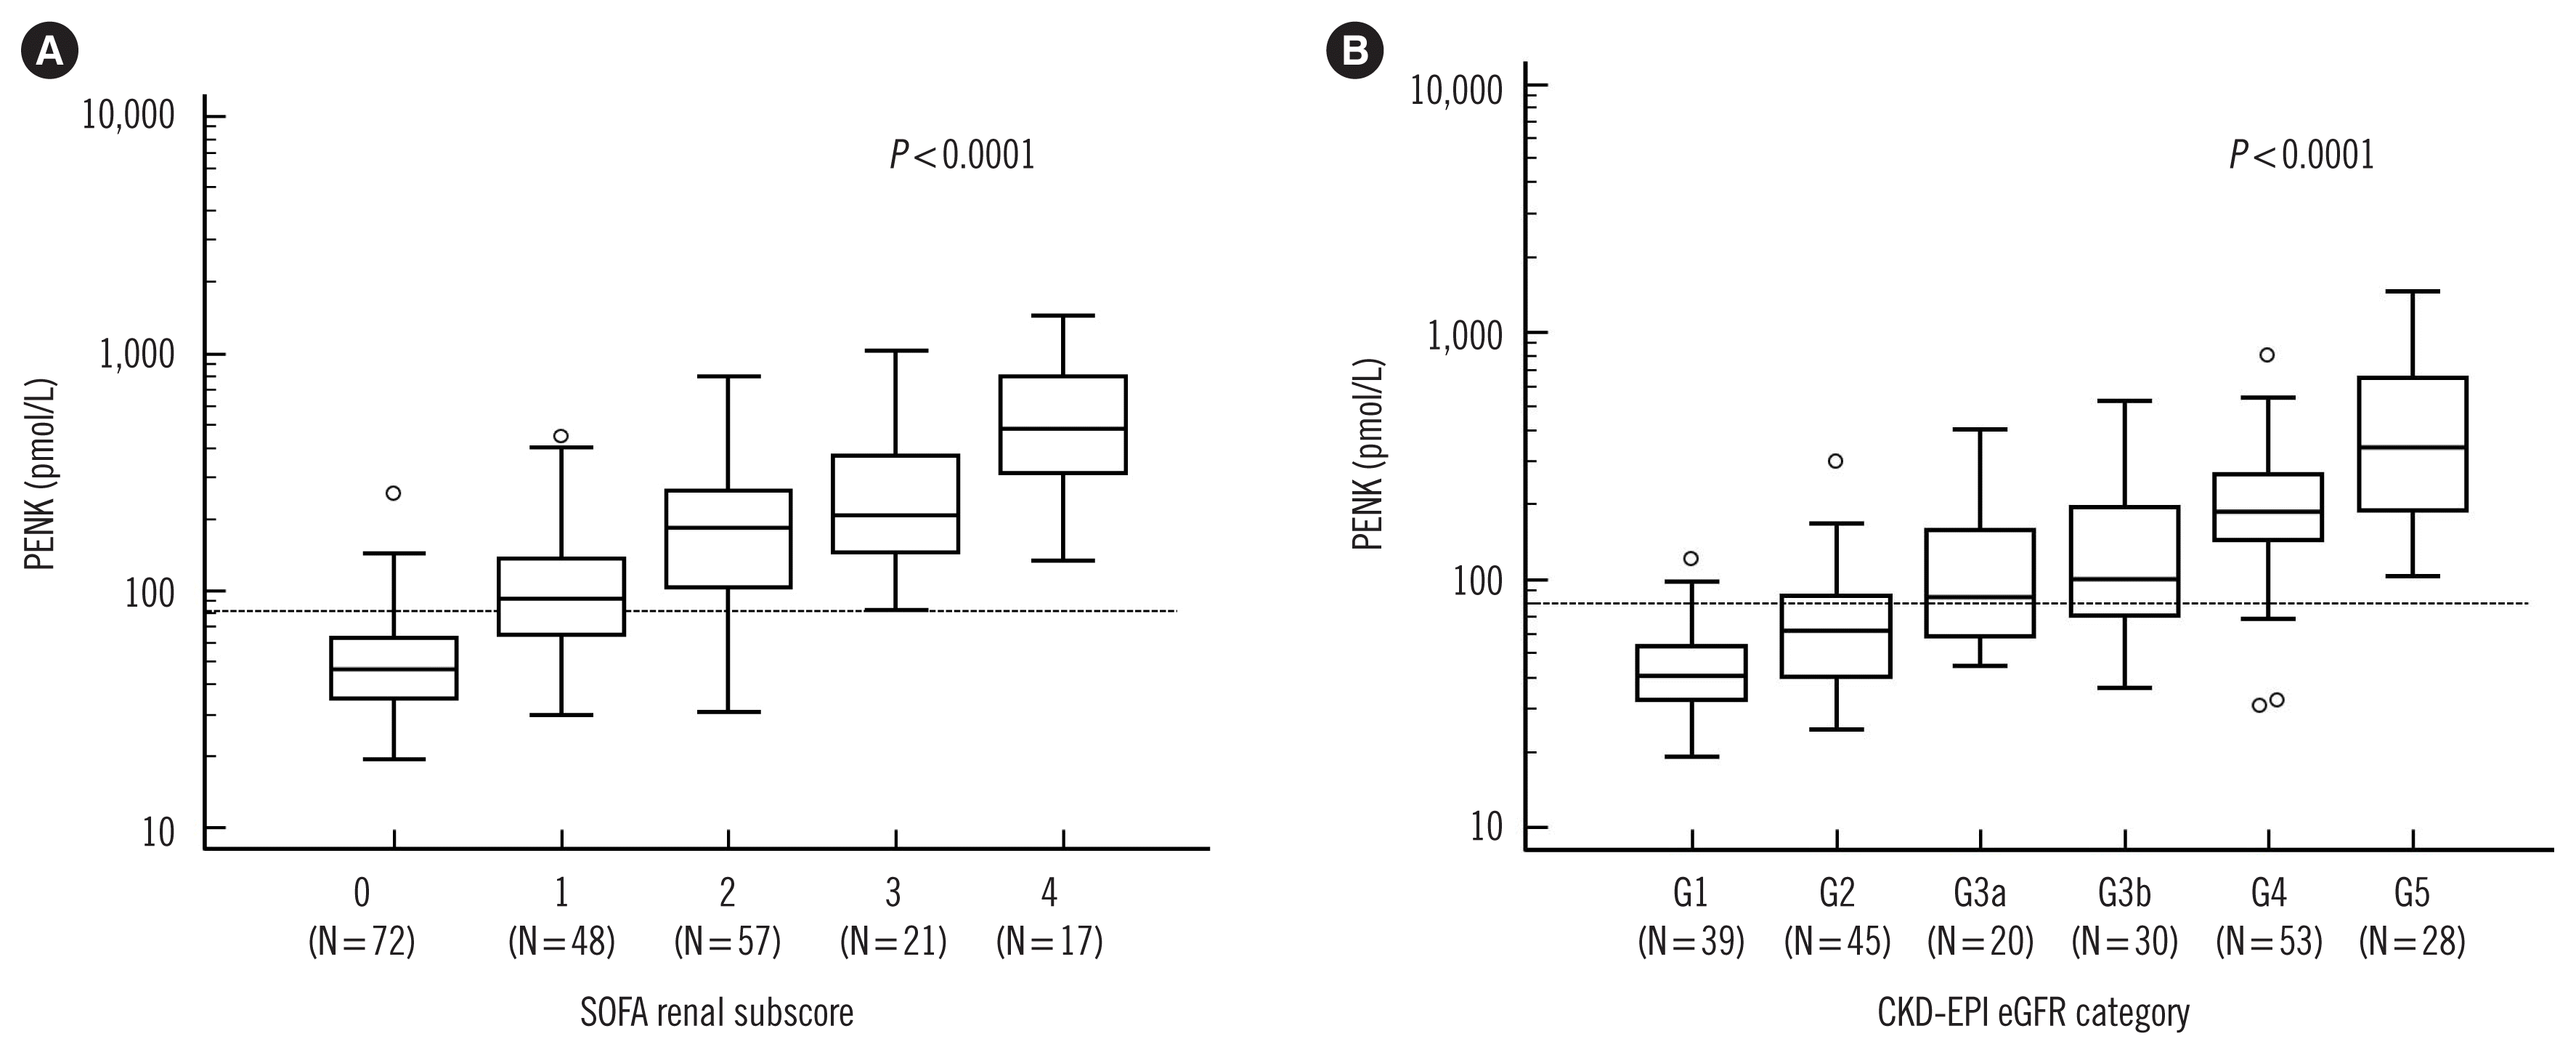
 | Fig. 1Comparison of PENK levels according to the sequential organ failure assessment (SOFA) renal subscore and the CKD-EPI estimated GFR (eGFR) categories. (A) PENK levels (median and IQR) increased significantly according to the increased SOFA renal subscores (from 0 to 4) as follows: 46.9 pmol/L (351–62.9) in 0; 92.4 pmol/L (64.8–136.1) in 1; 182.9 pmol/L (103.7–264.0) in 2; 208.3 pmol/L (145.5–370.2) in 3; 482.3 pmol/L (312.2–819.4) in 4. (B) PENK levels (median and IQR) increased significantly according to the increased CKD-EPI eGFR categories as follows: 40.7 pmol/L (32.7–54.0) in G1; 61.9 pmol/L (40.4–85.8) in G2; 84.8 pmol/L (58.4–158.0) in G3a; 100.8 pmol/L (71.7–195.6) in G3b; 188.2 pmol/L (144.1–264.0) in G4; 341.0 pmol/L (188.4–650.0) in G5. In each figure, the Y-axis is presented as a logarithmic scale.
Abbreviations: PENK, proenkephalin; SOFA, sequential organ failure assessment; CKD-EPI eGFR, the Chronic Kidney Disease Epidemiology Collaboration estimated glomerular filtration rate; IQR, interquartile range.
|


 PDF
PDF Citation
 Print
Print


 XML Download