

 PDF
PDF Citation
 Print
Print


INTRODUCTION
MATERIALS AND METHODS
Study population
Table 1
| Exploration population (cohort 1) | Internal validation (cohort 2) | External validation (cohort 3) | P | |
|---|---|---|---|---|
| Individuals, N | 2,868 | 1,228 | 2,431* | |
| Male, N (%) | 1,120 (39.1) | 476 (38.8) | 1,078 (44.3) | <0.001 |
| Smoker, N (%) | 643 (22.4) | 258 (21.0) | 641 (26.4) | <0.001 |
| Known hypertension, N (%) | 1,254 (43.7) | 556 (45.3) | 1,284 (52.8) | <0.001 |
| Age (yr) | 57 (50, 63) | 58 (50, 64) | 55 (49, 61) | 0.0001 |
| BMI (kg/m2) | 25.6 (23.1, 28.1) | 25.6 (23.1, 28.0) | 26.3 (24.1, 28.4) | 0.0001 |
| WC (cm) | 85 (78, 92) | 84 (78, 92) | 88 (81, 93) | 0.0001 |
| SBP (mmHg) | 148 (140, 160) | 147 (140, 160) | 147 (140, 158) | 0.03 |
| DBP (mmHg) | 91 (84, 98) | 91 (83, 98) | 90 (84, 96) | 0.0007 |
| FPG (mmol/L) | 5.6 (5.2, 6.1) | 5.5 (5.1, 6.0) | 5.8 (5.5, 6.3) | 0.0001 |
| 2h-PG (mmol/L) | 7.1 (5.7, 8.9) | 7.0 (5.7, 8.7) | 7.4 (6.2, 9.1) | 0.0001 |
| HbA1c (%) | 5.5 (5.2, 5.9) | 5.4 (4.7, 6.2) | 5.5 (5.2, 5.8) | 0.0001 |
| HbA1c (mmol/mol) | 37 (33, 41) | 36 (28, 44) | 37 (33, 40) | 0.0001 |
| TC (mmol/L) | 5.4 (4.7, 6.2) | 5.4 (4.7, 6.2) | 4.9 (4.3, 5.5) | 0.0001 |
| TG (mmol/L) | 1.4 (1.0, 2.1) | 1.3 (0.9, 2.0) | 1.5 (1.0, 2.3) | 0.0001 |
| HDL-c (mmol/L) | 1.5 (1.3, 1.8) | 1.5 (1.3, 1.8) | 1.5 (1.3, 1.7) | 0.0001 |
| LDL-c (mmol/L) | 3.2 (2.6, 3.7) | 3.1 (2.6, 3.6) | 2.7 (2.3, 3.2) | 0.0001 |
| Cr (μmol/L) | 63 (53, 74) | 63 (53, 74) | 64 (55, 75) | 0.01 |
Abbreviations: BMI, body mass index; WC, waist circumference; SBP, systolic blood pressure; DBP, diastolic blood pressure; FPG, fasting plasma glucose; 2h-PG, 2-hr postprandial glucose; HbA1c, hemoglobin A1c; TC, total cholesterol; TG, triglycerides; HDL-c, high-density lipoprotein cholesterol; LDL-c, low-density lipoprotein cholesterol; Cr, creatine.
![]()
SENSIBLE study
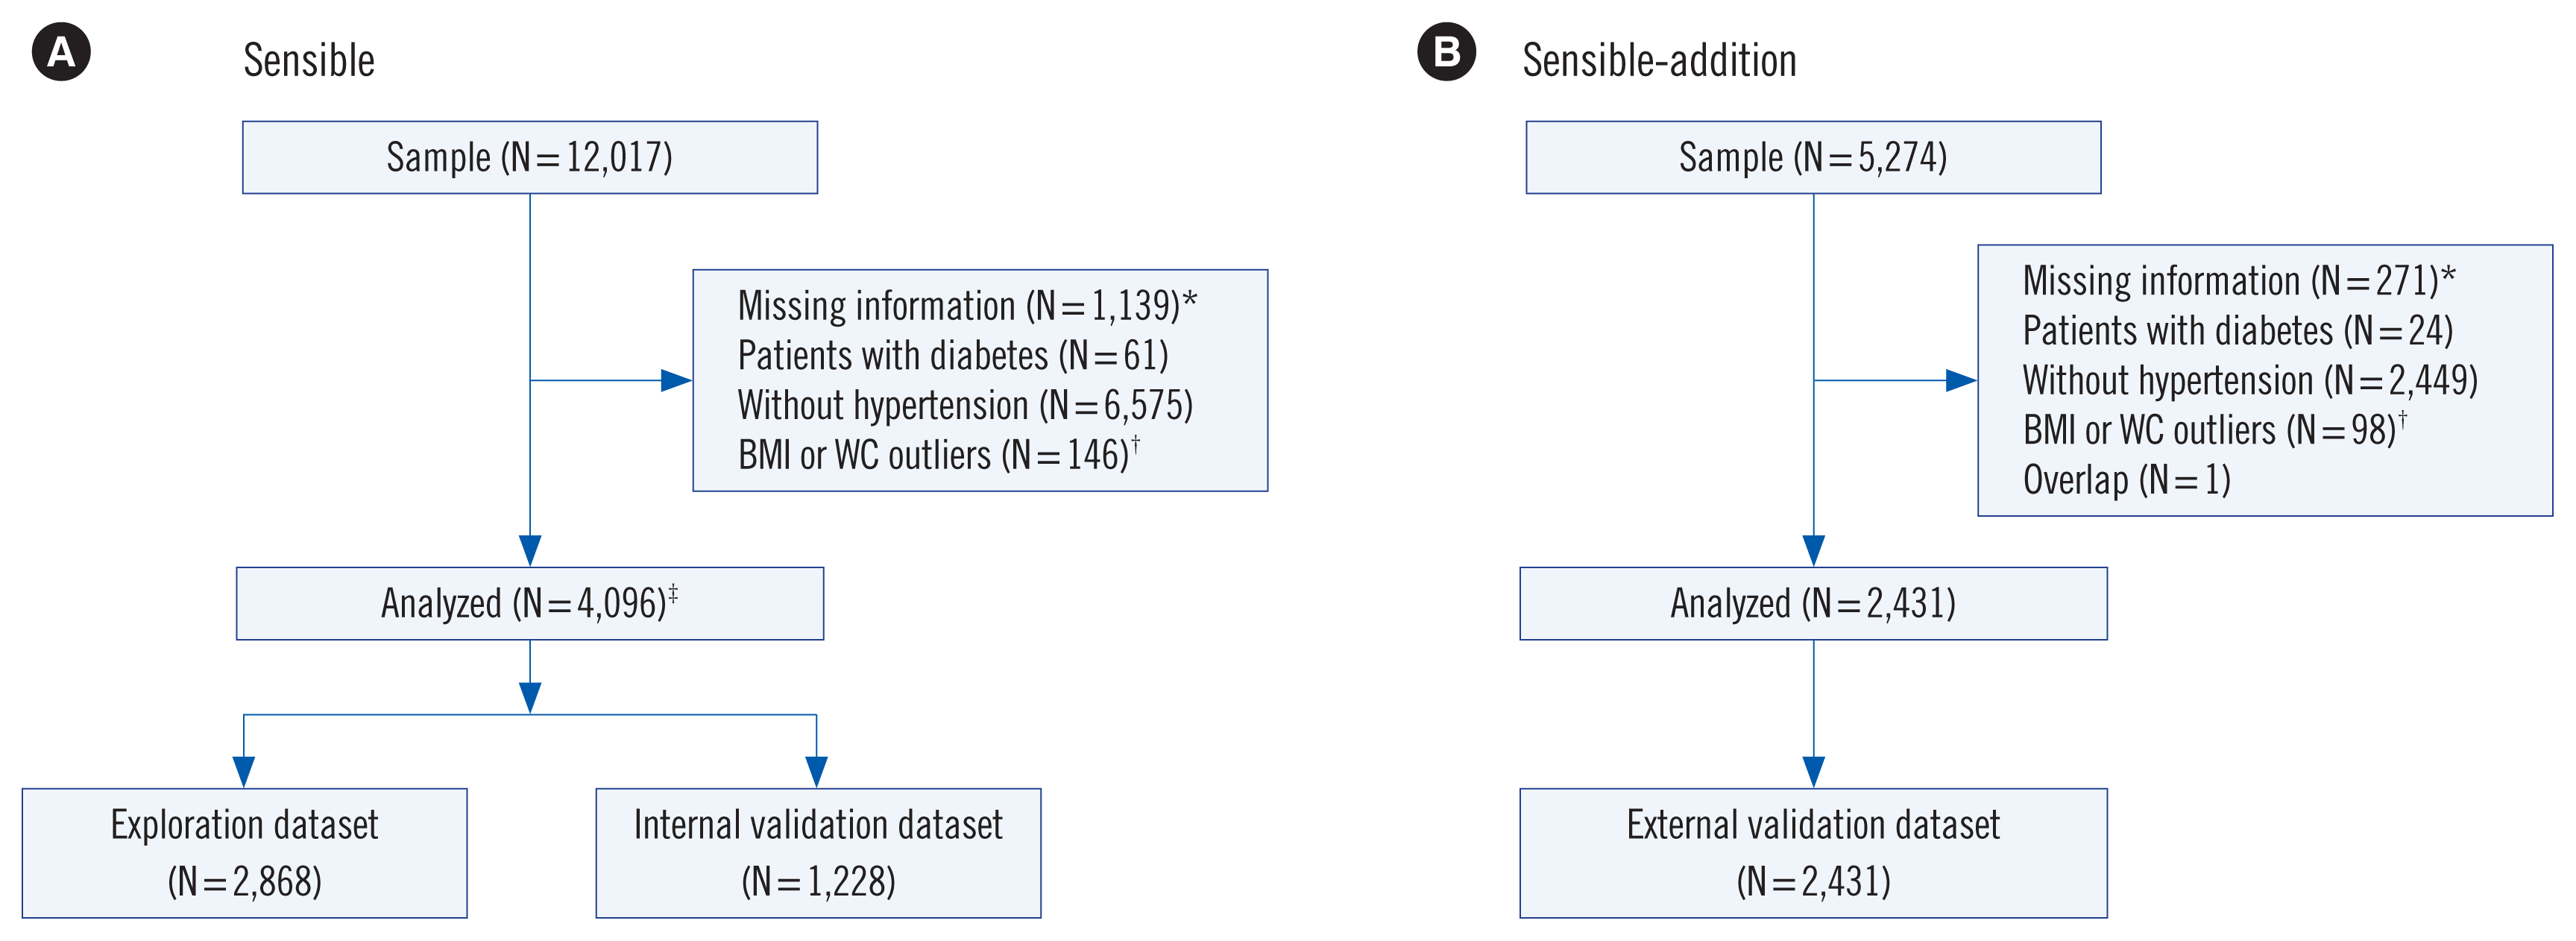 | Fig. 1Participant selection process for (A) the SENSIBLE study and (B) the SENSIBLE-Addition study. *indicates missing information for age, BMI, WC, smoking, glycemic biomarkers, and lipid profiles; †Outliers indicate data >99th percentile or <1st percentile of the dataset; ‡Data for these individuals were randomly split into the exploration dataset (70% of the sample) and the internal validation dataset (the remaining 30%).
Abbreviations: SENSIBLE, Study on Evaluation of iNnovated Screening tools and determInation of optimal diagnostic cut-off points for type 2 diaBetes in Chinese muLti-Ethnic; BMI, body mass index; WC, waist circumference.
|
SENSIBLE-Addition study
Definitions
Statistical analysis
RESULTS
Performance of HbA1c in detecting diabetes
Table 2
![]()
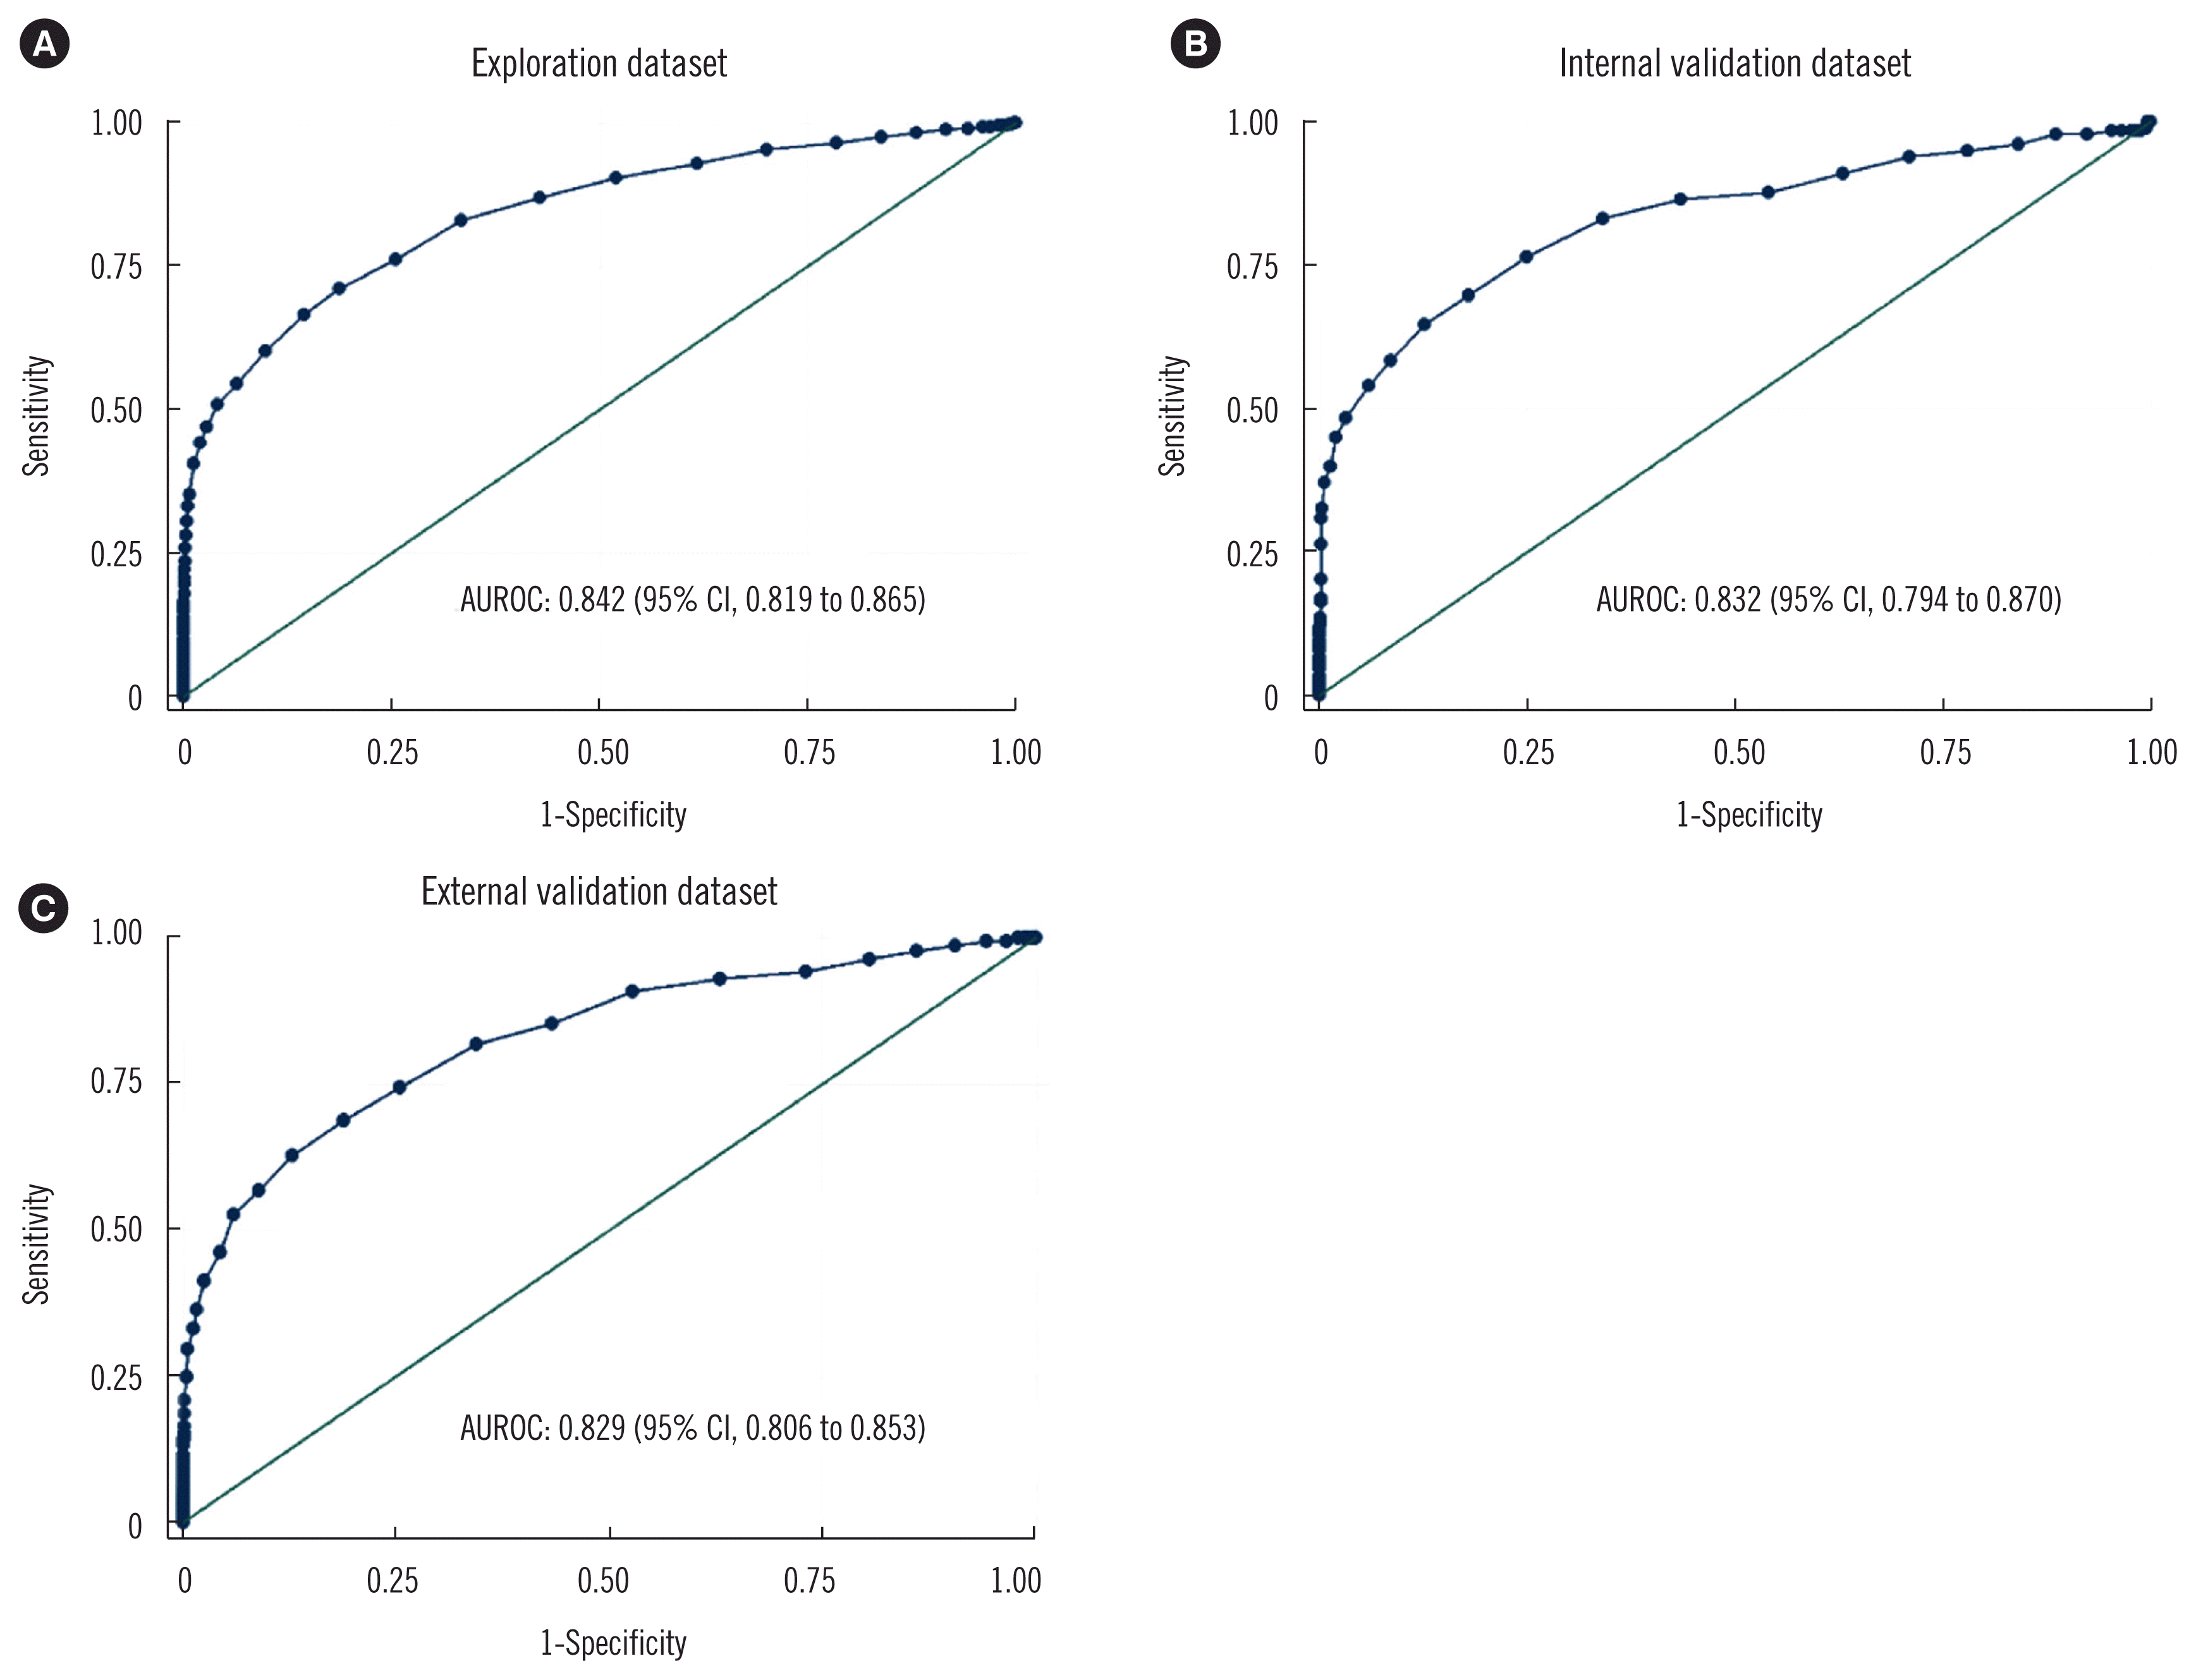
Table 3
| Subgroups | AUROC (95% CI) | ||
|---|---|---|---|
|
|
|||
| Exploration dataset | Internal validation dataset | External validation dataset | |
| Sex-based groups | |||
| Male | 0.821 (0.782–0.859) | 0.784 (0.721–0.848) | 0.827 (0.792–0.862) |
| Female | 0.859 (0.831–0.887) | 0.881 (0.842–0.921) | 0.832 (0.800–0.864) |
|
|
|||
| Hypertension awareness groups | |||
| Known | 0.838 (0.805–0.871) | 0.811 (0.758–0.864) | 0.838 (0.809–0.867) |
| Unknown | 0.844 (0.811–0.877) | 0.849 (0.792–0.905) | 0.810 (0.770–0.850) |
|
|
|||
| Age-based groups | |||
| <50 yr | 0.849 (0.784–0.913) | 0.735 (0.608–0.863) | 0.865 (0.822–0.908) |
| 50–60 yr | 0.843 (0.803–0.883) | 0.852 (0.789–0.915) | 0.811 (0.773–0.850) |
| 60–70 yr | 0.825 (0.792–0.859) | 0.840 (0.791–0.889) | 0.823 (0.782–0.863) |
|
|
|||
| Regular exercise groups* | |||
| Yes | 0.839 (0.811–0.876) | 0.854 (0.802–0.905) | 0.857 (0.818–0.896) |
| No | 0.839 (0.806–0.873) | 0.817 (0.763–0.871) | 0.816 (0.787–0.845) |
![]()
Comparisons between individuals identified as true-positive and false-negative
Table 4
| Individuals with confirmed diabetes | Individuals who underwent diabetes screening* | |||||
|---|---|---|---|---|---|---|
|
|
|
|||||
| True-positive† (N=684) | False-negative‡ (N=254) | P | Screen-positive§ (N=2,006) | Screen-negative|| (N=4,521) | P | |
| Age (yr) | 58 (52, 63) | 55 (50, 63) | 0.05 | 58 (52, 64) | 55 (49, 62) | <0.0001 |
|
|
||||||
| BMI (kg/m2) | 27.0 (24.9, 29.5) | 26.7 (23.8, 28.9) | 0.006 | 26.4 (24.3, 28.9) | 25.6 (23.2, 27.9) | <0.0001 |
|
|
||||||
| WC (cm) | 90 (83, 96) | 88 (80, 95) | 0.01 | 87 (80, 94) | 85 (79, 92) | <0.0001 |
|
|
||||||
| SBP (mmHg) | 149 (140, 161) | 151 (142, 163) | 0.26 | 148 (140, 160) | 147 (140, 158) | 0.002 |
|
|
||||||
| DBP (mmHg) | 91 (83, 97) | 92 (84, 98) | 0.12 | 90 (83, 96) | 91 (84, 97) | 0.005 |
|
|
||||||
| FPG (mmol/L) | 7.3 (6.5, 8.3) | 6.7 (5.9, 7.2) | <0.0001 | 6.1 (5.6, 6.9) | 5.5 (5.2, 5.9) | <0.0001 |
|
|
||||||
| PPG (mmol/L) | 13.3 (11.5, 16.5) | 11.5 (10.3, 12.6) | <0.0001 | 8.8 (6.8, 11.9) | 6.8 (5.6, 8.1) | <0.0001 |
|
|
||||||
| HbA1c (%) | 6.5 (6.1, 7.2) | 5.2 (4.5, 6.0) | <0.001 | 6.1 (5.9, 6.4) | 5.3 (5.1, 5.5) | <0.0001 |
|
|
||||||
| HbA1c (mmol/mol) | 48 (43, 55) | 33 (26, 42) | <0.0001 | 43 (41, 46) | 34 (32, 37) | <0.0001 |
|
|
||||||
| TC (mmol/L) | 5.5 (4.8, 6.3) | 5.2 (4.5, 6.0) | 0.0001 | 5.4 (4.7, 6.2) | 5.1 (4.4, 5.9) | <0.0001 |
|
|
||||||
| TG (mmol/L) | 1.9 (1.3, 2.8) | 1.8 (1.2, 2.7) | 0.16 | 1.6 (1.1, 2.4) | 1.4 (0.9, 2.1) | <0.0001 |
|
|
||||||
| HDL-c (mmol/L) | 1.5 (1.2, 1.7) | 1.5 (1.3, 1.8) | 0.03 | 1.5 (1.2, 1.7) | 1.5 (1.3, 1.8) | <0.0001 |
|
|
||||||
| LDL-c (mmol/L) | 3.2 (2.7, 3.8) | 2.8 (2.3, 3.5) | <0.0001 | 3.1 (2.6, 3.7) | 2.9 (2.4, 3.4) | <0.0001 |
|
|
||||||
| 10-yr CVD risk score (%)¶ | 26.7 (18.5, 39.8) | 24.2 (16.2, 36.1) | 0.01 | 21.1 (12.4, 35.9) | 14.3 (8.5, 24.5) | <0.0001 |
† True-positive cases were defined as individuals with confirmed diabetes based on the 1999 WHO criteria that were detected by HbA1c at the derived cut-off point of 5.8% (40 mmol/mol);
‡ False-negative cases were defined as individuals with confirmed diabetes based on the 1999 WHO criteria that were not detected by HbA1c at the derived cut-off point of 5.8% (40 mmol/mol);
§ Screen-positive cases were defined as individuals with an HbA1c ≥ the derived cut-off point of 5.8% (40 mmol/mol);
|| Screen-negative cases were defined as individuals with an HbA1c < the derived cut-off point of 5.8% (40 mmol/mol);
¶ The 10-year risk score of CVD was calculated according to the Framingham Risk Score for predicting CVD [19].
Abbreviations: BMI, body mass index; WC, waist circumference; SBP, systolic blood pressure; DBP, diastolic blood pressure; FPG, fasting plasma glucose; PPG, post-prandial plasma glucose; HbA1c, hemoglobin A1c; TC, total cholesterol; TG, triglycerides; HDL-c, high-density lipoprotein cholesterol; LDL-c, low-density lipoprotein cholesterol; CVD, cardiovascular disease.
![]()
 XML Download