

 PDF
PDF Citation
 Print
Print


INTRODUCTION
Most errors affecting total blood analysis occur during the preanalytical phase, mainly owing to a lack of standardized procedures for samples collection, for example, the correct homogenization of samples and removal of air bubbles [1]. The storage temperature and time of the syringes with collected samples are additional preanalytical variables that can affect results of blood gases or lactate concentration [2]. To minimize the influence of these preanalytical variables on the results, the laboratory are responsible to inform practitioners about the preanalytical conditions under which samples should be collected, stored, and transported [3].
Some guidelines recommend analyzing blood samples within 30 minutes after collection and keeping them at a low temperature [4–7]; however, there is no agreement between the biochemical parameters and sampling conditions for syringes with collected samples in the literature. Previous studies have used different criteria for their calculations based on statistical, metrological, or biological variability, and as a result, suggested different recommendations [8–13]. Therefore, establishment of stability limits depends on the mathematical criterion defined. Laboratories may calculate their own stability limits under specific sample storage conditions using the mathematical criteria recommended by scientific societies or clinical guidelines [14, 15].
Previous studies have investigated stability effects [12, 13, 16], kind of syringes [8, 13, 17], different storage temperatures [7–9, 13, 18], transport conditions [7], and even syringe volumes [12, 13]. However, despite the apparently vast bibliography, there is poor consensus about blood gas stability in daily practice. Therefore, we performed the main stability study with a large number of samples. We aimed to analyze the effects of temperature and duration of storage on the arterial or venous blood gas stability in samples in terms of pH, partial pressure of carbon dioxide (pCO2) and oxygen (pO2), hemoglobin oxygen saturation (sO2), and lactate concentration. Moreover, for the first time, to the best of our knowledge, we explored the blood gas stability by grouping the samples based on the initial concentration for each parameter, to determine whether stability is concentration-dependent.
Go to : 
MATERIALS AND METHODS
The study, performed in the Stat Laboratory of Bellvitge University Hospital, Hospitalet de Llobregat, Barcelona, Spain, was approved by the Clinical Research Ethics Committee of Bellvitge University Hospital (Ref. PR297/12).
Sample details
The study was performed with blood samples obtained from the Intensive Care Unit and the Emergency Department. From June 2012 to January 2013, 1,200 arterial and venous blood samples were collected into SafePICO (Ref. 956–622; Radiometer) and Marquest’s Quick ABG syringes (Ref. 4023TRU; Vyaire Medical, Höchberg, Germany); both syringes contain dried lyophilized lithium heparin (60–100 UI) as an anticoagulant. The study team collected the samples at the patient’s point-of-care to ensure that these reached the laboratory in less than 10 minutes after collection. Informed consent was not obtained from the patients because the samples were randomized and anonymized. We collected a sufficient number of samples to ensure a minimum of 30 samples for each parameter at each specific time. Following the elimination of aberrant data pairs, a total of 1,147 samples were used.
The blood sample syringes used in our study were considered residual material; therefore, instead of discarding the samples once analyzed and validated, they were incubated at specific goal temperatures. In fact, each syringe was analyzed twice (time 0 minute and then incubated at the goal temperature for 60, 45, 30, or 15 minutes, respectively).
First measurement
Before analysis, all samples were thoroughly mixed for 5–10 seconds by vertical hand-rolling, and any visible air bubbles were carefully removed. The pH, pCO2, pO2, sO2, and lactate concentration in each blood sample were measured for the first time (basal measurement, time 0 minute) using an ABL800 blood gas analyser (Radiometer, Copenhagen, Denmark).
Storage temperature
Following the first analysis, the samples were grouped into three categories according to the storage temperature over 60 minutes: the first group samples were stored at 25°C, the second group samples at 4–8°C, and the third group samples at 0–3.9°C in an ice-water bath. Samples were randomly left at each goal temperature. The temperature was continuously monitored using a mercury-in-glass thermometer.
Storage time and second measurement
The stability study began by storing the samples for 60 minutes. After the desired time at the indicated temperature, the samples were quickly hand-mixed and reanalyzed. The first and second results were stored in a database, and statistical calculations were performed. If any parameter was not stable ≤60 minutes, the study of that sample group started again with new samples, for 45 minutes. If stability was still an issue, the experiment was carried out for 30 and 15 minutes, sequentially. Independent sample groups were used each time (Fig. 1).
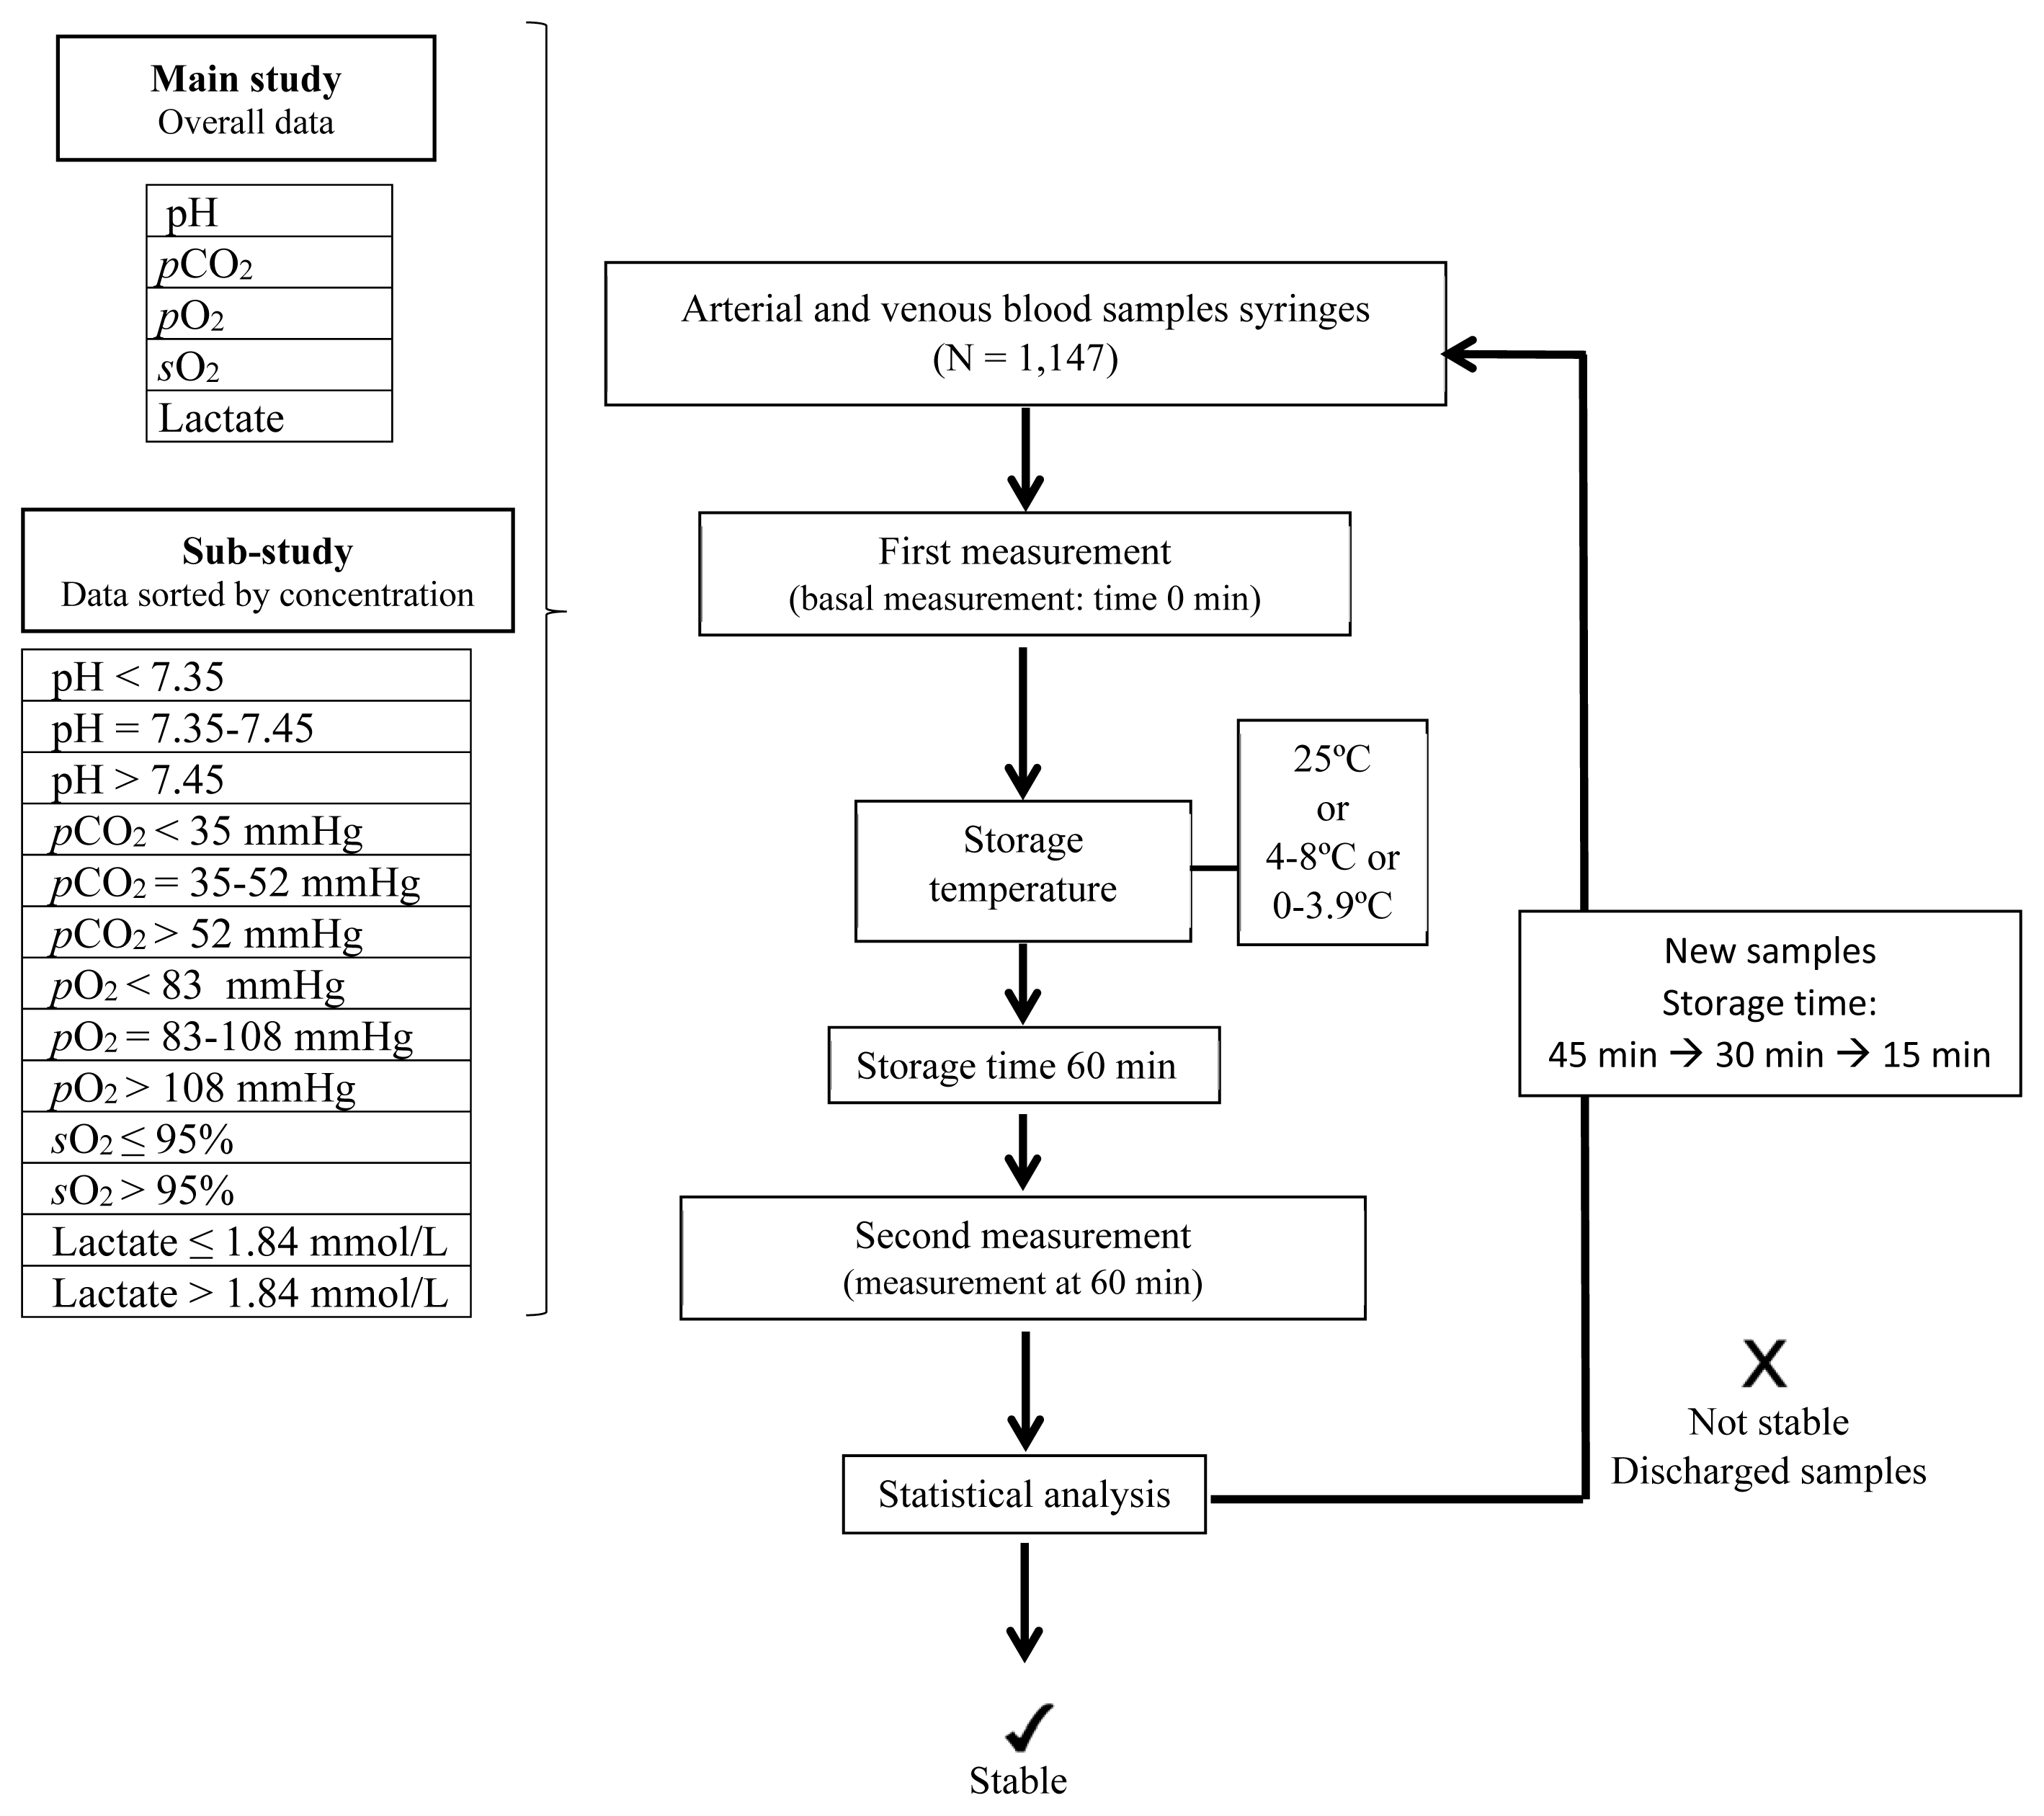 | Fig. 1Study flow diagram. The stability study began with storing the samples for 60 minutes. If any parameter was not stable for ≤60 minutes, the study was started again with new samples for 45 minutes. If stability was still an issue, the experiment was carried out for 30 and 15 minutes, sequentially. Independent sample groups were used each time. Measurements were conducted using an ABL800 analyzer (Radiometer, Copenhagen, Denmark).
Abbreviations: pCO2, partial pressure of carbon dioxide; pO2, partial pressure of oxygen; sO2, oxygen saturation.
|
Main study and substudy
For the main study, stability was assessed with all data. For the substudy, all data were sorted into groups based on the initial values; pH, pCO2, and pO2 data were divided into the following three groups: below, between, and above the reference intervals. The sO2 data and lactate concentration data were divided into two groups, below and above the reference intervals.
Statistical analysis
Acceptance stability limits (S) were obtained based on the Sociedad Española de Medicina de Laboratorio criteria for maximum allowable bias (S=±1.65 coefficient of variation [CV]) [14]. The within-run imprecision, expressed as CV, was calculated from the differences between pairs of duplicate measurements analyzing at least 60 samples using the Dahlberg formula (s=√ ∑ d2/2n). The aberrant differences between pairs of duplicate measurements were eliminated using the Bland–Altman method. For the main study, the CV was calculated for each parameter using the overall data. For the substudy, the CV was calculated for each parameter and for each concentration range.
The percentage deviation (PD) between the first measurement (Xi) and the second measurement (Yi) for each parameter and storage condition were calculated as follows: PD=100 (∑(Yi–Xi)/Xi)/n. The PD was compared with the S; if the PD was greater than S, the storage temperature and time caused a stability loss.
Statistical calculations were performed with Microsoft Excel 2010 (Microsoft Corp., Redmond, WA, USA), and the Bland-Altman method was performed using Analyse-IT software (Analyse-IT software Ltd., Leeds, UK). The level of significance was defined at P<0.05.
Go to :
RESULTS
Within-run imprecision study
The CV values of the main study (overall data) and the substudy (by concentration group) are shown in Table 1. All CV values achieved the maximum allowed values according to the metrological requirements of our laboratory. S was calculated with these CV values.
Table 1
Within-run imprecision in overall group and in groups sorted by concentration
![]()
Main study
The effect of storage temperature (25, 4–8, and 0–3.9°C) and storage time on the stability of biological parameters in the main study is plotted in Fig. 2 and the data are shown in Table 2.
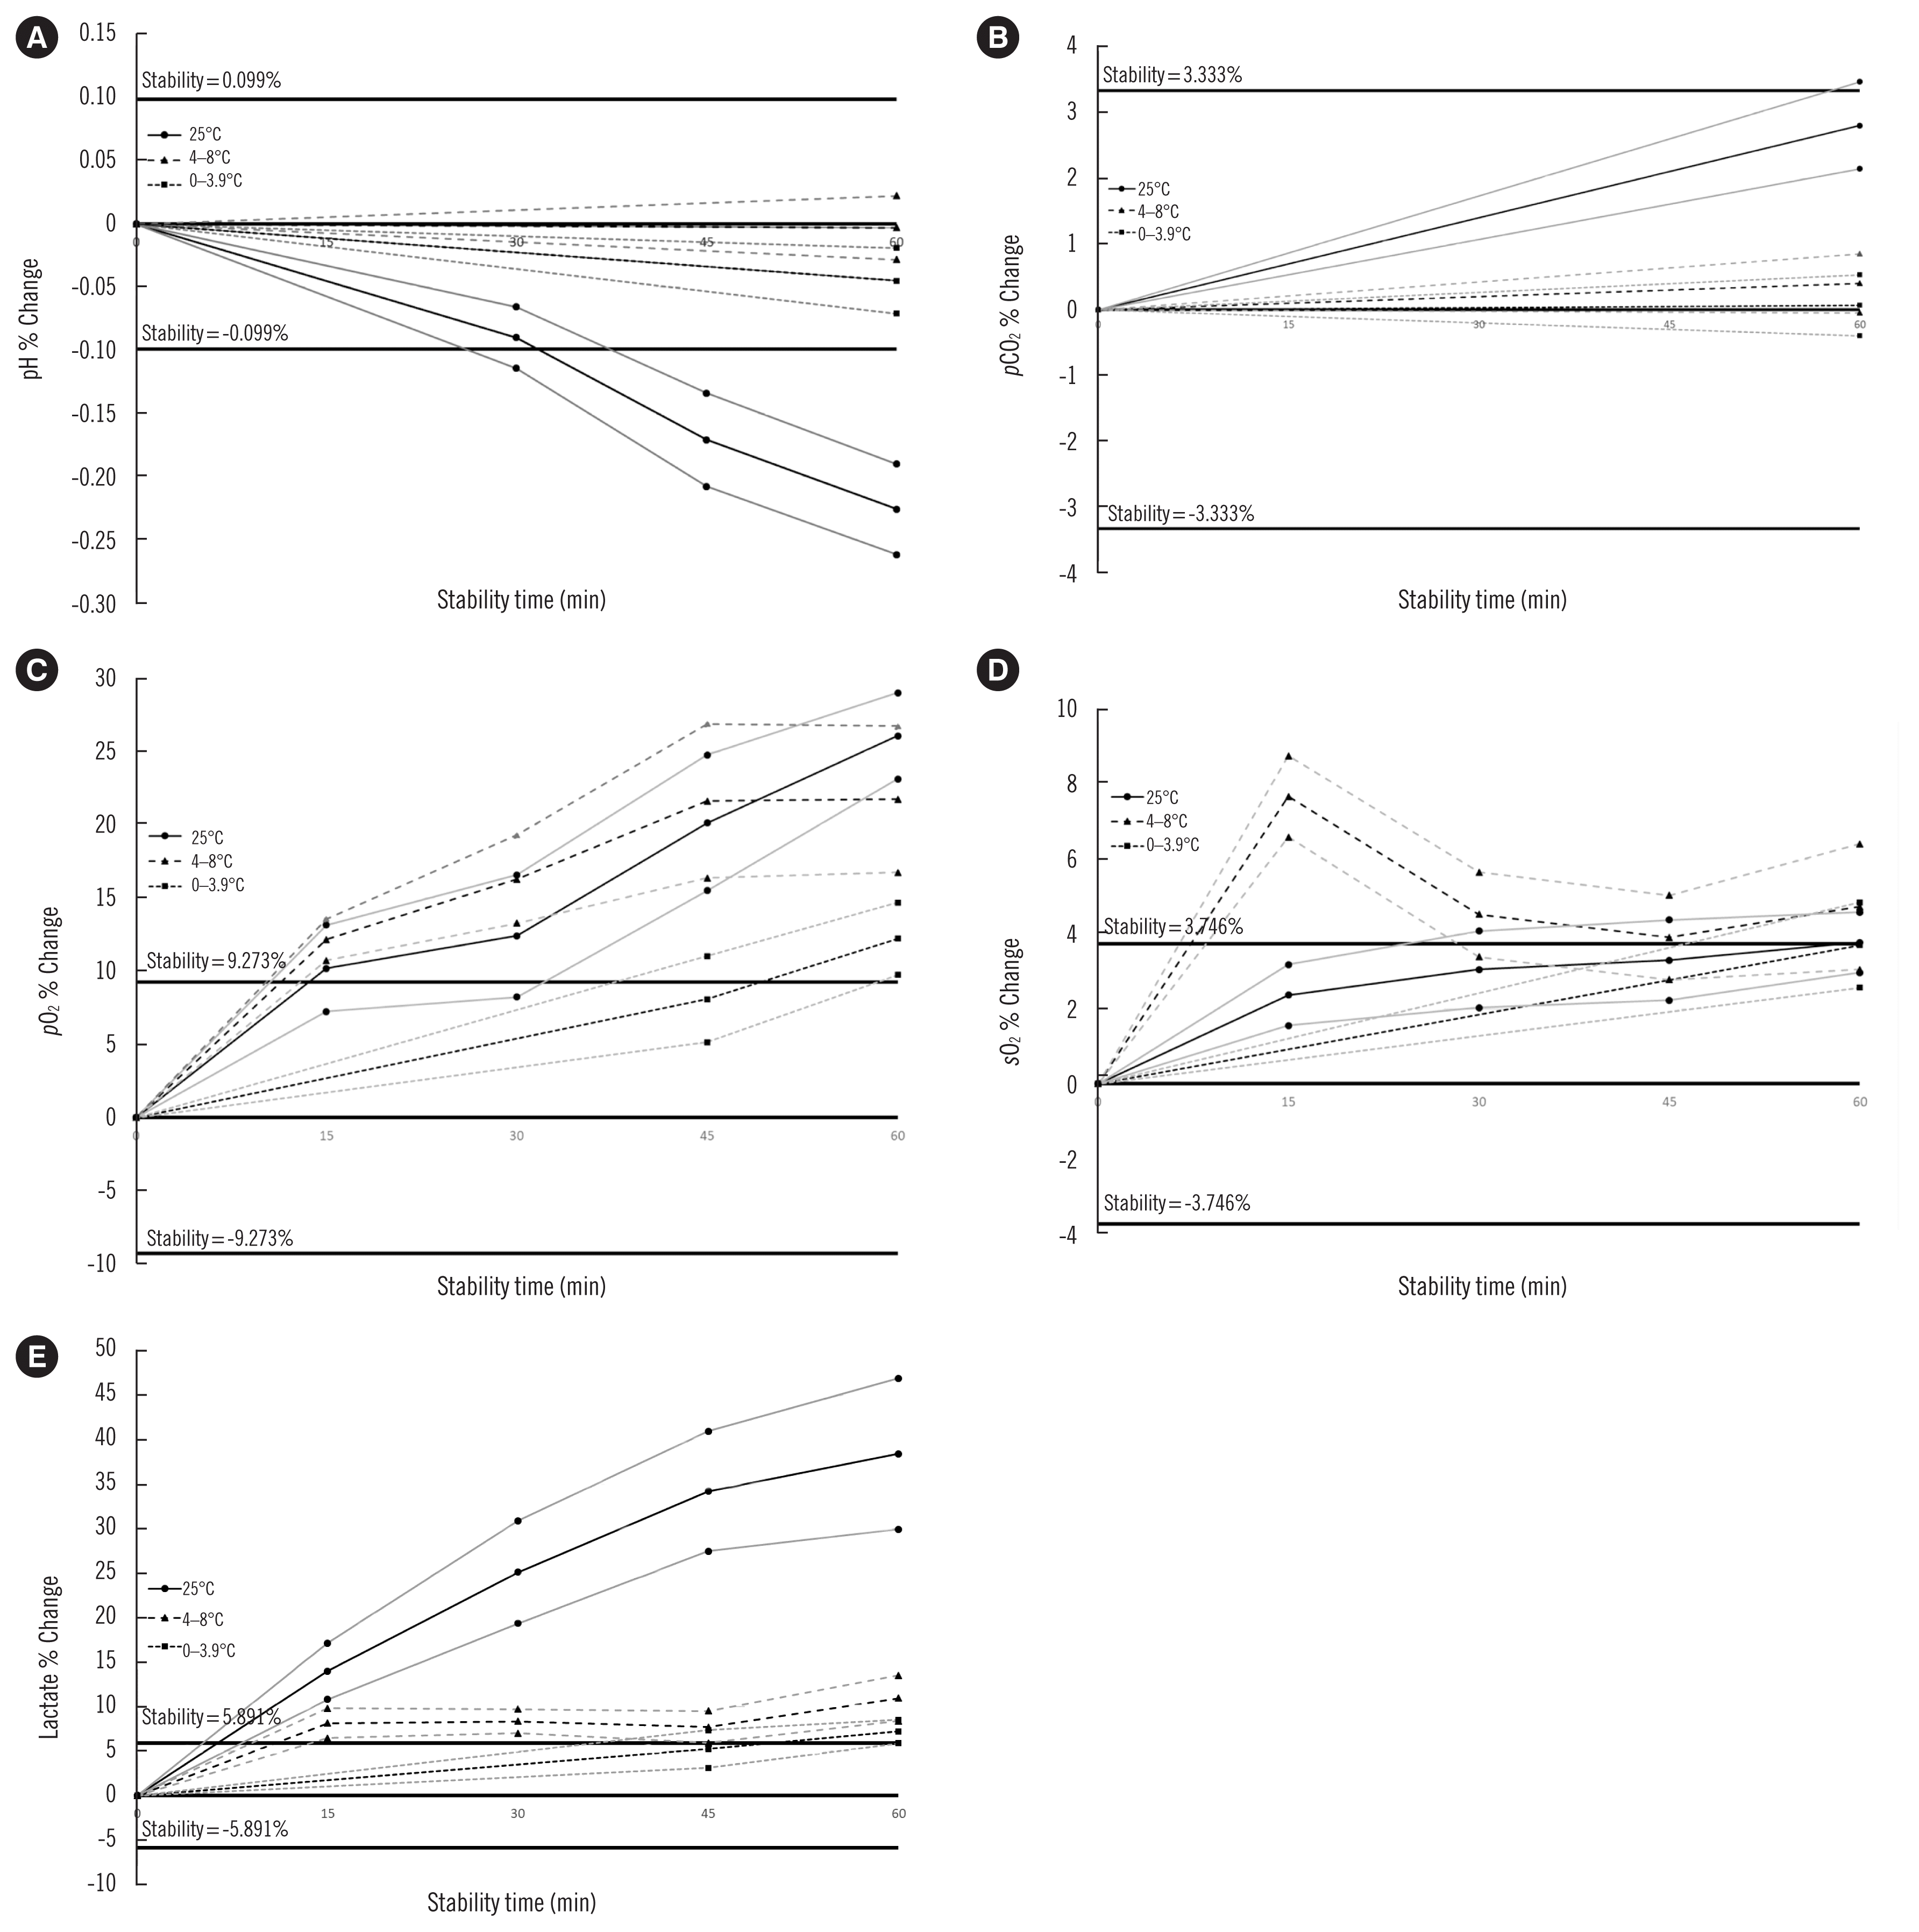 | Fig. 2Mean bias from baseline for pH (A), pCO2 (B), pO2 (C), sO2 (D), and lactate concentration (E) at 25°C (solid black curve), 4–8°C (long dashed black curve), and 0–3.9°C (short dashed black curve). The two adjacent grey curves on either side represent the 95% confidence interval of the mean curve. The solid black lines correspond to stability (%) calculated as a CV percentage overall (within-run imprecision)×1.65. Data are displayed in Table 2. Independent sample groups were used for each time, even though there is a connection between lines.
Abbreviations: pCO2, partial pressure of carbon dioxide; pO2, partial pressure of oxygen; sO2, oxygen saturation; CV, coefficient of variation.
|
Table 2
Evaluation of sample storage temperature (25, 4–8, and 0–3.9°C) and duration of biological parameter stability (in minutes) in all samples (overall group–main study)
| N | Temperature (°C) | Time (min) | PD (95% CI) (%)* | S (%)† | |
|---|---|---|---|---|---|
| pH | 92 | 25 | 30 | −0.090 (−0.114; −0.066) | 0.099 |
| 97 | 4–8 | ≤60 | −0.003 (−0.028; 0.022) | ||
| 89 | 0–3.9 | ≤60 | −0.045 (−0.071; −0.019) | ||
|
|
|||||
| pCO2 | 90 | 25 | ≤60 | 2.81 (2.15; 3.47) | 3.33 |
| 110 | 4–8 | ≤60 | 0.405 (−0.043; 0.853) | ||
| 90 | 0–3.9 | ≤60 | 0.070 (−0.395; 0.535) | ||
|
|
|||||
| pO2 | 84 | 25 | <15 | 10.2 (7.25; 13.1) | 9.27 |
| 190 | 4–8 | <15 | 12.2 (10.7; 13.6) | ||
| 66 | 0–3.9 | 45 | 8.09 (5.15; 11.0) | ||
|
|
|||||
| sO2 | 66 | 25 | 15 | 2.37 (1.56; 3.18) | 3.75 |
| 104 | 4–8 | <15 | 7.68 (6.59; 8.76) | ||
| 81 | 0–3.9 | ≤60 | 3.71 (2.57; 4.84) | ||
|
|
|||||
| Lactate | 65 | 25 | <15 | 14.0 (10.8; 17.1) | 5.89 |
| 39 | 4–8 | <15 | 8.13 (6.46; 9.81) | ||
| 27 | 0–3.9 | 45 | 5.22 (3.09; 7.34) | ||
PD in bold indicates significant stability time (PD<S). Groups that were stable for the entire study period are identified as ≤60, while those that were not stable for even 15 min are designated as <15.
* PD (%) calculated as ∑ (Yi−Xi)/Xi)/n×100. The first (Xi) and the second (Yi) sample result for each parameter and storage condition;
![]()
Blood pH was stable over all time periods when the sample was preserved via refrigeration (0–3.9°C or 4–8°C) or up to 30 minutes at 25°C. For pCO2, no significant stability loss was observed in any sample for ≤60 minutes. The pO2 values were not stable for 15 minutes at 25°C or 4–8°C, but were stable at 45 minutes when the sample was preserved at 0–3.9°C. sO2 was stable for 15 minutes at 25°C and ≤60 minutes at 0–3.9°C. In contrast, sO2 was not stable at 4–8°C for 15 minutes. Lactate concentration was not stable for any time at 25°C or 4–8°C; however, it was stable for 45 minutes at 0–3.9°C.
Substudy
Table 3 shows the results of the samples sorted according to the initial value of the blood gas parameters.
Table 3
Evaluation of sample storage temperature (25, 4–8, and 0–3.9°C) and duration of biological parameter stability (in minutes) sorted by the initial concentration value (substudy)
| Temperature (°C) | N | Time (min) | PD (%)* | S (%)† | N | Time (min) | PD (%)* | S (%)† | N | Time (min) | PD (%)* | S (%)† |
|---|---|---|---|---|---|---|---|---|---|---|---|---|
| pH<7.35 | pH=7.35–7.45 | pH>7.45 | ||||||||||
| 25 | 30 | 30 | 0.088 | 0.116 | 29 | 15 | 0.038 | 0.066 | 29 | 15 | 0.020 | 0.099 |
| 4–8 | 30 | ≤60 | 0.023 | 36 | ≤60 | 0.032 | 31 | ≤60 | 0.051 | |||
| 0–3.9 | 29 | ≤60 | 0.088 | 31 | ≤60 | 0.015 | 29 | ≤60 | 0.024 | |||
|
|
||||||||||||
| pCO2<35 mmHg | pCO2=35–52 mmHg | pCO2>52 mmHg | ||||||||||
| 25 | 25 | 30 | 0.304 | 2.77 | 32 | 45 | 0.021 | 2.72 | 27 | ≤60 | 0.618 | 3.42 |
| 4–8 | 31 | ≤60 | 0.203 | 55 | ≤60 | 0.605 | 24 | ≤60 | 0.206 | |||
| 0–3.9 | 33 | ≤60 | 0.193 | 31 | ≤60 | 0.520 | 26 | ≤60 | 0.612 | |||
|
|
||||||||||||
| pO2<83 mmHg | pO2=83–108 mmHg | pO2>108 mmHg | ||||||||||
| 25 | 34 | 15 | 8.68 | 8.83 | 26 | <15 | 17.8 | 10.5 | 27 | 30 | 3.93 | 7.21 |
| 4–8 | 116 | <15 | 10.6 | 31 | <15 | 17.2 | 43 | <15 | 12.8 | |||
| 0–3.9 | 53 | ≤60 | 6.99 | 30 | <15 | 18.7 | 34 | <15 | 16.6 | |||
|
|
||||||||||||
| sO2≤95 % | sO2>95 % | |||||||||||
| 25 | 33 | 15 | 4.38 | 6.40 | 33 | ≤60 | 0.379 | 4.49 | ||||
| 4–8 | 104 | <15 | 7.68 | 33 | ≤60 | 0.566 | ||||||
| 0–3.9 | 49 | ≤60 | 5.56 | 32 | ≤60 | 1.87 | ||||||
|
|
||||||||||||
| Lactate≤1.84 mmol/L | Lactate>1.84 mmol/L | |||||||||||
| 25 | 36 | <15 | 18.6 | 9.49 | 29 | <15 | 8.23 | 4.69 | ||||
| 4–8 | 25 | <15 | 10.5 | 14 | 15 | 3.89 | ||||||
| 0–3.9 | 44 | ≤60 | 8.03 | 29 | ≤60 | 2.34 | ||||||
Groups that were stable for the entire study period are identified as ≤60, while those that were not stable for even 15 minutes are designated as <15. PD in bold indicates significant stability time (PD<S).
* PD (%) calculated as ∑ (Yi−Xi)/Xi)/n×100. The first (Xi) and the second (Yi) sample result for each parameter and storage condition;
![]()
Blood pH was stable for all storage times when it was preserved at 4–8 or 0–3.9°C, for the three groups. It was also stable for 30 minutes at 25°C in the group below the lower limit of the reference interval and for 15 minutes within and above the upper limit of the reference interval. Similarly, pCO2 was stable at 4–8 and 0–3.9°C for all samples. At 25°C, pCO2 was stable for 30 minutes in the group below the lower limit, 45 minutes in the group within, and ≤60 minutes in the group above the upper limit of the reference interval. pO2 was not stable at 15 minutes in nearly all groups at any of the storage temperatures. The exception was the group above the upper limit (pO2>108 mmHg) at 25°C, which was stable for 30 minutes, and the group below the lower limit (pO2<83 mmHg) at 0–3.9°C, which was stable for ≤60 minutes. sO2 was stable under all conditions in the group above the upper limit (>95%), but was only stable at 0–3.9°C ≤60 minutes in the group below the upper limit (≤95%). Lactate concentration was stable at all times for 0–3.9°C in both groups, and the lactate group >1.84 mmol/L was stable at 4–8°C, 15 minutes. However, it was not stable in either concentration group at 25°C, or in the lactate group ≤1.84 mmol/L at 4–8°C.
Go to :
DISCUSSION
Previous stability studies regarding the measurement of blood gases are outdated and present contradictory data. Each study differs in terms of design, blood sample volume, initial oxygen concentration, syringe type, and size, resulting in different conclusions [8–13]. We carried out a stability study with added value using a large number of samples and by grouping the samples by the initial value of each parameter, to determine whether stability is concentration-dependent. Our findings agree with the findings by Srisan, et al. [18], who did not observe a significant decrease in pH over time until 30 minutes at 25°C and 45 minutes on ice. Similarly, Smajic, et al. [16] observed no statistically significant differences in pCO2 values during 60 minutes at 25°C.
Cell metabolism at 25°C could explain this phenomenon, as CO2 is generated both aerobically and anaerobically, leading to an increase in pCO2 and a decrease in pH. Williams, et al. [19] showed that for every increase in pCO2 by 20 mmHg above normal, the pH decreased by 0.1 unit, while for every decrease of pCO2 by 10 mmHg below normal, the pH increased by 0.1 unit. However, lower temperatures reduce oxygen consumption and CO2 production [12]. In general, samples collected under anaerobic conditions in plastic heparinized syringes, kept at 25°C, showed significant stability losses. The pO2 decreased while pCO2 increased as a product of cell metabolism. As a consequence of increased pCO2 and the production of hydrogen ions, which are generated as a result of glycolysis, lactate concentration increased and the pH decreased. Baird, et al. [20] showed that a delay in analysis decreased pO2 by 2 mmHg/hr and increased pCO2 by 1 mmHg/hr at room temperature. Consequently, blood pH decreased by 0.02–0.03 pH units/hr at room temperature. It should be noted that these turnaround times are not unusual in some hospital circuits. Laboratory professionals should, therefore, help achieve optimum turnaround times [21, 22].
pO2 increased in the study groups, in which the pO2 of the samples was below the ambient value (≈159 mmHg). If the pO2 in the blood gas is above the ambient value, the gas diffuses and, consequently, pO2 decreases [17]. Therefore, it was more stable in the group with higher partial pressures at 25°C than in the other groups at the same temperature. This could be due to the difference in the atmospheric pO2 and the gas diffusion through the wall of the plastic syringe. In concordance with a previous study, when atmospheric pressure was above that of the syringe, partial pressure diffusion causes slight changes compared to when the atmospheric pressure is below that of the syringe [23]. This also depends on the syringe material [8, 9, 24].
Considering our results, we recommend cooling (0–3.9°C) sample syringes when pO2 is ordered and when there is a delay in processing the sample. In contrast, Baird, et al. [20] concluded that keeping glass syringes on ice after collection is no longer recommended for plastic syringes. The CLSI guidelines recommend that samples in plastic syringes should be analyzed within 30 minutes after collection at 25°C [25].
The sample extraction procedure should be rigorous since air aspiration or bubble formation in blood gas syringes can significantly alter blood gas parameters [26]. Exposure of a blood gas sample to air would typically result in an elevation or drop in pO2 to 150 mmHg and perhaps a decrease in pCO2 along with an increase in pH due to the loss of carbonic acid at prolonged exposure [20].
Finally, lactate is a degradation product of the anaerobic pathway and may contribute to the decrease in pH. When blood sample is collected, metabolism in blood cells is still active; blood cells consume oxygen and glucose, the sample becomes anaerobic, and lactate is produced, resulting in concomitant acidosis [20].
Our study has some limitations. First, the stability time was calculated not from sample collection but from the reception of syringe at the laboratory, taking into account that not more than 10 minutes pass between collection and analysis. We cannot exclude some degree of gas exchange in syringes that were opened during analysis, even though we re-capped them at the earliest. The second limitation concerns the samples, as we performed the study with arterial and venous samples in order to cover all measurement ranges. To calculate the PD, we mixed the arterial and venous blood gas results. The correlation between arterial and venous blood results is good for pH, pCO2, and lactate [27]. Most data for pO2 and sO2 below the reference intervals (<83 mmHg and ≤95%, respectively) were from venous samples, while the data above the reference intervals (>108 mmHg and >95%, respectively) were mostly from arterial samples. Third, possible hemolysis, icterus, and lipemia (HIL) interferences were not assessed, although we were aware that these could be present [28]. Lastly, the effect of sample handling in relation to other sources of inaccuracy in blood gas analysis should be considered [29, 30]. However, all samples were homogenized in the same way and processed by the study team, albeit without following any specific protocol.
In summary, requests for blood pH, pCO2, pO2, sO2, or lactate are performed using the same sample, at the same time, and the initial concentration values are not known. Therefore, the strictest criteria for storage temperature should be adopted for all samples, i.e. at 0–3.9°C for 45 minutes. By identifying blood gas stability, laboratory staff could improve the circuits between the laboratory and the hospital. The point-of-care analysis will be implemented in the future; thus, studies are required to demonstrate that the quality of the results is good with improved turnaround times as well as higher patient safety and health care quality.
Go to :
 XML Download