Abstract
Background
Methods
Results
Notes
AUTHOR CONTRIBUTIONS
Conceptualization: JWL and SYL. Methodology: RC, MRC, JP and SYL. Software: RC and MRC. Validation: RC, MRC, JP and SYL. Formal analysis: RC and SYL. Investigation: RC, JWL, HYJ, HWC, HKH, HHK and ESY. Resources: JWL, HYJ, HWC, HKH, HHK and ESY. Data curation: RC and MRC. Writing-original draft preparation: RC. Writing-review and editing: RC, JWL and SYL. Visualization: RC. Supervision: JWL, HHK and SYL. Project administration: JWL and SYL. Funding acquisition: JWL and SYL. All authors have read and agreed to the published version of the manuscript.
REFERENCES
FIGURES AND TABLES
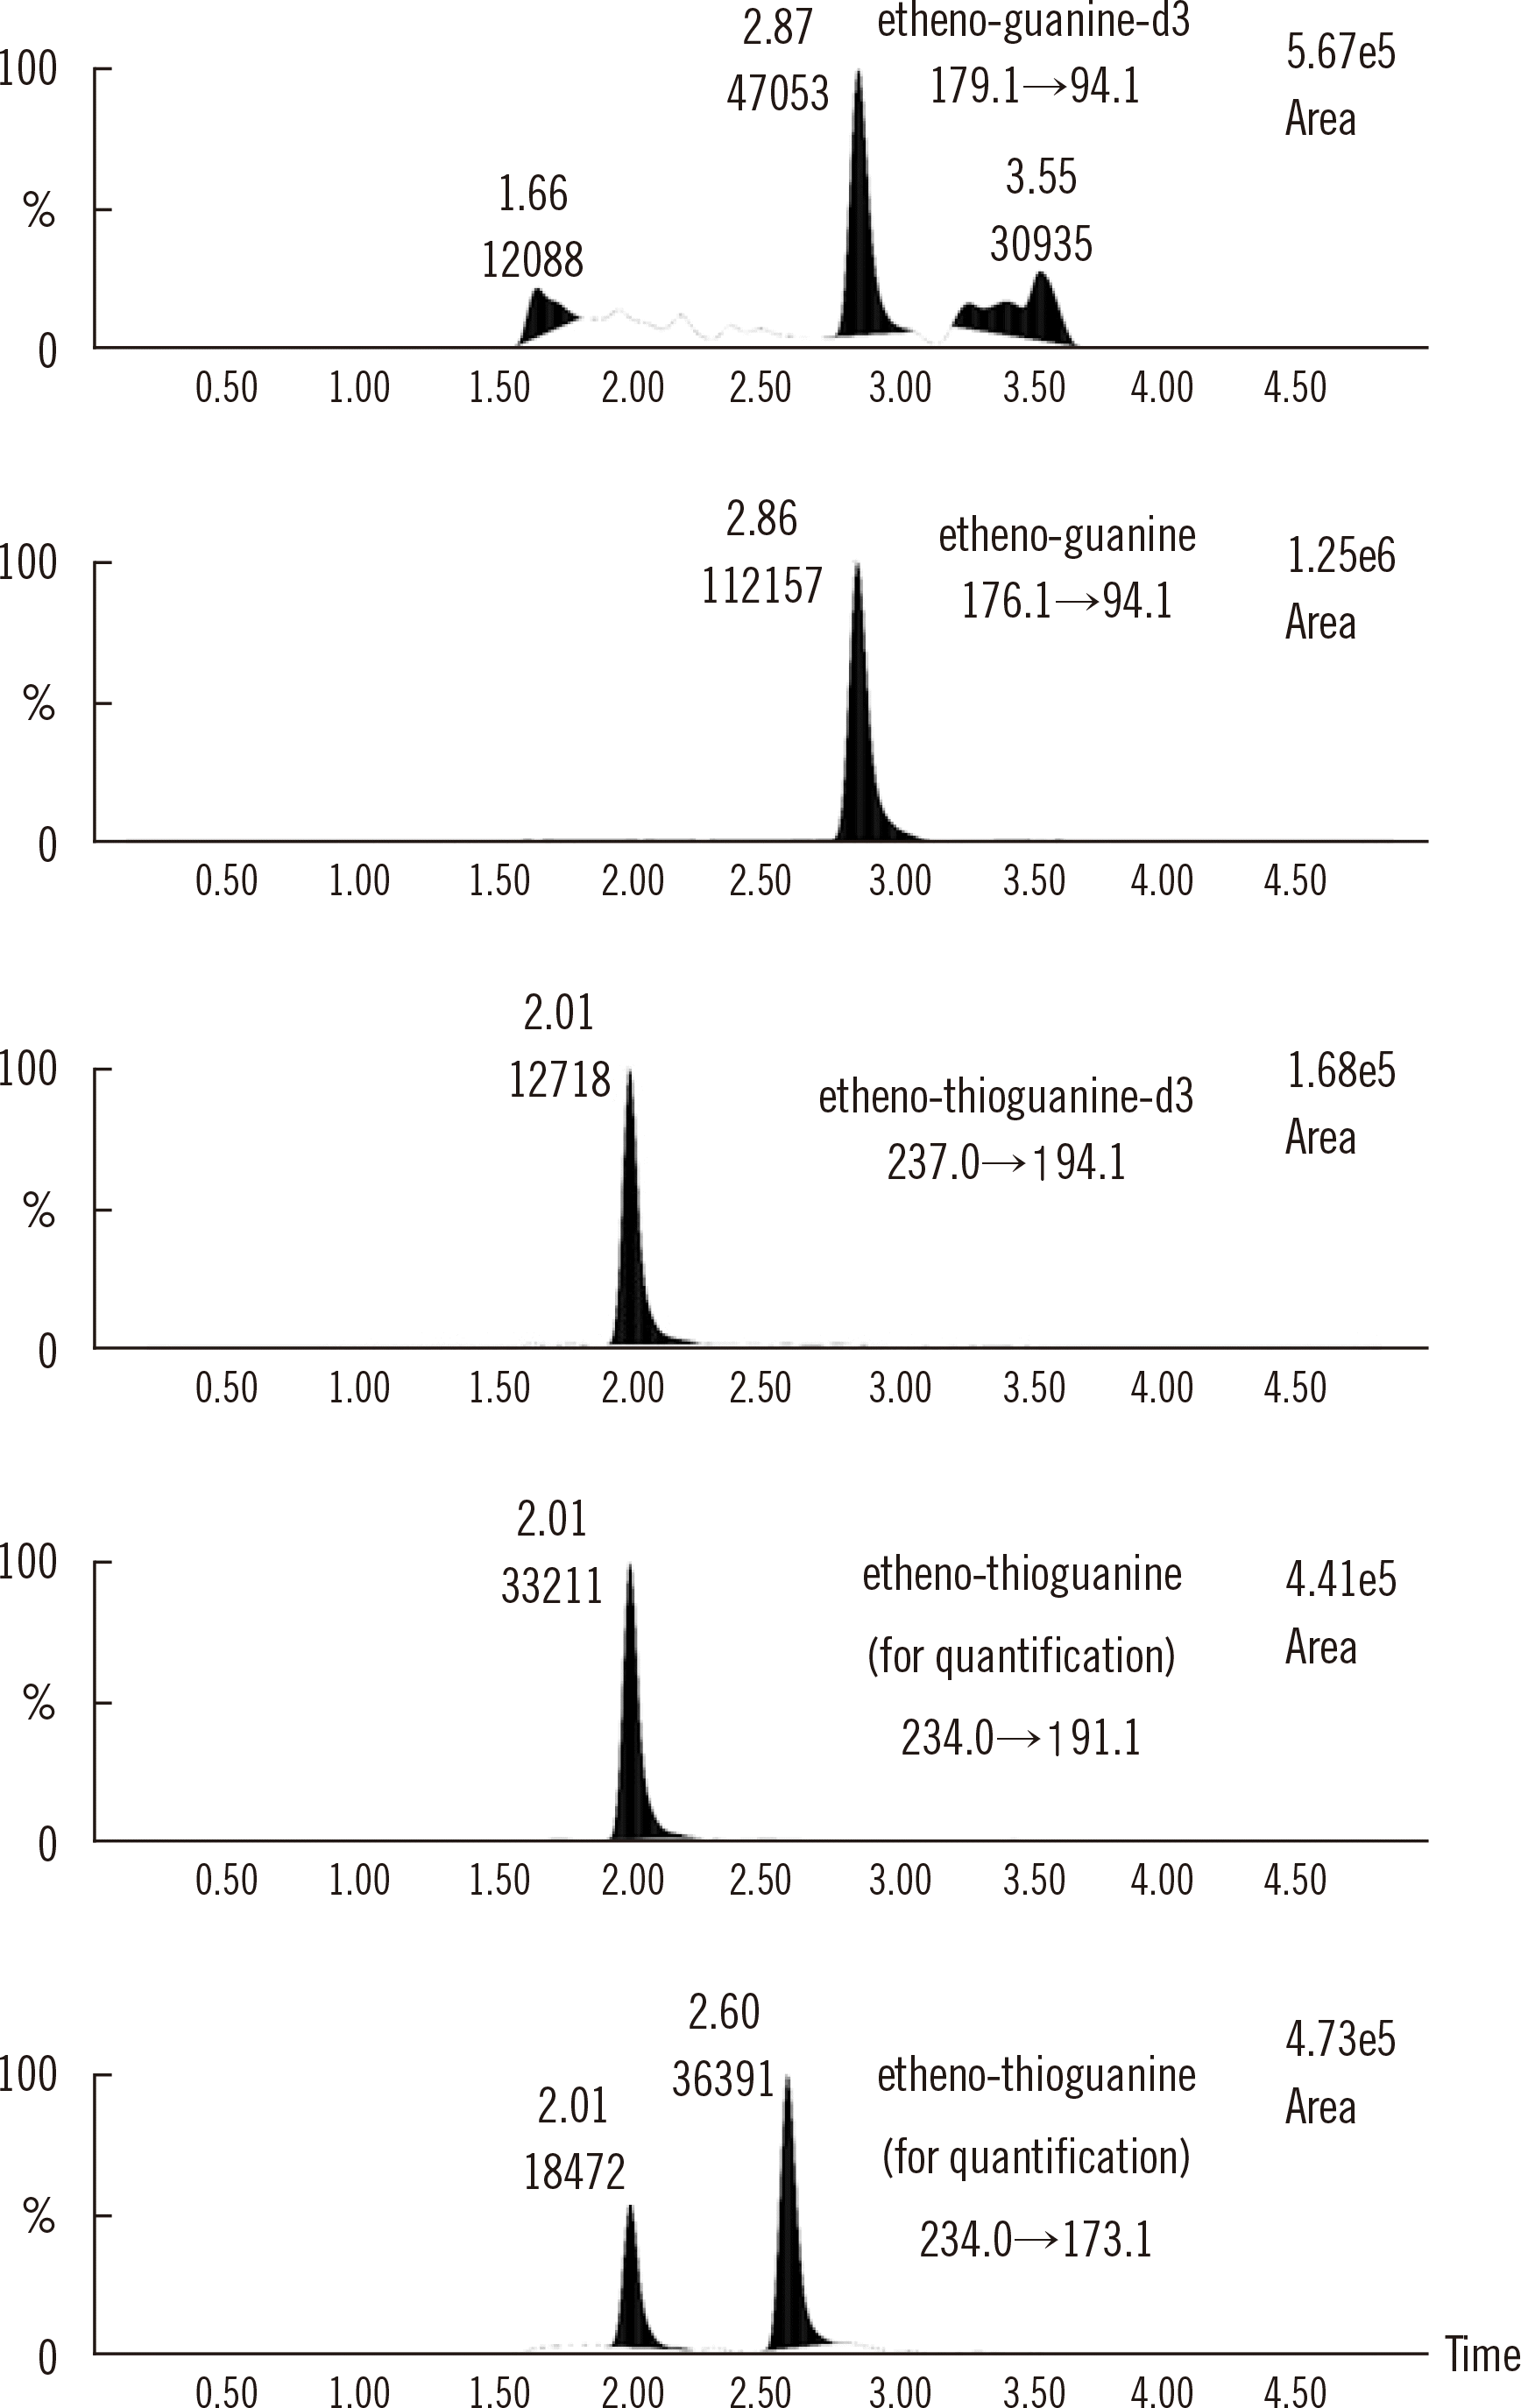
Fig. 1

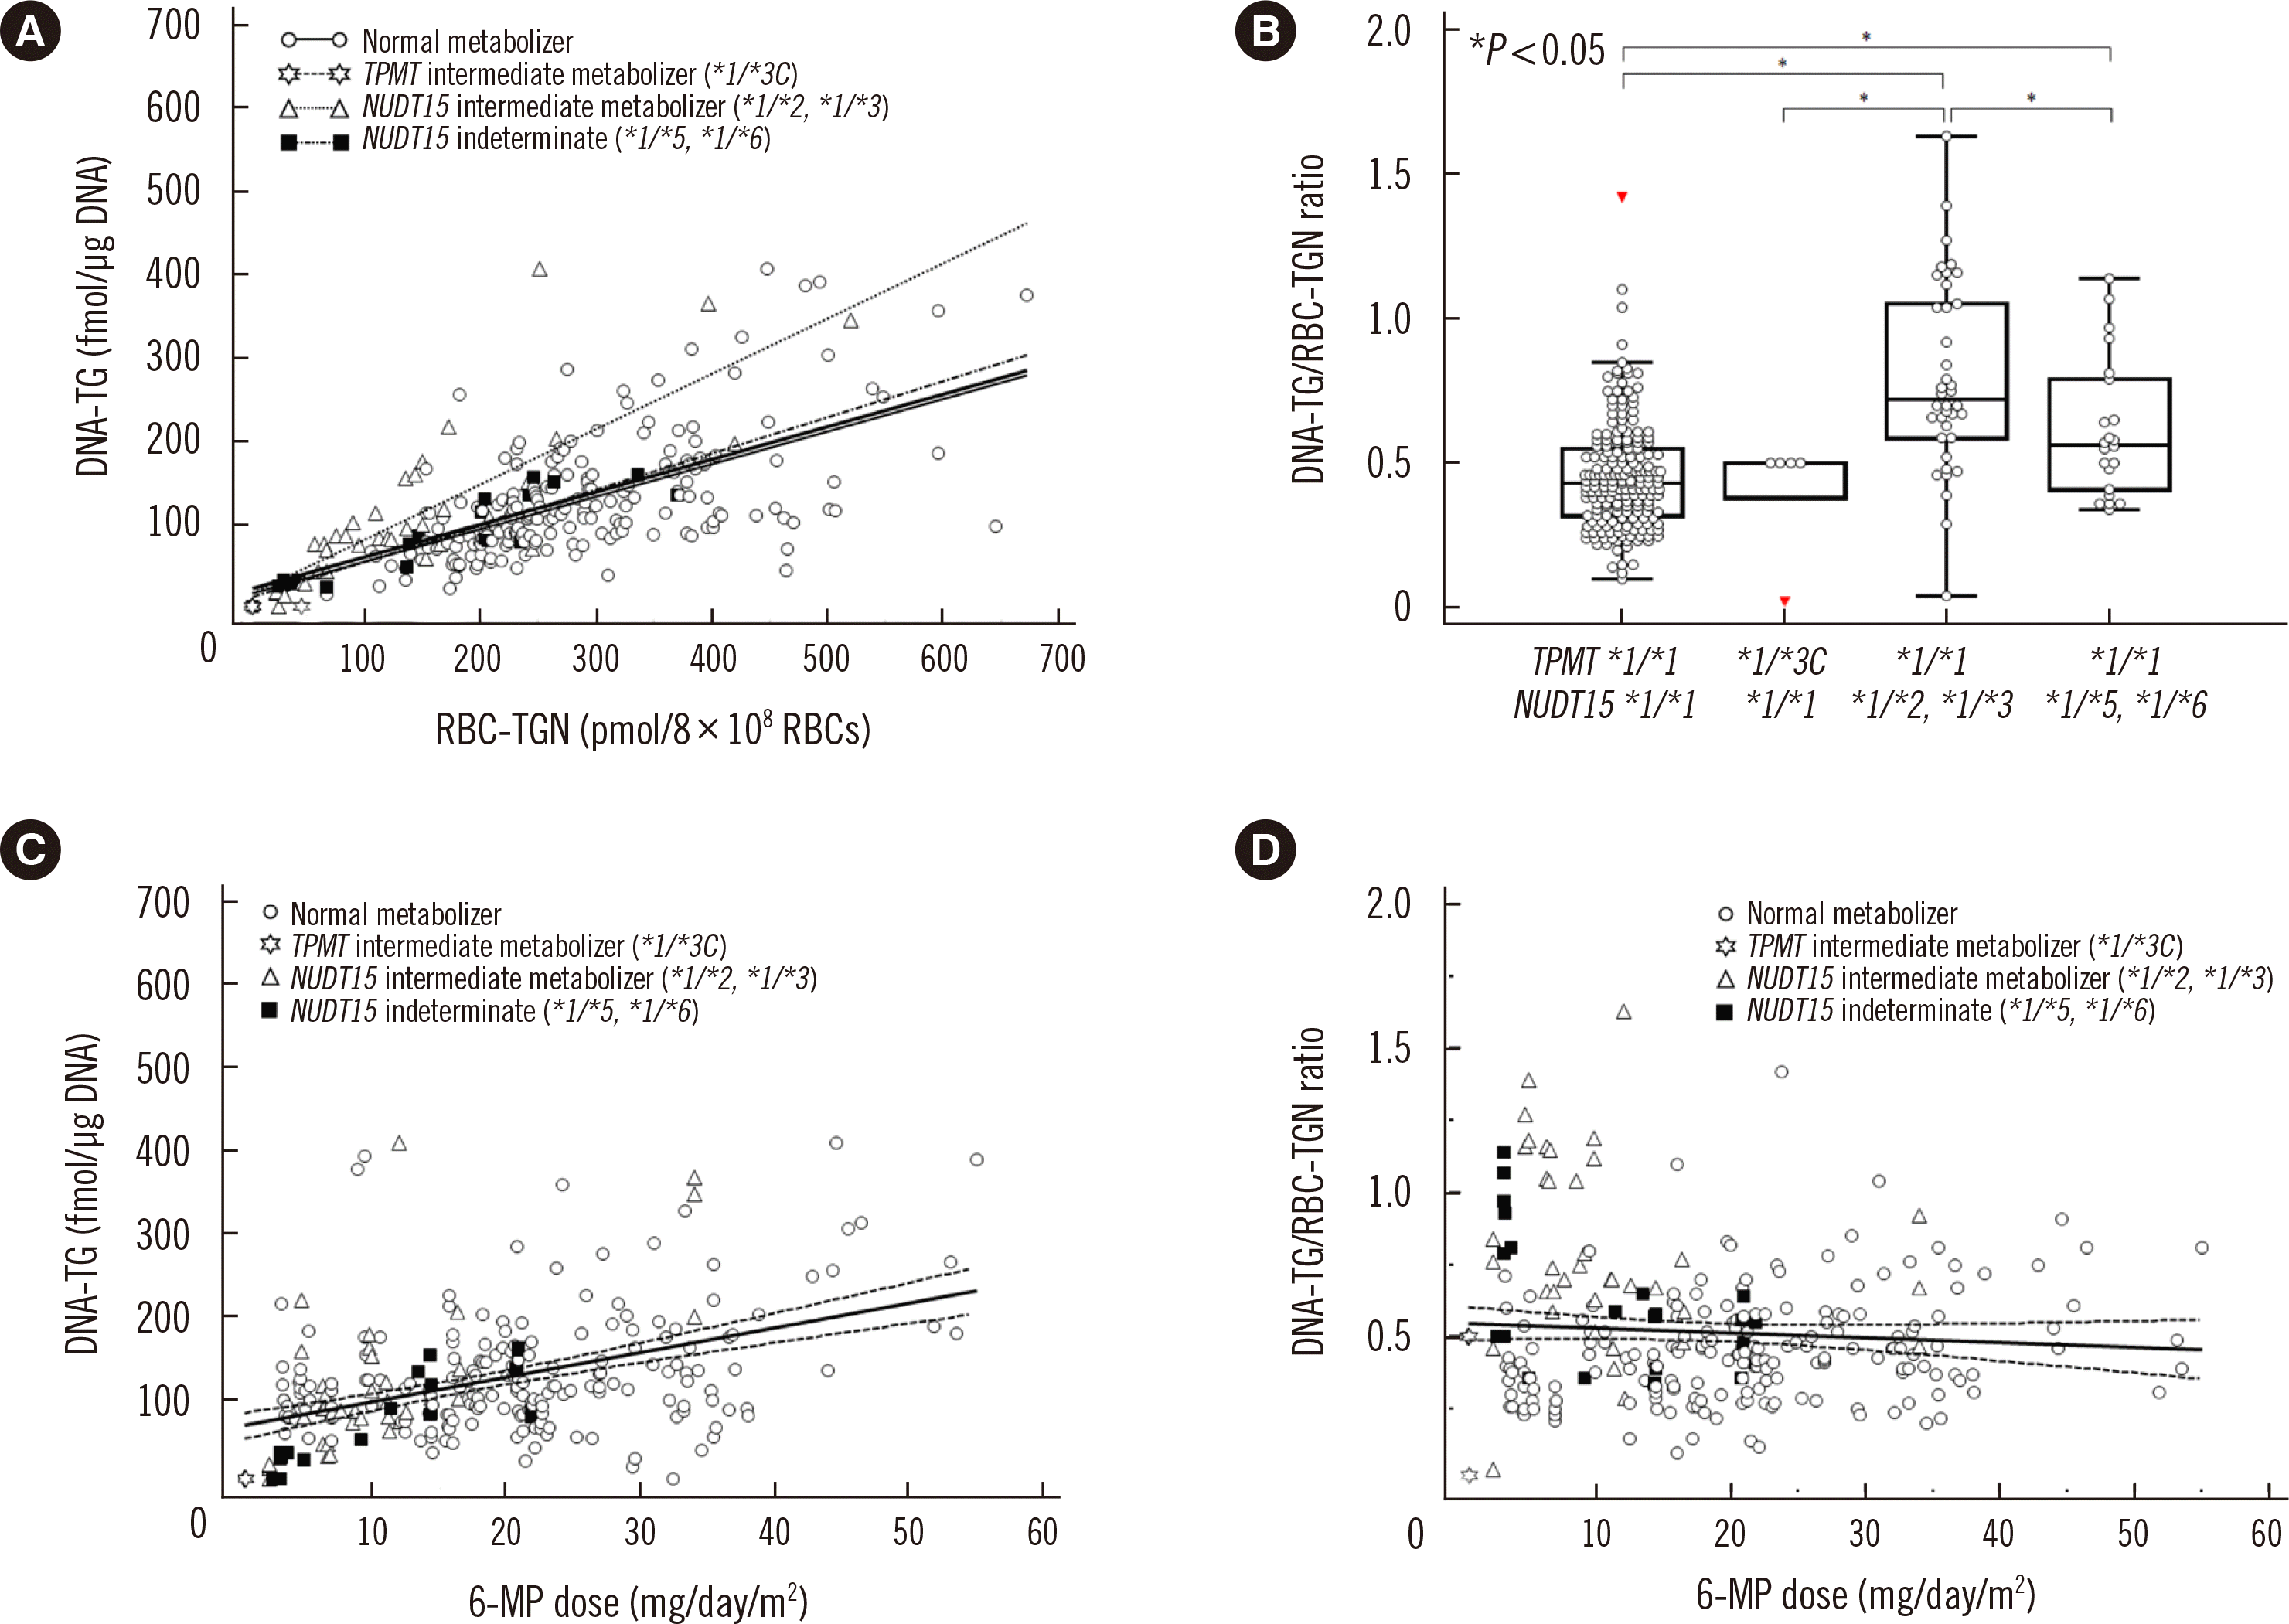
Fig. 2

Table 1
| Time segment | Time (min) | Flow rate (μL/min) | Mobile phase | |
|---|---|---|---|---|
|
|
||||
| %A* | %B† | |||
| 1 | Initial | 0.35 | 0 | 100 |
| 2 | 1.5 | 0.35 | 0 | 100 |
| 3 | 1.8 | 0.45 | 0 | 100 |
| 4 | 2.7 | 0.45 | 0 | 100 |
| 5 | 3.2 | 0.45 | 70 | 30 |
| 6 | 3.7 | 0.45 | 70 | 30 |
| 7 | 3.9 | 0.45 | 0 | 100 |
Table 2
Table 3
Table 4
| Reference | Studied region | Study subjects (N) | DNA-TG (fmol/μg DNA) | RBC-TGN* | Relationship between DNA-TG and RBC-TGN | Genotypes |
|---|---|---|---|---|---|---|
| Warren, et al., 1995 [14] | Norway | 9† | Range 95–700 | NA | NA | NA |
| Jacobsen, et al., 2012 [7] | Denmark | 18 | Median 377 (range 45–1,190) | Exact level NA | Correlated (R2 = 0.78) | NA |
| Nielsen, et al., 2016 [15] | Denmark | 50 | Standard-risk patients: median 469 (range 292–891) | Standard risk patients: median 187 (range 114–508) nmol/mmol Hgb | Positively associated using linear mixed model estimate 1.22 (95% CI, 1.17–1.28, P < 0.0001) | TPMT genotypes |
| Intermediate-risk pati ents: median 435 (range 238–774) | Intermediate risk patients: 217 (range 127–682) nmol/mmol Hgb | |||||
| High-risk patients: median 203 (range 107–389) | High-risk patients: median 267 (range 187–277) nmol/mmol Hgb | |||||
| Nielsen, et al., 2017 [16] | European countries | 750 | In maintenance phase 1: median 326 (IQR 229–457; range 23–1,591) | Exact level NA | Positively associated using multiple linear mixed effect model estimate 1.227 (95% CI 1.175–1.281, P < 0.0001) in exploratory cohort (N = 42) and 1.137 (95% CI 1.118–1.155, P < 0.0001) in validation cohort (N = 304) | TPMT genotypes |
| In maintenance phase 2: median 509 (IQR 391–666; range 44–1,559) | ||||||
| Moriyama, et al., 2016 [5]‡ | Japan | 32 | Normal NUDT15 diplotypes: 9.6 ± 4.1 | NA | NA | Both NUDT15 and TPMT genotypes |
| Children with one NUDT15 variant allele: 12.3 ± 4.5 | ||||||
| One child with two NUDT15 variant alleles: 32.4 | ||||||
| Singapore | 32 | Normal NUDT15 diplotypes: 6.0 ± 2.7 | NA | NA | ||
| Children with one NUDT15 variant allele: 8.8 ± 5.3 | ||||||
| Children with two NUDT15 variant alleles: 19.6 ± 6.3 | ||||||
| Moriyama, et al., 2017 [4] | Japan | 55 | Mean 442.8 (range 78.1–1,054.0) | Mean 134.1 (range, 0.46–315.5 pmol/4 × 108 RBCs) | Correlated using Spearman rank test (R2 = 0.16, P = 0.0007) | NUDT15 genotypes (only common TPMT risk variants were analyzed, but no patients with TPMT risk variants were included) |
| This study | South Korea | 54 | Median 106.0 (range < 10.0–407.8) | Median 238.1 (range < 10.0–672.5 pmol/8 × 108 RBCs) | Correlated using Spearman rank test (R = 0.68, P < 0.0001) | Both NUDT15 and TPMT genotypes (by direct sequencing to identify all variants) |
| Normal NUDT15 diplotypes: 111.3 (IQR 79.1–156.4; range < 10.0–407.5) | ||||||
| Children with one NUDT15 variant allele: 83.8 (IQR 38.6–134.4; range < 10.0–407.8) |
*RBC-TGN levels were differently expressed using different units in previous studies; †Ages of study subjects were not reported. Study subjects in the other studies were pediatric ALL patients. ‡Mean (±SD) DNA-TG level was expressed as fmol/μg DNA/mg mercaptopurine.
Abbreviations: ALL, acute lymphoblastic leukemia; 6-MP, mercaptopurine; CI, confidence interval; DNA-TG, DNA-incorporated 6-thioguanine; Hgb, hemoglobin; IQR, interquartile range; NA, not available; TPMT, thiopurine S-methyltransferase; RBC, red blood cell; RBC-TGN, 6-thioguanine nucleotide in erythrocytes.


 PDF
PDF Citation
 Print
Print


 XML Download