

 PDF
PDF Citation
 Print
Print


INTRODUCTION
Chronic lymphocytic leukemia (CLL) is a disease with variable clinical history and survival ranging from only a few months to over 15 years. The reason that some patients experience a benign stable disease course over many years while others have a progressive disease has been attributed to differences in the genetic characteristics of the leukemic clone [1].
The heterogeneity in CLL stems from the complex interplay of different intrinsic and extrinsic mechanisms, making CLL a prototype for cancers in which tumor initiation and progression are linked to a combined effect of these mechanisms. The cell-intrinsic factors include more general cancer-associated mechanisms, e.g., activation of oncogenes (e.g. NOTCH1) and/or elimination of tumor suppressor genes (e.g., TP53 and ATM), with certain aberrations, most notably those disrupting the TP53 gene, strongly influencing disease outcome [2].
Disease-related factors have been identified to further classify CLL into biologically and clinically distinct subtypes. Recently identified disease parameters, such as the presence of mutations involving the TP53, ATM, NOTCH1, SF3B1, and MYD88 genes and an unmutated IGHV gene, impact survival outcomes and can help categorize CLL into clinically distinct subtypes [3]. Genomic aberrations in CLL have been reported as independent predictors of disease progression (Dohner hierarchial classification) and survival, and have implications for the design of risk-adapted treatment strategies [4]. Therefore, information regarding the genetic aberrations has produced clinically useful information that can aid in risk stratification, deciding therapy, and prognostication of CLL patients.
Incidence of CLL exhibits distinct patterns reflecting racial disparity. SEER revealed a fivefold increased risk of CLL in African-Americans compared to Caucasians, which is suggested to be due to either inherent race-related genetic susceptibility or differences in environmental factors between African-Americans and Caucasians in the US, or possibly due to some combination of both [5]. Variable risk of acquiring CLL across different races supports the hypothesis of race-related genetic predisposition. This also reflects unknown environmental influences possibly interacting with genetic factors. South Asian CLL patients have been reported to have more rapid disease progression than Caucasians [5].
CLL presents at a younger age in Indian patients. The presence of geographical and genetic variations in CLL patients has been reported and may be responsible for this variable clinical characteristic in Indian CLL patients [6]. Given that the incidence and disease manifestations are affected by the geographic and genetic factors, we performed genomic profiling on our group of CLL patients.
Genomic aberrations were analyzed in this study by multiplex ligation-dependent probe amplification (MLPA). MLPA is a variation of a polymerase chain reaction based technique and can simultaneously detect copy number changes, DNA methylation, and point mutations of up to 50 genomic DNA sequences in a single experiment [7]. Previous studies have demonstrated that MLPA is an acceptable technique to detect genomic aberrations in CLL and exhibits good correlation with FISH results in CLL patients [8-11]. Additionally, MLPA has the advantage of being faster and more cost-effective than FISH. While FISH provides information for only a limited number of genomic targets at the same time, MLPA can detect copy number alterations and point mutations simultaneously in multiple target regions.
Go to : 
MATERIALS AND METHODS
Fifty-two consecutive, newly diagnosed and treatment-naïve CLL patients were included in the study.
Nine healthy adult subjects (controls) were also enrolled in the study for the purpose of obtaining normal reference DNA samples. The study was approved by the Institutional Ethics Review Board and informed consent was obtained from all participants (patients and controls) in accordance with the Declaration of Helsinki. CLL was diagnosed per the International Workshop on Chronic Lymphocytic Leukemia (iwCLL) criteria [12]. Diagnostic criteria included the presence of clonal B-lymphocytosis (≥5×10⁹/L) in peripheral blood (persistent for at least 3 months), with typical CLL immunophenotype.
Molecular genetic testing
Peripheral blood samples collected in 3 mL EDTA anticoagulated tubes were used for genetic testing.
DNA was extracted using the QIAmp DNA Blood Mini kit (Qiagen, Hilden, Germany) according to the manufacturer’s instructions. DNA purity and concentration was measured spectrophotometrically using a Nanodrop 2000 (Thermo Fisher Scientific Inc., Waltham, MA, USA), and a 260/280 ratio between 1.8-1.9 was considered pure.
MLPA
Extracted DNA was analyzed by MLPA using the SALSA MLPA Probemix P038 CLL from MRC Holland (Amsterdam, The Netherlands). This Probemix kit detects the status of 13q14 deletion (RB1/DLEU/MIR15A; 10 probes), 11q22-3 deletion (ATM; 7 probes), 17p13 deletion (TP53; 8 probes), and the presence of trisomy 12 (10 probes). Additionally, three probes specific for the NOTCH1 7541-7542delCT, SF3B1 K700E, and MYD88 L265P mutations, which only generate a signal when the particular mutation is present, are included in the same kit.
Peripheral blood samples from healthy donors were used as reference controls. At least three controls were used per run (up to 21 test samples). For every subsequent seven test samples, one additional control was taken.
Brief methodology for MLPA [9]
MLPA consists of following steps:
DNA denaturation: The optimal amount (50–100 ng) of genomic DNA from patients and reference controls is denatured at 98°C for 5 minutes, followed by cooling to 25°C before removing the tubes from the thermocycler.
Hybridization reaction: 3 μL hybridization master mix (1.5 μL MLPA buffer+1.5 μL Probemix) is added to each sample tube containing denatured DNA and incubated at 60°C for 16–20 hours (overnight).
Ligation reaction: 1 μL Ligase-65 enzyme and 32 μL ligase master mix (consisting of 26 μL ultrapure water, 3 μL Ligase Buffer A, and 3 μL Ligase Buffer B) is added to each reaction tube while in the thermocycler. Samples are incubated for 15 minutes at 54°C (for ligation) and the Ligase-65 enzyme is subsequently heat inactivated at 98°C for 5 minutes, followed by cooling to 20°C before removing the tubes from the thermocycler.
PCR amplification: 10 μL master mix (7.5 μL ultrapure water+2 μL SALSA PCR primer mix+0.5 μL SALSA Polymerase) is added to each tube at room temperature. The tubes are then placed in the thermocycler (35 cycles of amplification at 95°C for 30 seconds, 60°C for 30 seconds, and 72°C for 60 seconds; followed by incubation at 72°C for 20 min).
Fragment separation by capillary electrophoresis: Fragments were separated using the fragment analysis program on an ABI-3500 (Applied Biosystems, Foster City, CA, USA) analyzer. For each sample, the injection mixture, consisting of 0.7 μL PCR product, 0.2 μL Applied Biosystems GeneScan 500 LIZ size standard, and 9 μL HiDi formamide, is added to plate. The plate is sealed and heated for 3 minutes at 98°C, then cooled for 2 minutes to 4°C before it is placed on the analyzer.
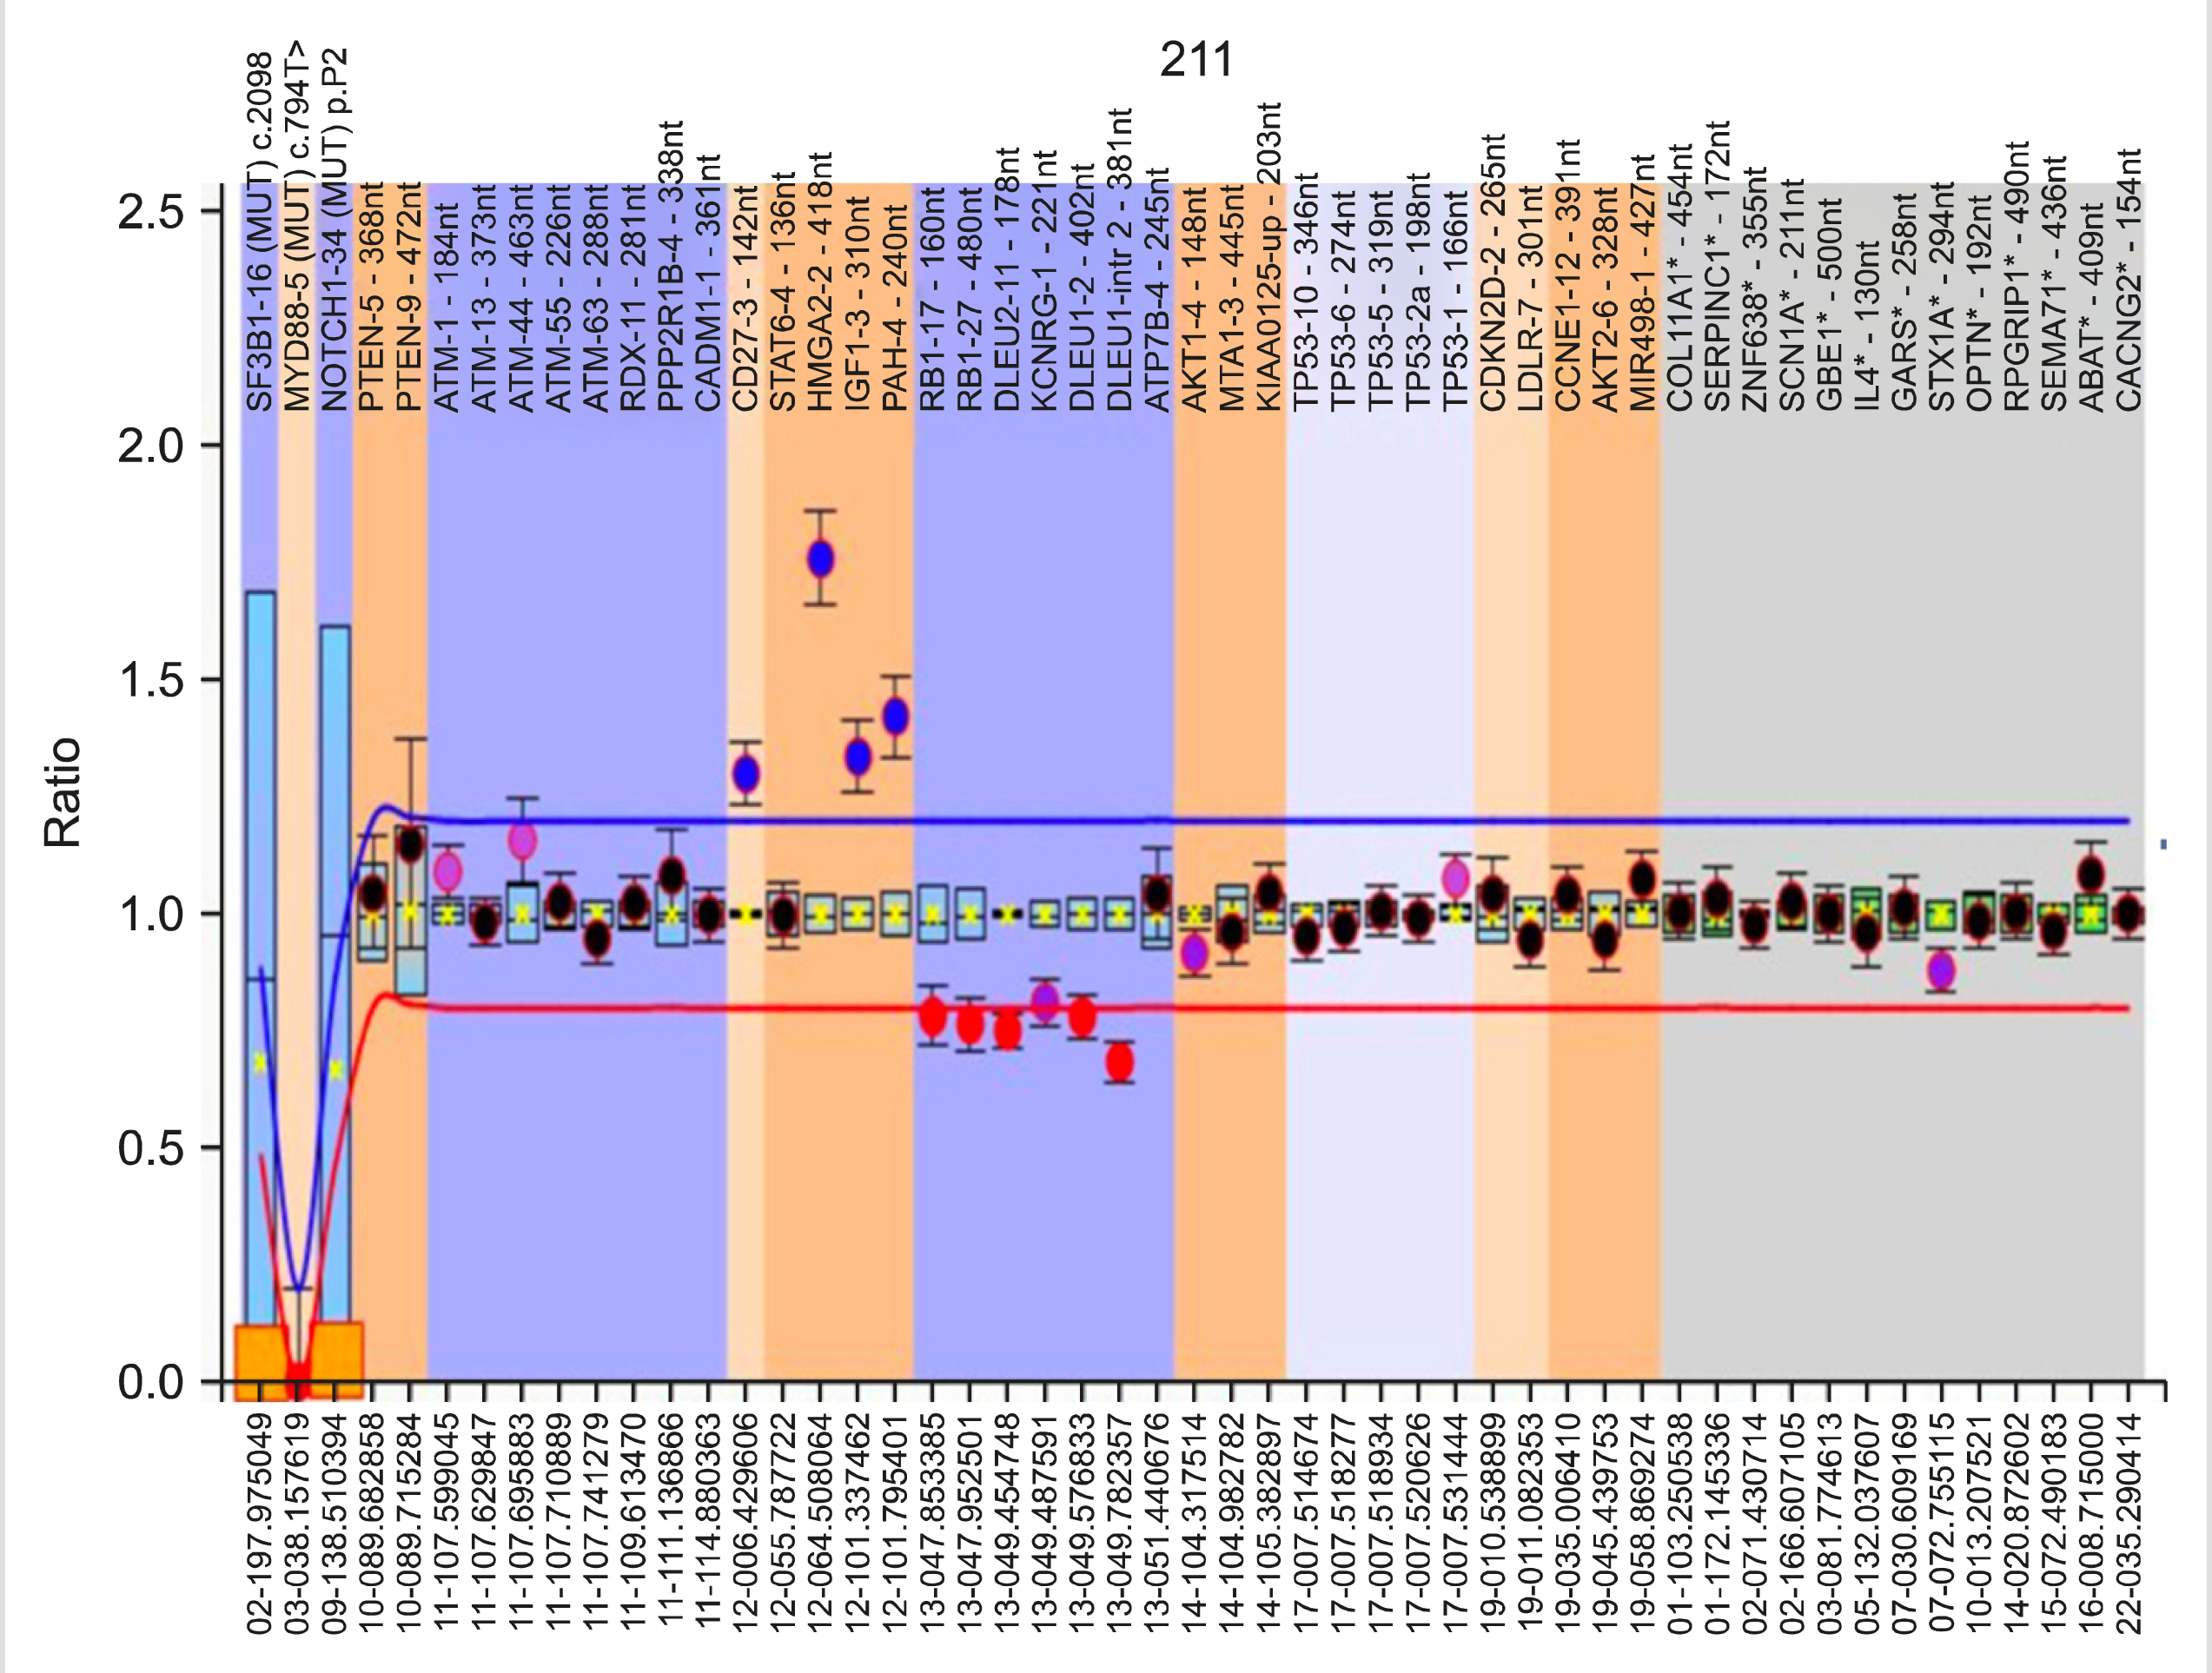
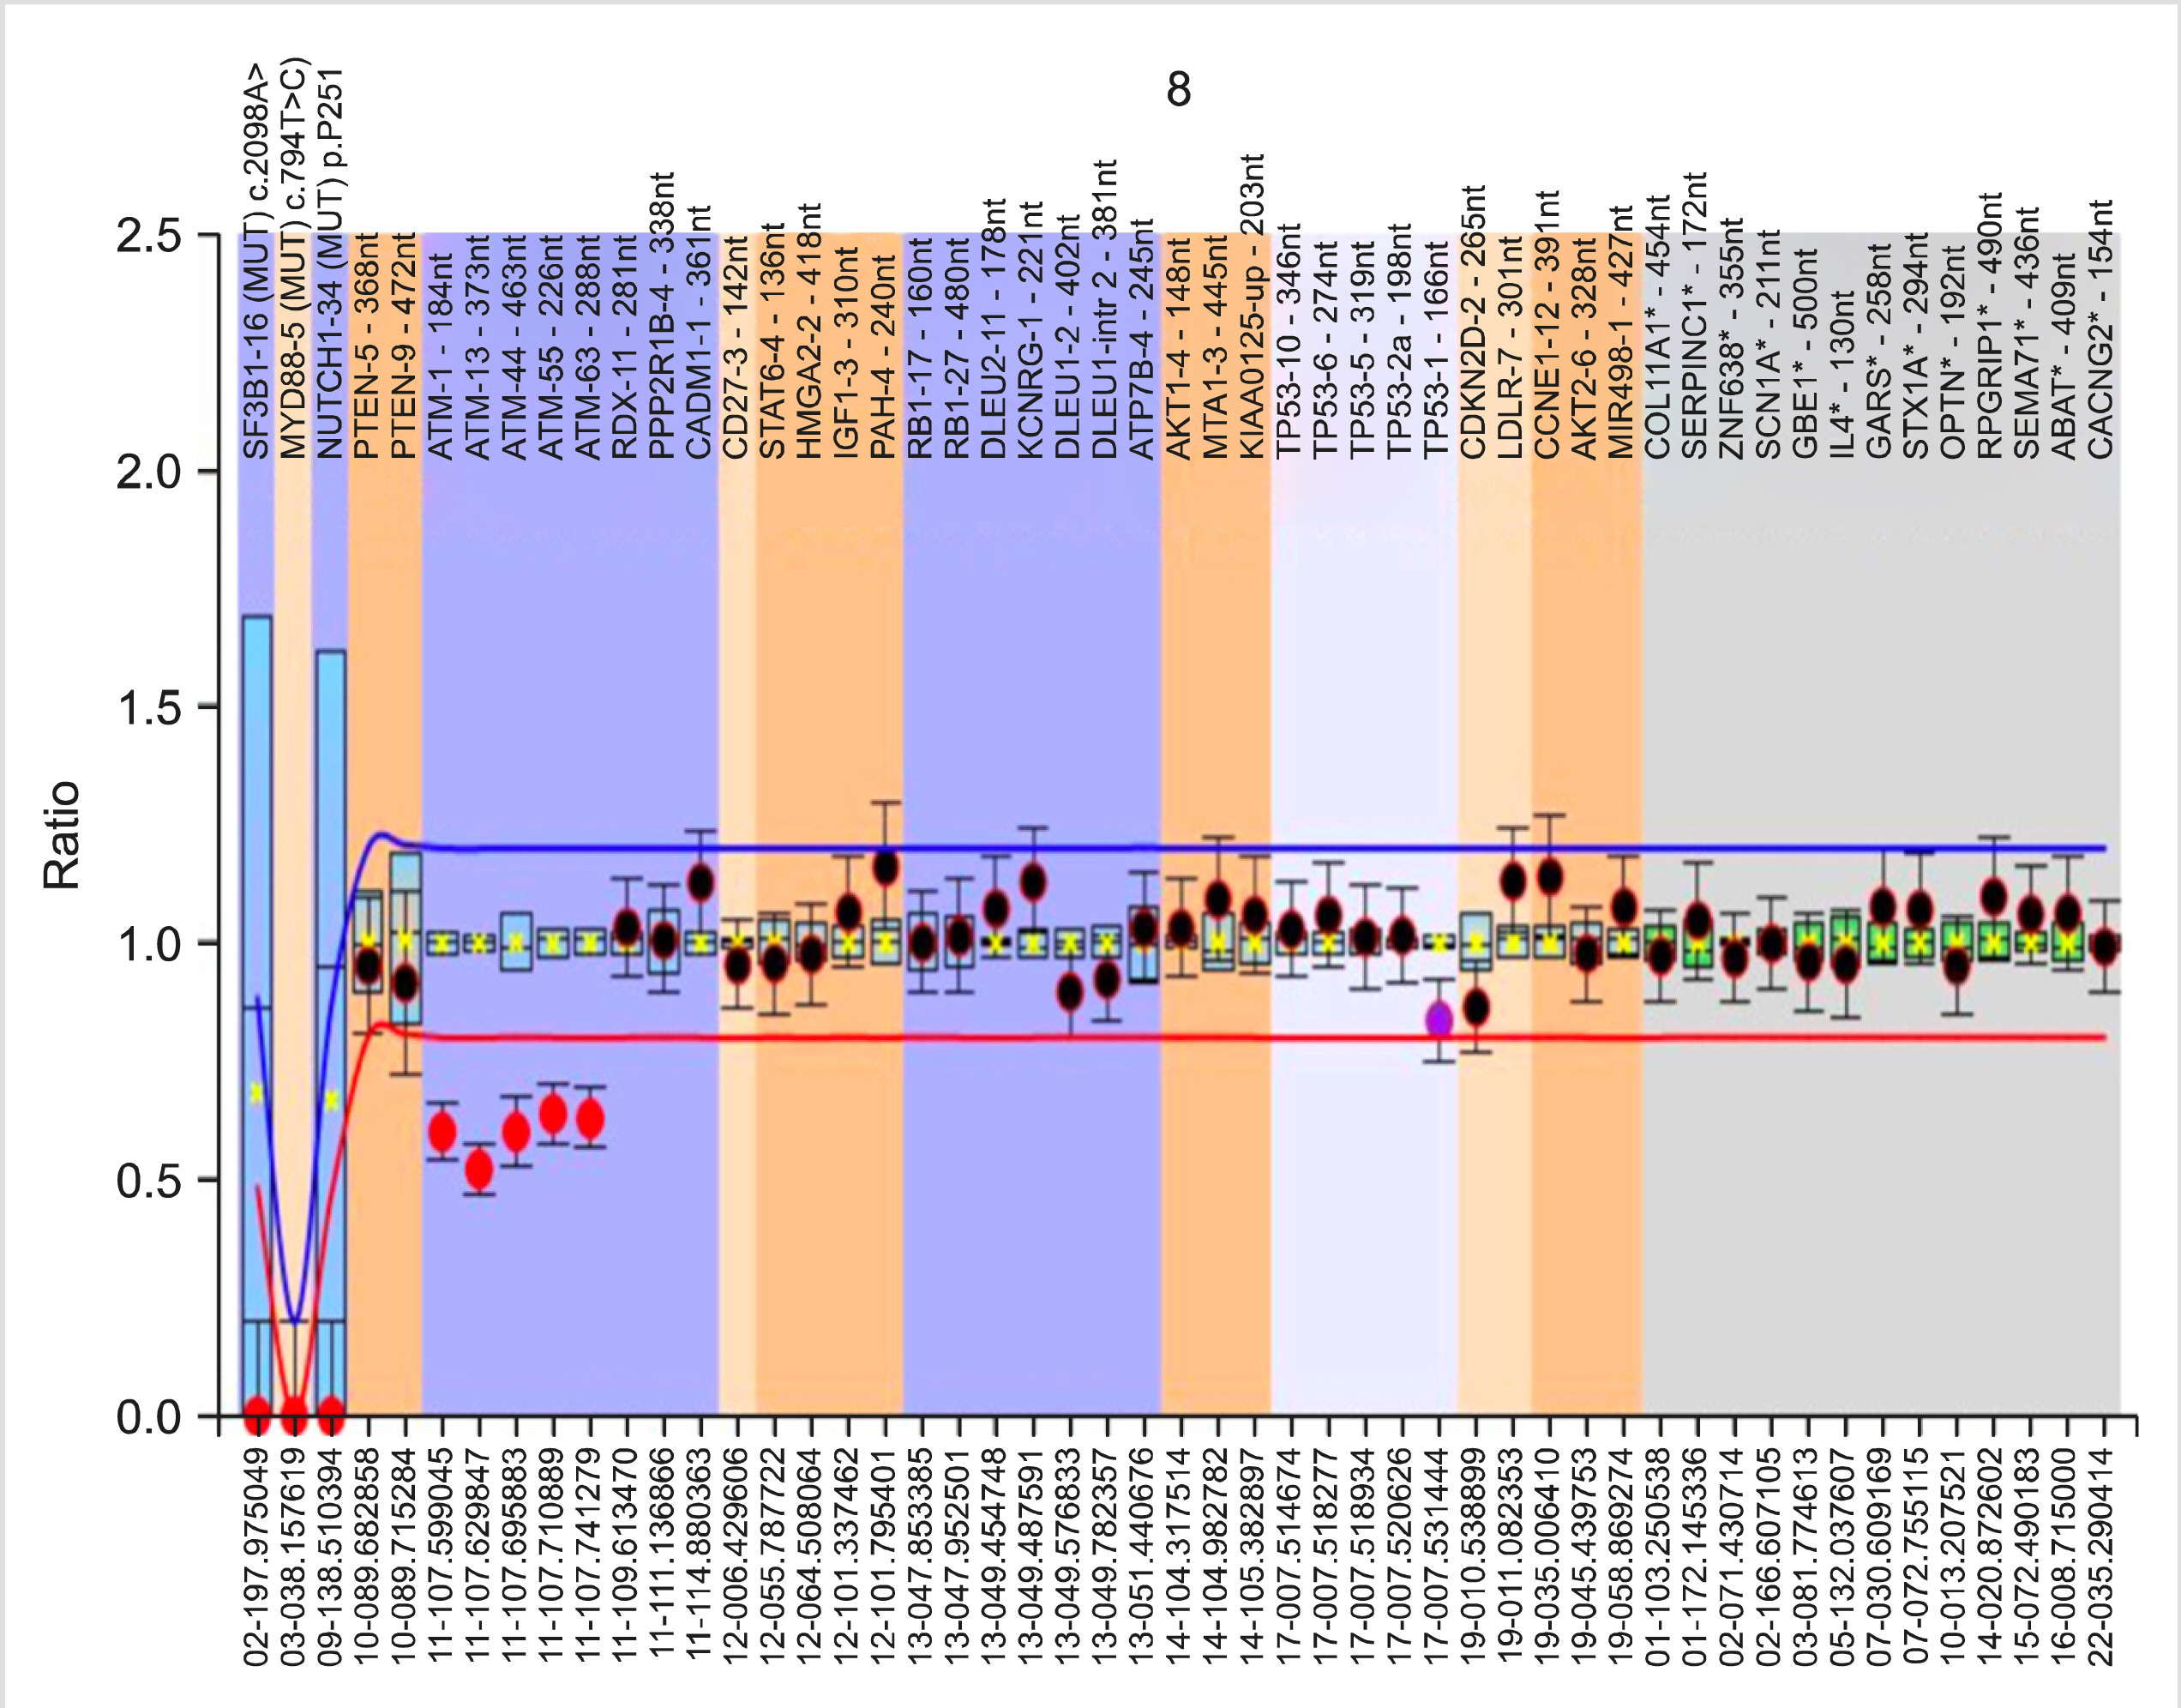
Analysis using Coffalyser.Net: A test DNA sample without copy number abnormalities exhibits an identical peak pattern to that of the reference samples, i.e., the final probe ratios were determined to be close to 1.0. This final probe ratio is also called the Dosage Quotient (DQ). Coffalyser.Net software calculates the DQ for each probe in each sample. DQ values between 0.80 and 1.20 were considered to be normal (identical to reference samples). DQ values less than 0.8 were considered to be deletions, and DQ values greater than 1.2 were considered to be amplifications. For heterozygous deletions, the DQ was ∼0.5. DQ values near 0.0 were considered to be homozygous/biallelic deletions.
Go to :
RESULTS
The study prospectively included 52 newly diagnosed treatment- naïve cases of CLL. There was male predominance (male:female ratio=2:1), with a median age of 65 years (range, 43–88 yr).
The median hemoglobin, total leukocyte count, absolute lymphocyte count, and platelet count was 12.4 g/dL, 57.7×10⁹/L, 52.0×10⁹/L, and 176.5×10⁹/L, respectively. The distribution of cases according to Rai stage was: stage 0, 31%; stage I, 21%; stage II, 23%; stage III, 15%; and stage IV, 10%. The details of the clinico-hematological parameters are summarized in Table 1.
Table 1
Baseline parameters of CLL patients (N=52).
![]()
Two patients were positive upon direct antiglobulin test (DAT) and were diagnosed with autoimmune hemolytic anemia. Of these two cases, one showed 3+ IgG positivity and the other had 4+ IgG positivity on poly-specific gel card-based DAT.
Flow cytometry-based immunophenotyping was performed in all cases. CLL diagnosis was confirmed by the presence of typical immunophenotypic features associated with CLL. However, 19 cases (36%) exhibited some aberrancies known to occur in CLL immunophenotype. The shift from the usual immunophenotype is mentioned in Table 1.
Genetic abnormalities
Among the 52 cases, a majority (34 cases, 65%) had one or more cytogenetic abnormality detected by MLPA. Eighteen patients (35%) lacked copy number variations in any of the probes in the Probemix. Twenty-eight cases (54%) revealed a sole cytogenetic anomaly, the details of which can be found in Table 2. Six cases had an additional genetic abnormality. Among the somatic mutations, only one case exhibited NOTCH1 c.7541_7542delCT mutation.
Table 2
Cytogenetic abnormalities and somatic mutations detected by MLPA (N=52).
![]()
Among the 22 cases with 13q14 deletion, both type 1 and type 2 deletions were detected. The minimally deleted region (MDR), including the Deleted in Lymphocytic Leukemia-2 gene (DLEU2) (containing mir-15a/mir-16-1), was deleted in all cases, along with a portion of the DLEU1 gene. Type 1 deletions involving only DLEU/mir-15/mir-16 were detected in 14 cases (64%). The larger type 2 deletion, which also involved the RB1 gene, was observed in the remaining 8 cases (36%). In the five cases harboring 11q deletion, multiple probes targeting different ATM gene sections revealed that varying lengths of the ATM gene were deleted. The neighboring RDX-11 gene was also deleted in two of the five cases, and the PPP2R1B-4 gene, which is located next to RDX-11 gene locus, was also deleted in one of these cases.
Six cases exhibited more than one cytogenetic abnormalities (Table 3). Two cases with 13q14 deletion also had Cyclin Dependent Kinase Inhibitor 2D gene (CDKN2D-2; located at 19p13.2) gain/amplification. One case with 13q14 deletion also had 17p13 deletion. CDKN2D-2 deletion was also detected in one case with trisomy 12. The presence of trisomy 12 was also detected in one case that also had 13q14 deletion (type 2). Another case with trisomy 12 exhibited heterozygous NOTCH1 c.7541_7542delCT mutation. MYD88 L265P and SF3B1 K700E point mutations were not detected in any of the 52 cases.
Table 3
Brief details of the cases with two concurrent genetic abnormalities.
![]()
Correlation of cytogenetic abnormalities with clinico-hematological parameters
Of all the variables, only hemoglobin concentration, Binet stage, and presence of elevated LDH level were statistically significantly correlated with cytogenetic abnormalities. Cases with high risk cytogenetics, del(11q), and del(17p) had a lower mean hemoglobin concentration compared to cases in other cytogenetic groups. This indicates that cases with high risk cytogenetics presented more often with cytopenia in the study cohort (Table 4).
Table 4
Correlation of clinical and laboratory variables with cytogenetic abnormalities.
![]()
Treatment and follow-up details
The median follow-up period (FUP) of the study cohort was 5.5 months (range, 0–18 mo). Seventeen cases were lost to follow-up following the primary diagnosis. Of the remaining 35 cases, 9 (25.7%) were offered treatment. Of these nine cases, five were treated with Bendamustine plus rituximab, three were treated with chlorambucil plus rituximab, and one was treated with chlorambucil plus prednisolone. Lenalidomide was used for maintenance therapy. Twenty-six cases (74.3%) remained under observation with regular follow-up visits and a ‘watch and wait’ policy was followed.
None of the treated cases and cases under observation died or had documented disease progression or transformation at the end of the study period.
Details of all cases with cytogenetic abnormalities in relation to treatment and follow-up are out-lined in Table 5.
Table 5
Cases with cytogenetic abnormalities - details of staging, treatment and follow-up.
![]()
Correlation between cytogenetic abnormalities and disease progression
Univariate and multivariate logistic regression analyses were performed to study the effect of various clinico-hematological parameters on the time to treatment (<8 mo). Given the limited number of patients with 11q and 17p deletions, cytogenetic abnormalities were partitioned into three risk groups. The low risk group consisted of 13q deletion and no detected abnormality (normal); the intermediate risk group had trisomy 12; and the high-risk group included 11q and 17p deletions.
Univariate analysis revealed that hemoglobin concentration, presence of organomegaly, involvement of three or more lymph node groups, modified Rai stage, Binet stage, LDH and β2- microglobulin levels, and cytogenetic risk group were significantly correlated with a shorter time to treatment (Table 6). However, multivariate logistic regression found only elevated LDH and β2-microglobulin levels, and the involvement of three or more lymph node groups to be statistically significant (P<0.05) (Table 7). This indicates that, in our cohort, primarily patients with bulky disease/ symptomatic lymphadenopathy required earlier initiation of chemotherapy in accordance with the established iwCLL guidelines.
Table 6
Univariate logistic regression analysis showing the impact of variables on time to treatment.
![]()
Table 7
Multivariate logistic regression analysis showing the impact of variables on time to treatment.
![]()
Go to :
DISCUSSION
CLL is a clinically heterogeneous disease; while some patients undergo rapid disease progression, others have an indolent course and survive for decades. The environmental and genetic factors have been implicated for this variation [6].
Up to 80% of CLL cases possess chromosomal alterations detected by molecular cytogenetics. In our study, we identified chromosomal alterations in 65% of the patients. The incidence of 13q deletion, trisomy 12, and 11q deletion did not deviate from previous reports, except for 17p deletion [4, 13, 14]. Our study cohort had a relatively lower incidence (4%) of 17p deletion compared to both Western and Indian studies. This difference is most likely due to the smaller study cohort and patient selection. However, 17p deletion incidence as low as 2–4% has been previously reported [8].
Using multiple probes per locus in the MLPA Probemix, we revealed that the size of the 13q14 deletion is heterogeneous. Of the 22 cases with 13q14 deletion, the RB1 gene was deleted in only eight cases. Ouillette et al. [15] referred to these as type 2 deletions, whereas those that did not include the RB1 gene were referred to as type 1 deletions. The significance of large 13q14 deletions is emphasized by the involvement of multiple genomic loci, including miR15a/16-1 microRNAs and RB1 genes that are involved in key biological pathways, such as cell cycle control and NF-κB signaling [15-17]. In our study, the DLEU locus was included in all cases with 13q14 deletion. This genetic locus encodes for mir-15a/mir16-1 microRNAs, which function as tumor suppressors. Although, biallelic deletions are reported to occur in nearly one-fourth of CLL cases with 13q deletion, only one case in our cohort exhibited biallelic deletion [18]. The remaining del(13q) cases were heterozygous (monoallelic) deletions.
Six of the 34 cases also had additional cytogenetic abnormalities. The presence of multiple genetic aberrations has been well documented in CLL and contributes to disease heterogeneity [16]. One case with trisomy 12 also carried a NOTCH1 mutation. Trisomy 12 is associated with the presence of NOTCH1 mutations, potentially explaining the relatively poorer prognosis of trisomy 12 cases compared to del(13q) cases [19].
Three cases also exhibited gain or loss of the CDKN2D-2 gene locus. Al Zaabi et al. [8] detected the gain of the 19p13.2 CDKN2D locus in 14 patients using MLPA. This was accompanied by loss of the LDLR gene, which is located in same chromosomal region, indicating the presence of trisomy 19. However, in our study, the two cases with CDKN2D-2 gains (heterozygous) were not associated with abnormalities detected by other probes directed at the 19p13 region. Small intragenic deletions of the 19p13.2 CDKN2D locus detected by MLPA has also been reported by Abdool et al. [20]. However, these abnormalities should be confirmed by additional testing.
The median time to first treatment is reported to be shorter in CLL patients with high risk cytogenetics (11q and 17p deletion) [21, 22]. In our study, univariate regression analysis revealed that cytogenetic risk was significantly correlated with earlier initiation of therapy. However, in a multivariate regression model, the association between time to treatment and cytogenetic risk was not statistically significant. Therefore, a longer study period utilizing a larger study cohort would be required to better analyze the impact of cytogenetics on time to treatment in our population.
A better understanding of the underlying genetic abnormalities in CLL patients will help improve risk stratification and provide new targets for future therapies, especially with regards to personalized medicine. There is limited literature detailing the cytogenetic profiles of Indian CLL patients. This study extends the data further, providing insights into the distribution of genetic abnormalities among CLL patients in the Indian population.
Go to :
 XML Download