

 PDF
PDF Citation
 Print
Print


INTRODUCTION
Human leukocyte antigen (HLA) molecules are not only cell-bound, but they can also be identified in a soluble form [1]. These soluble HLA (sHLA) molecules are known to have an immunomodulatory function [2].
Stable concentrations of sHLA class I (sHLA-I) molecules circulate in all individuals. The sHLA levels in human plasma, measured using enzyme-linked immunosorbent assay (ELISA), have been reported as 1.01±0.72 mg/L for sHLA-I and 1.53±2.44 mg/L for sHLA class II (sHLA-II) [3]. Some individuals have substantially higher concentrations of sHLA-I than others, dividing the general population into high and low sHLA-I groups; HLA-A23 and HLA-A24 (A9) are associated with higher serum concentrations of sHLA-I [4].
Donor-specific HLA alloantibodies (DSAs) play an important role in graft rejection after solid organ transplantation. In cord blood or hematopoietic stem cell transplantation, the presence of DSAs is also significantly associated with engraftment failure [5, 6].
Since van Rood et al. [7] reported anti-HLA-A2 inhibitor in normal human serum using the complement-dependent cytotoxicity (CDC) assay, the presence and possible role of sHLA have been investigated in vitro in several studies, which revealed the following: 1) DSAs are inhibited by sHLA-I and sHLA-II purified from platelets and spleen lymphocytes, which was proven using both flow cytometric crossmatch (FCXM) and CDC crossmatch [8]; 2) blood components with high sHLA-I levels play immunoregulatory roles in vitro as in allogeneic mixed lymphocyte responses and antigen-specific cytotoxic T cell activity [9]; and 3) intravenous immunoglobulin (IVIG) preparations in vitro could inhibit positive CDC crossmatch [10]. However, it has not yet been demonstrated, using an FCXM method, whether natural sHLA in donor serum neutralizes DSAs in recipient serum.
In this study, we intended to demonstrate the neutralizing capacity of natural sHLA circulating in donor peripheral blood. Such demonstration would facilitate research using natural sHLA as a therapeutic desensitizing agent in donor plasma or in IVIG preparations.
Go to : 
MATERIALS AND METHODS
Donor lymphocytes and recipient sera
This study was conducted using 149 HLA crossmatches for kidney transplantation at Kyungpook National University Hospital (Daegu, Republic of Korea) (Table 1). Multiparas were selected as recipients, and previous sensitizers of the recipients (husbands, sons, or daughters) were selected as potential donors who had sensitized the recipients during their pregnancies. In this report, these donors are called “previous sensitizers,” and where donors had not been associated with the participating recipients via any previous sensitizing events, such as pregnancy, transfusion, or transplantation, they are called “non-sensitizers,” and these donors were selected as negative controls (N=6).
Table 1
Demographics of recipient/donor pairs for kidney transplantation enrolled in this study.
| Recipient/donor | Parity/relation | N | Sex (M:F) | Mean age, yr (range) | |
|---|---|---|---|---|---|
| Sensitization pairsa) | Recipients | Multipara | 143 | 0:143 | 54 (34–80) |
| Previous sensitizers | Daughter | 29 | 0:29 | 31 (16–46) | |
| Son | 39 | 39:0 | 27 (14–44) | ||
| Husband | 75 | 75:0 | 56 (33–80) | ||
| Total | 143 | 114:29 | 44 (14–80) | ||
| Non-sensitization pairs | Recipients | 6 | 2:4 | 45 (28–56) | |
| Non-sensitizer | 6 | 3:3 | 44 (34–55) | ||
![]()
Whole blood for FCXM was requested by physicians for kidney transplantation, and was collected in plain and heparin tubes from 149 pairs of recipients and their potential donors after informed consents were obtained. Negative control or third-party sera were obtained from non-transfused healthy blood group AB males. Only discarded samples remaining after conventional FCXM were obtained and used for our study. The samples were anonymized before the data were analyzed. Our study was approved by the Institutional Review Board of our hospital.
Laboratory procedures
Conventional FCXM
Preparation of donor lymphocytes: Heparin whole blood was obtained from the potential kidney donors. Density gradient centrifugation was used to separate mononuclear cells from whole blood followed by washing (×3) with Roswell Park Memorial Institute (RPMI) medium via centrifugation at 200 ×g for 6 min. Cell pellets were resuspended and treated finally with 1.0 mg/mL of pronase at 37°C for 30 min, followed by another washing step (×1).
Incubation and staining: Donor cells (∼60,000 per tube) were resuspended in 5 mL polystyrene tubes and incubated with 100 μL of recipient serum with agitation at 25°C for 30 min, followed by four washes with 3 mL of RPMI (×4). For the negative control tubes, the recipient serum was replaced with the negative control serum. Lymphocytes were stained with 20 μL (at a 1:40 dilution) of Fcγ-specific fluorescein isothiocyanate (FITC)-conjugated goat F(ab)2 anti-human IgG (Jackson Immunoresearch Laboratories, Inc., West Grove, PA, USA), 20 μL of pre-titered phycoerythrin (PE)-conjugated anti-CD19 (BD Biosciences, San Jose, CA, USA), and peridinin chlorophyll protein complex (PerCP)-conjugated anti-CD3 (BD Biosciences) in the dark at 4°C for 30 min. The cells were then washed (×1), resuspended following the addition of 50 μL of RPMI, and prepared for flow cytometry data acquisition.
Flow cytometry: A three-color flow cytometry was performed on a FACSCalibur flow cytometer with CELLQuest (version 7.5) software (all from BD Biosciences). A minimum of 5,000 B cell events were acquired per tube. Lymphocytes were gated on a forward scatter (FSC)/side scatter (SSC) plot (Fig. 1). T and B cells were gated on a CD19-PE/CD3-PerCP plot of the gated lymphocytes. The mean fluorescence intensity (MFI) value was obtained as the geometrical mean from the peak on the IgG-FITC histogram of the gated T cells or B cells. The MFI ratio for T cells or B cells was then calculated using the formula below.
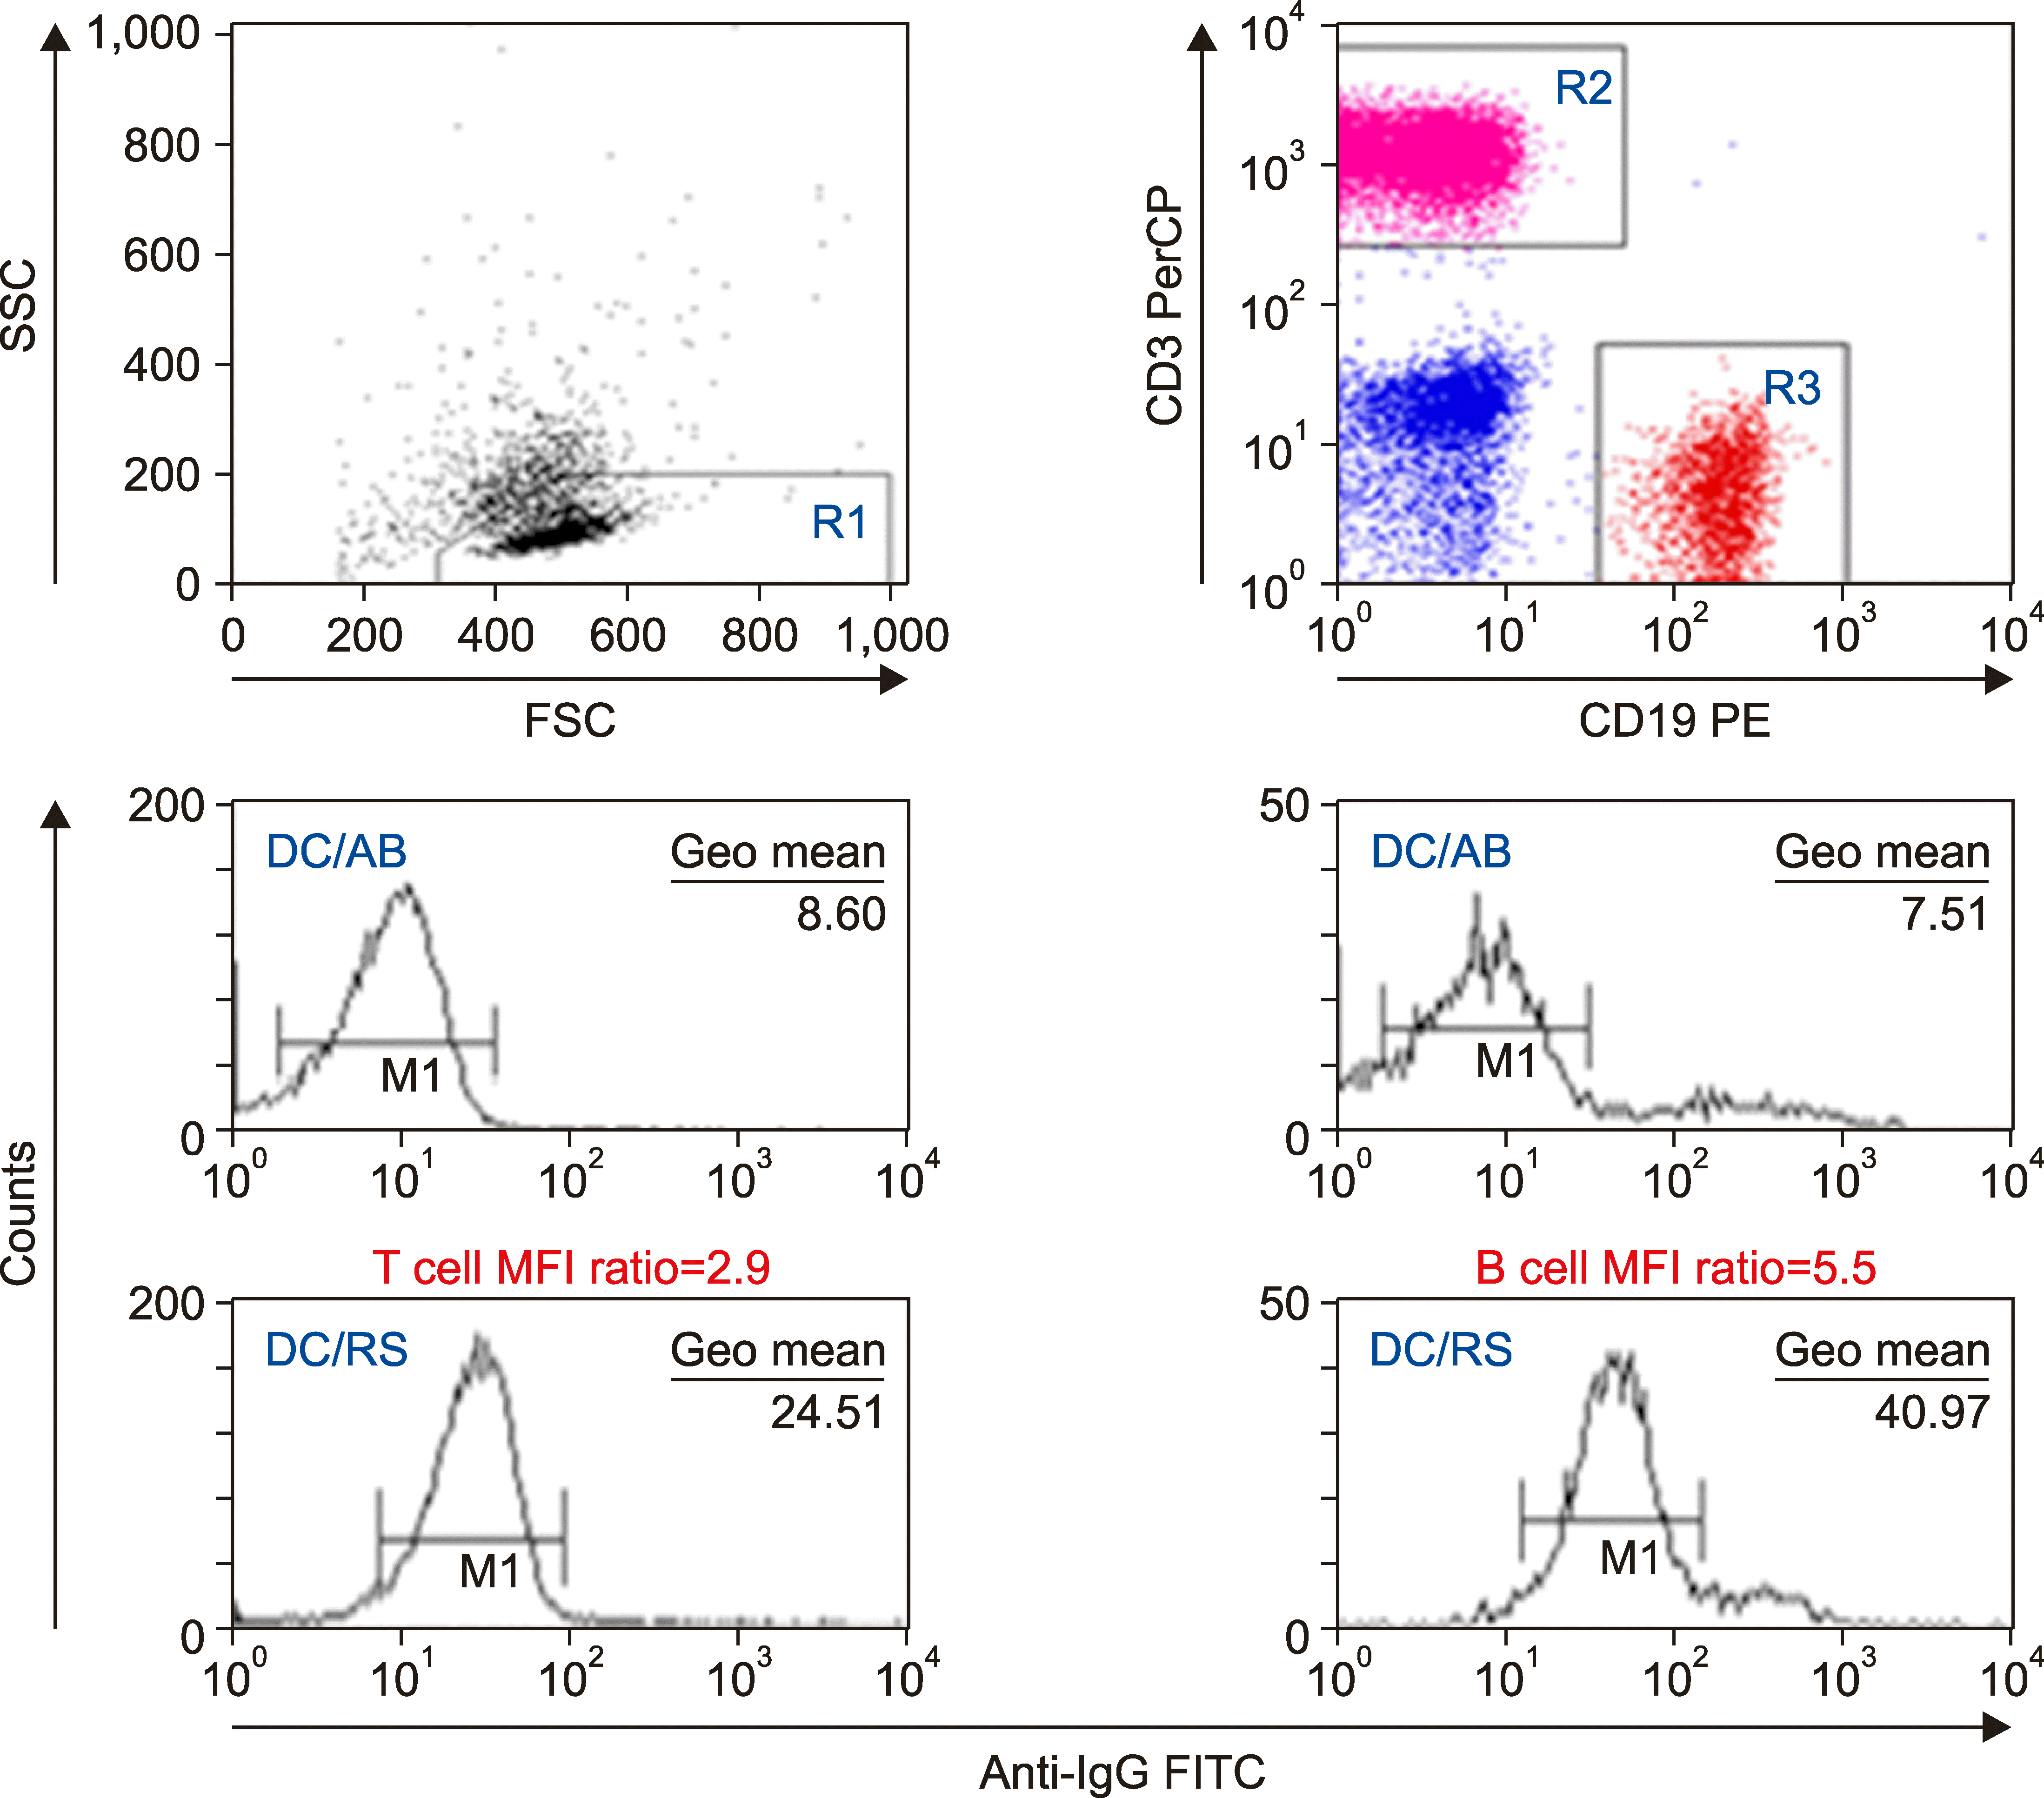 | Fig. 1Data analysis of FCXM. T cells were gated using lymphgate R1 and T cell gate R2. B cells were gated using lymphgate R1 and B cell gate R3. On the anti-IgG FITC histogram of the gated T cells or B cells, the geometric mean of the peak within the marker M1 was obtained and used to calculate the test/control MFI ratio.
Abbreviations: AB, group AB serum from healthy individuals; DC, donor cells; FITC, fluorescein isothiocyanate; FSC, forward scatter; MFI, mean fluorescence intensity; PE, phycoerythrin; PerCP, peridinin chlorophyll protein complex; RS, recipient serum; SSC, side scatter.
|
The cutoff value of this MFI ratio used to differentiate between positive and negative was 2.0 for both T and B cells.
Inhibition FCXM
Principle: The neutralizing effects of donor serum on DSAs in recipient serum were measured based on the inhibition assay principle of FCXM. Recipient serum was mixed with an equal volume of donor serum (“mixed” serum) and incubated at 25°C for 30 min to show the neutralizing effects (Fig. 2). For comparison with the mixed serum, the recipient serum was diluted with an equal volume of diluent, either RPMI or third-party serum (“diluted” serum). All the other assay procedures of the inhibition FCXM were the same as those of the conventional FCXM, with the exception of the recipient serum in the test tubes, which was replaced with mixed or diluted serum.
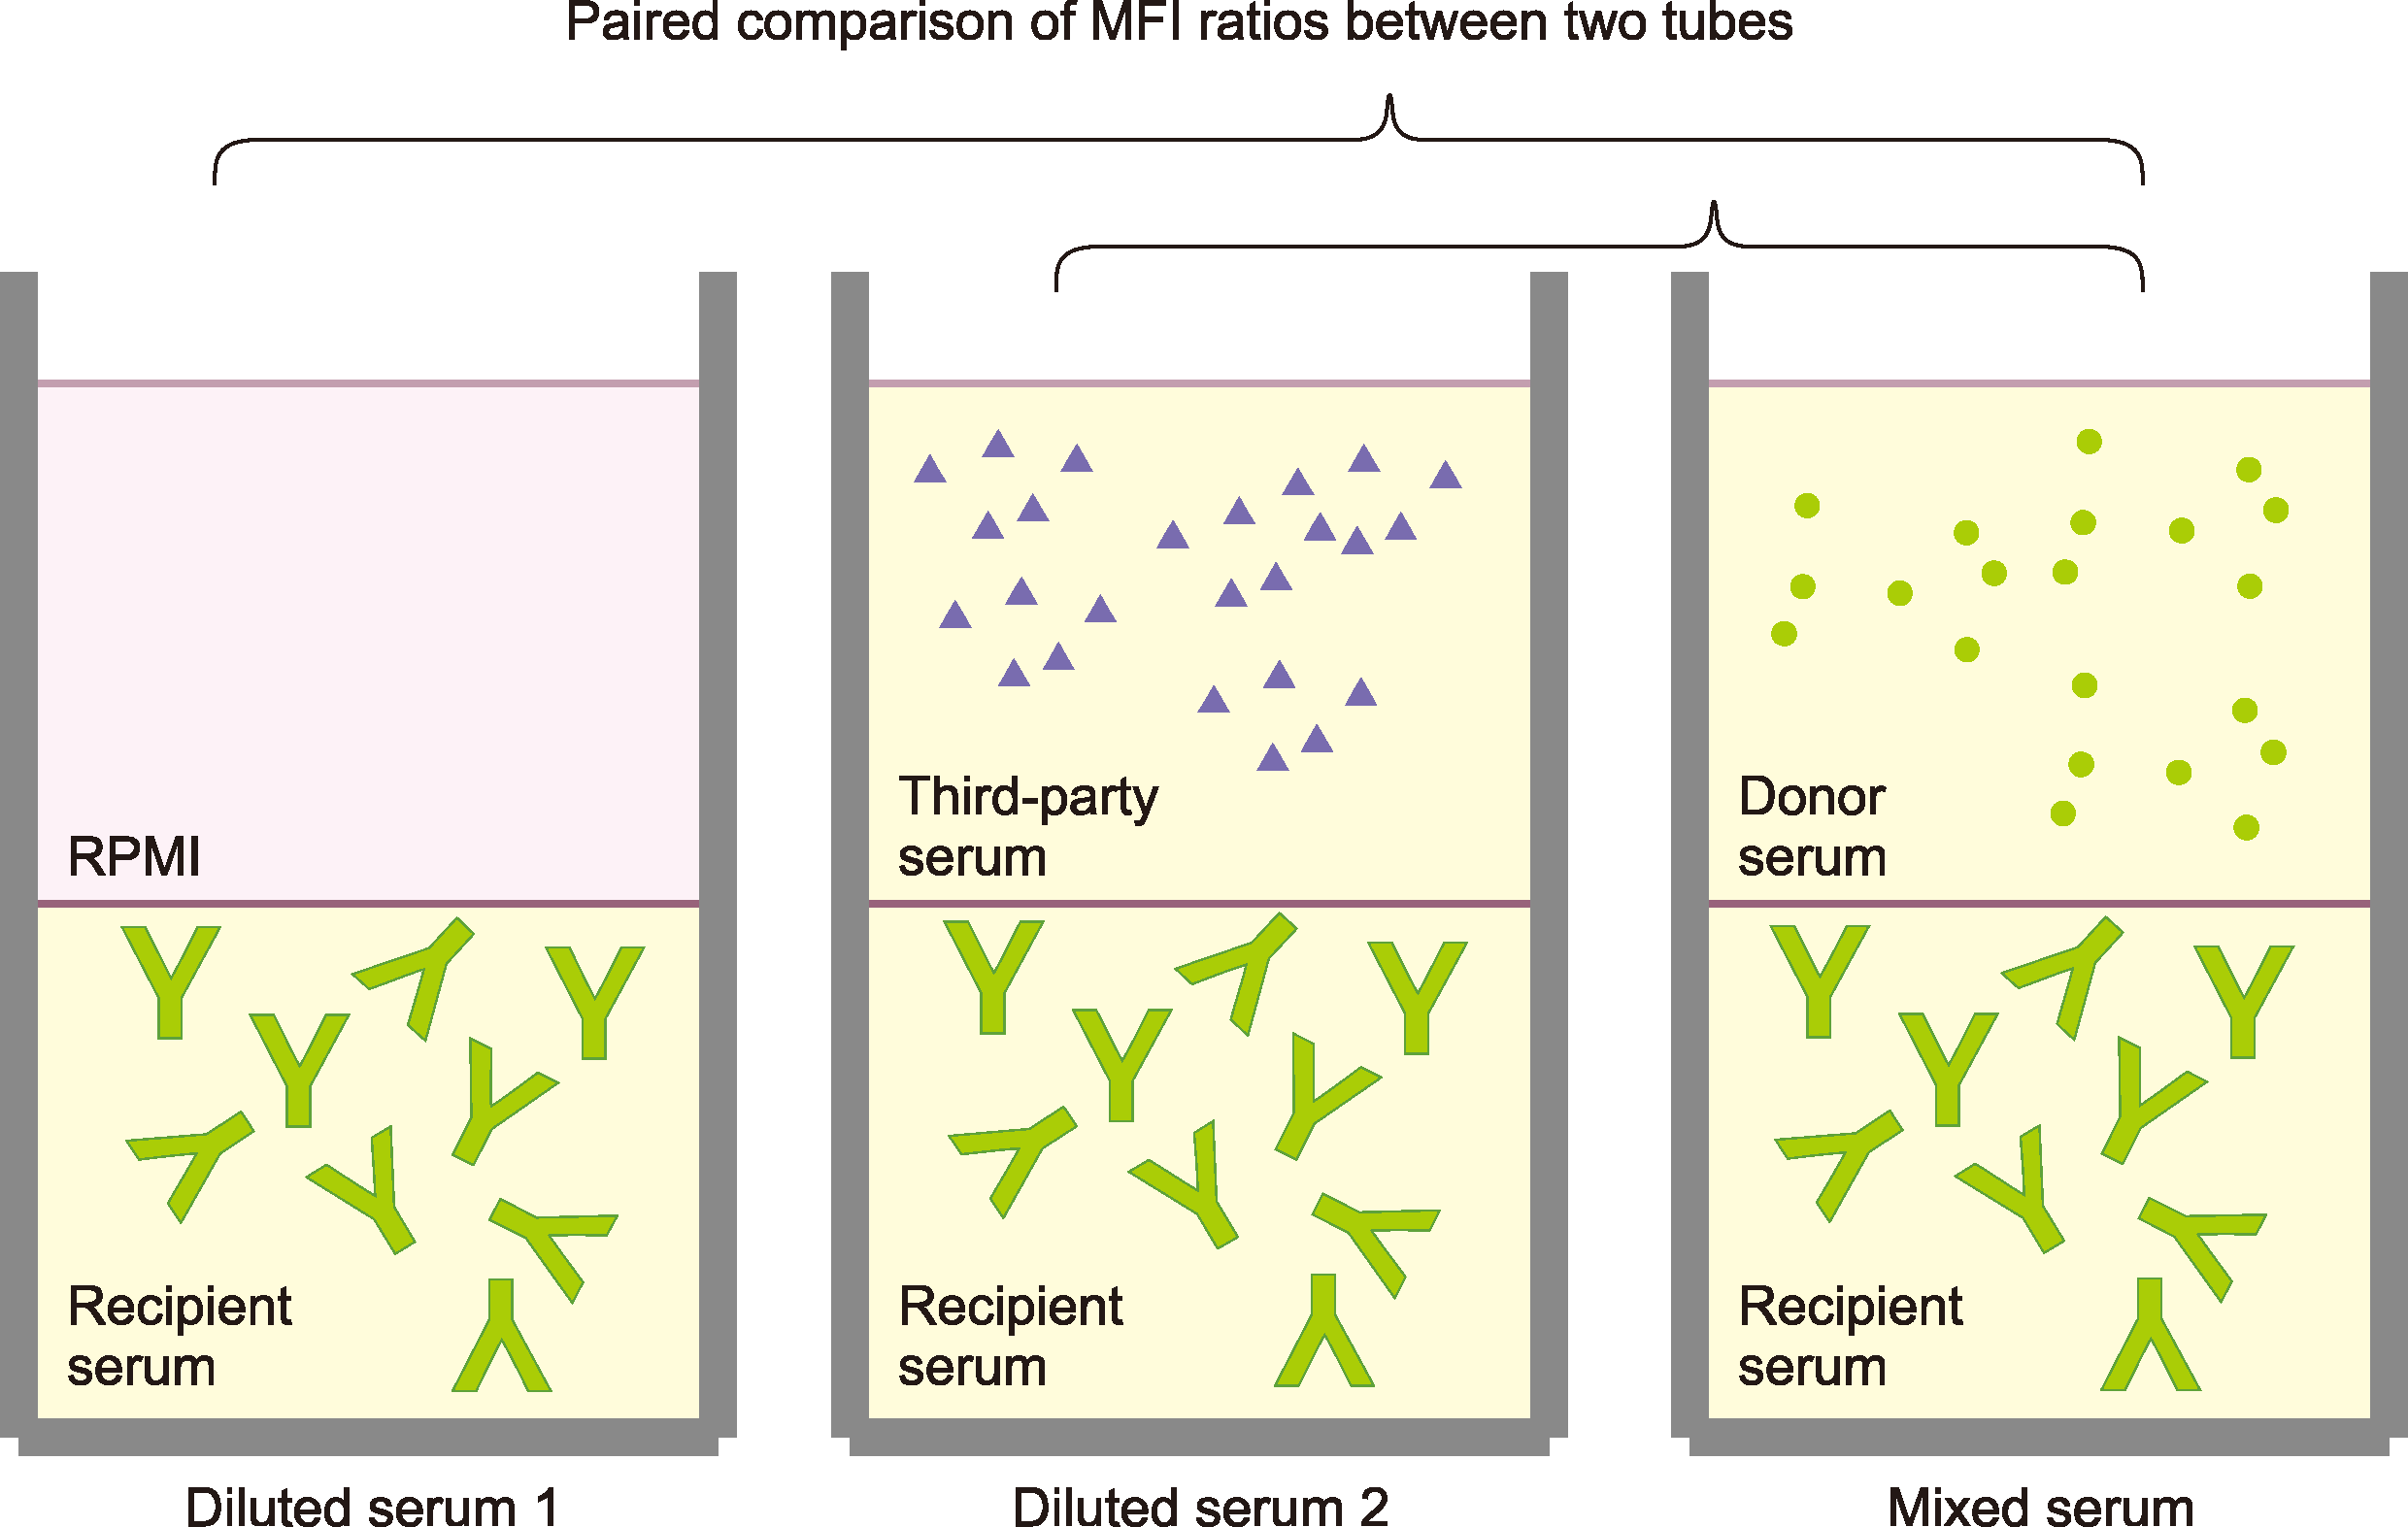 | Fig. 2Preparations of “diluted” or “mixed” serum and paired comparisons among them. Recipient serum was mixed with an equal volume of donor serum (mixed serum) and incubated at 25°C for 30 min. For comparison with mixed serum, the recipient serum was diluted with an equal volume of diluent, either RPMI or third-party serum (diluted serum). The green symbols resembling an uppercase letter Y represent antibodies, and the small round or triangular symbols represent sHLA. In the mixed serum, the sHLA (green round dots) from a donor (previous sensitizer) can neutralize donor-specific antibodies (green “Y”) in recipient serum.
|
Interpretation: T cell FCXM can detect class I DSAs only, while B cell FCXM can detect class I or class II DSAs. Matrix effects can result from decreased non-specific binding of immunoglobulins to Fc receptors on lymphocytes due to decreased immunoglobulin concentration in the diluted serum. Third-party serum is able to exert neutralizing effects when the serum incidentally has the sHLA that is targeted by the recipient DSAs.
The MFI ratios of the mixed sera (recipient+donor) were compared to those of the diluted sera (with either RPMI or third-party serum) (Fig. 3). Lower MFI ratios of the mixed sera relative to the diluted sera suggest that the neutralizing effects of the sHLA were superior to the matrix effects. In addition, lower MFI ratios of the diluted sera relative to the mixed sera suggest that the matrix effects were superior to the neutralizing effects.
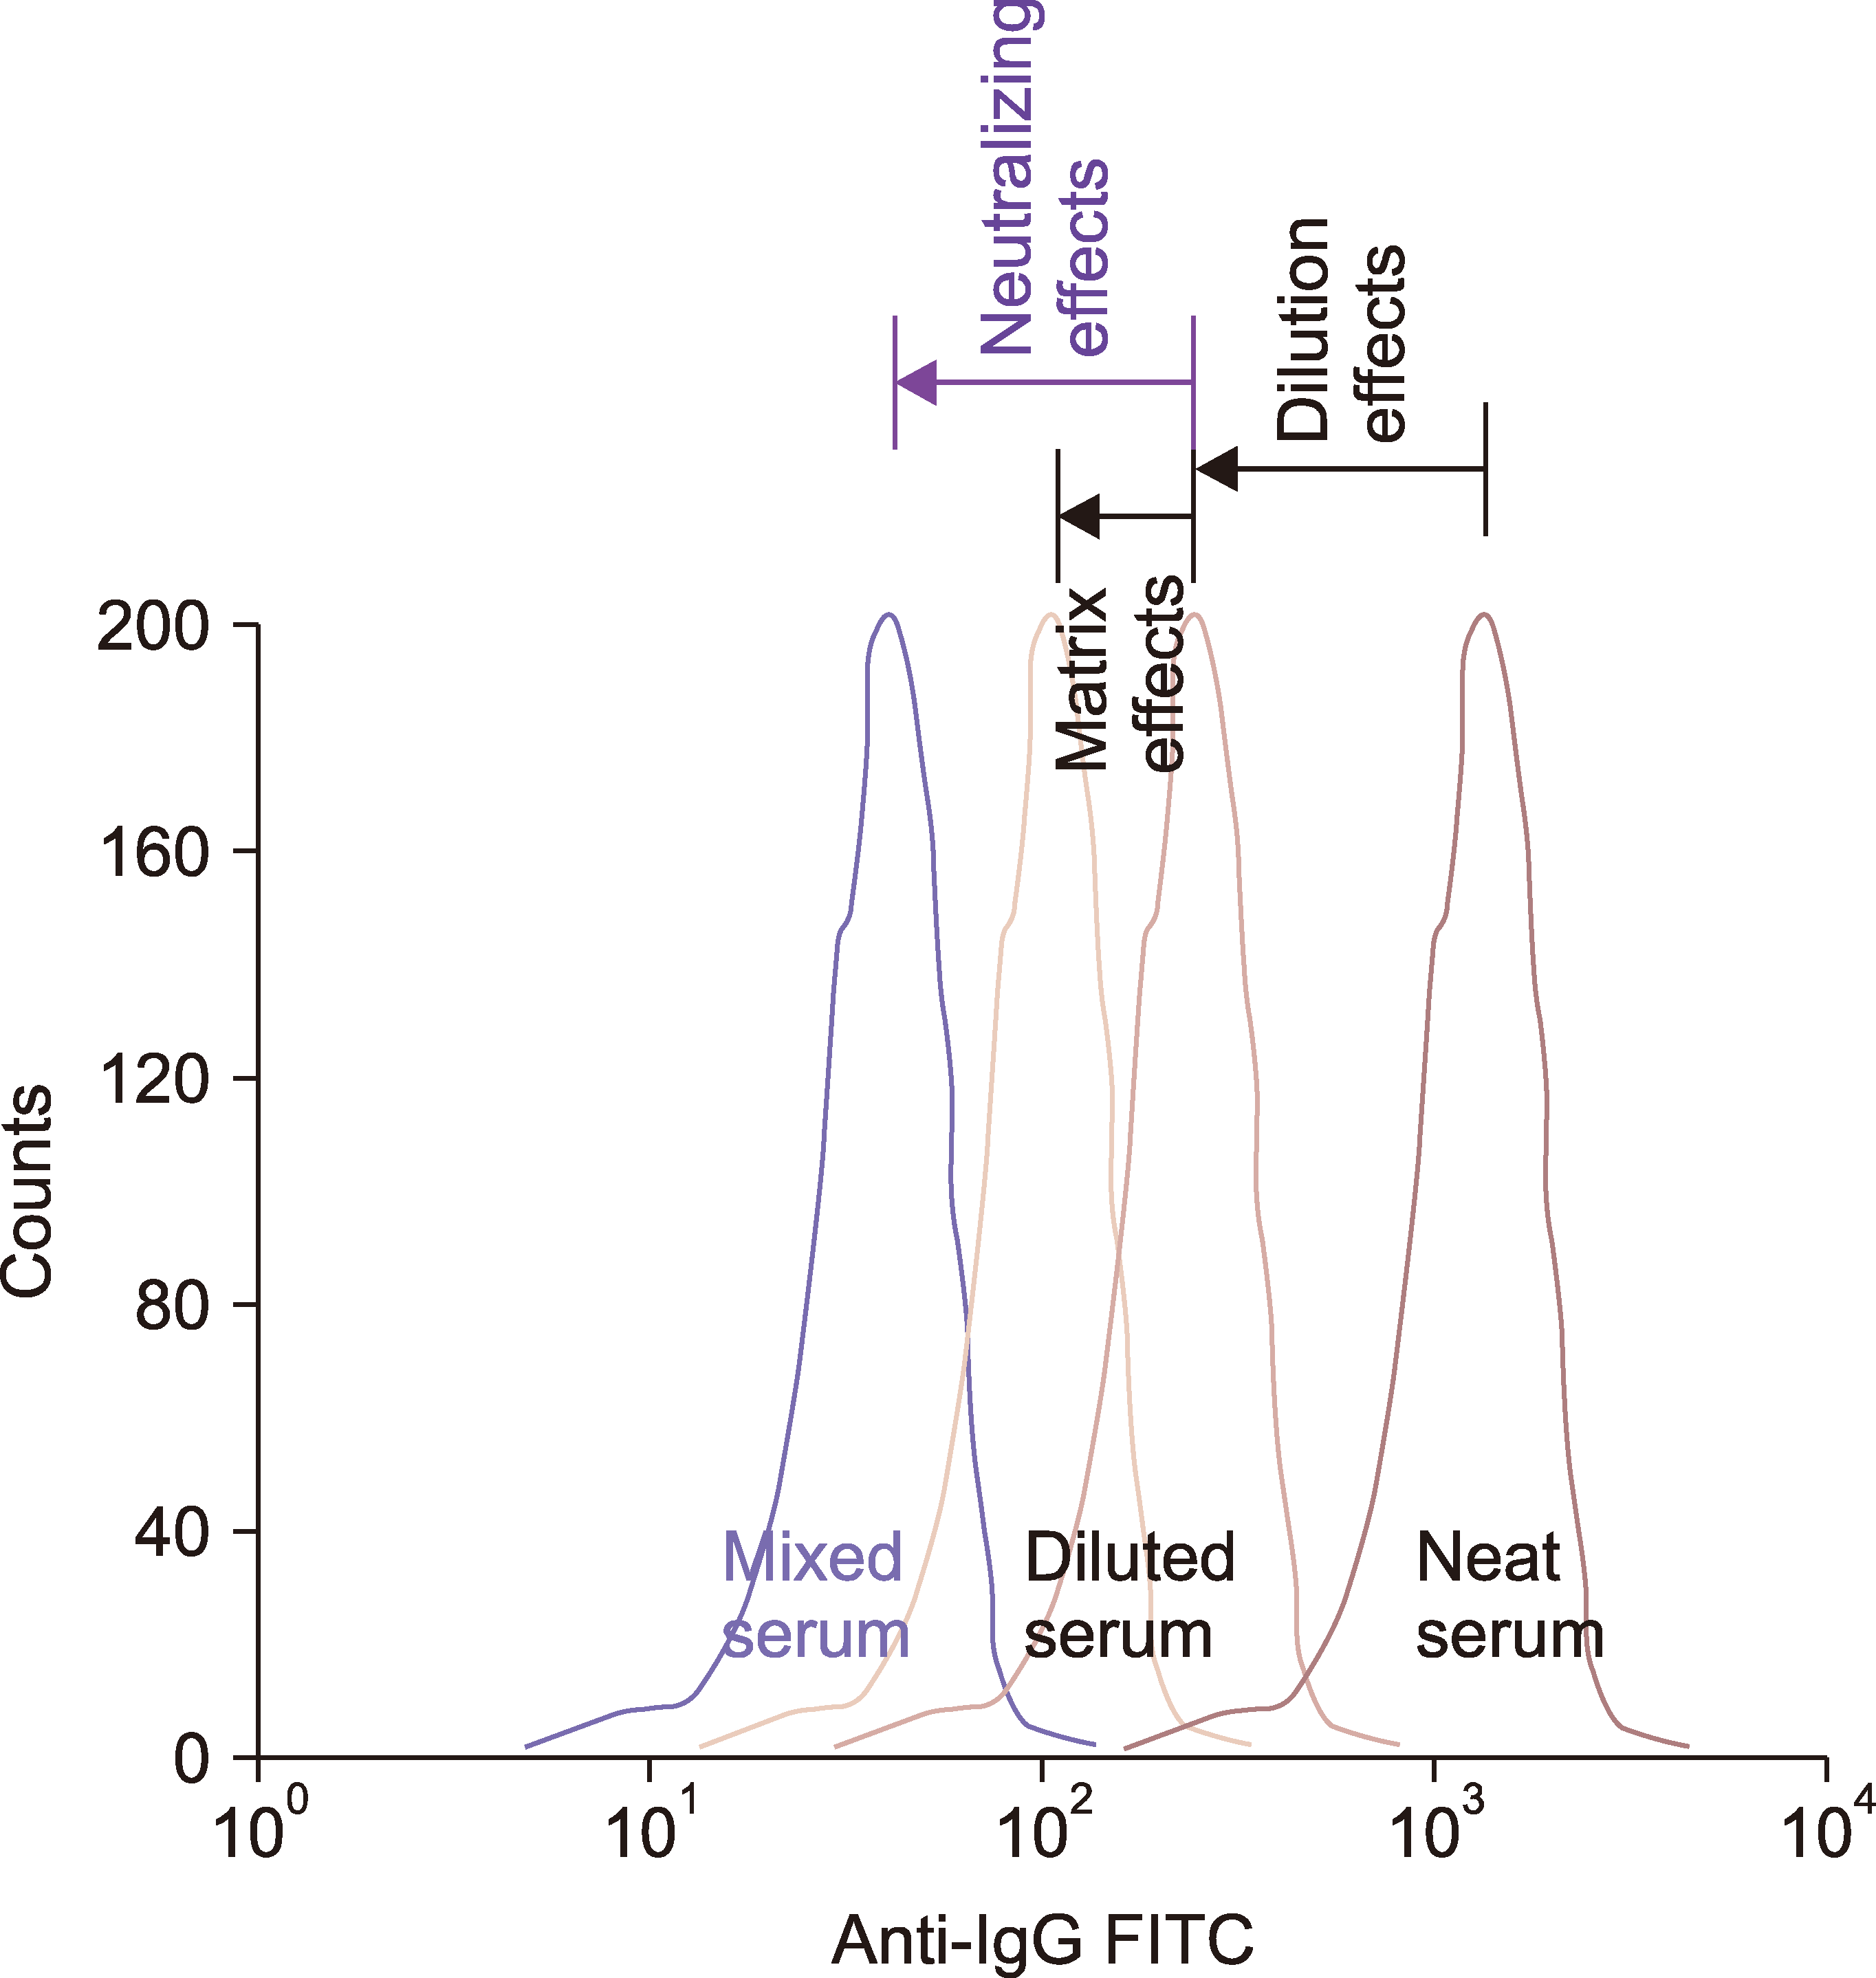 | Fig. 3Representative diagram of neutralizing effects superior to matrix effects on the anti-IgG histogram of gated T cells in FCXM. T cell peaks are shown for mixed serum (donor+recipient), diluted serum (with either RPMI or third-party group AB serum), and neat serum. The peak for the neat serum in conventional FCXM appears in the right-most position, reflecting its original DSA level. In the diluted serum, the dilution and matrix effects are owing to the decreased DSA and immunoglobulin concentrations, respectively. Neutralizing effects in the mixed serum are evident only when they surpass the matrix effects in the corresponding diluted serum (MFI, diluted>mixed). In contrast, when there are no neutralizing effects, only matrix effects are apparent (MFI, mixed>diluted).
Abbreviations: DSA, donor-specific HLA alloantibody; FITC, fluorescein isothiocyanate; MFI, mean fluorescence intensity; sHLA, soluble human leukocyte antigen.
|
Statistical analysis
Statistical analyses were performed using SPSS Statistics, version 23 (IBM Corp., Armonk, NY, USA). Comparisons between the two groups were performed using the Wilcoxon signed-rank test. Statistical significance was defined as a P-value <0.05. Results are expressed as mean±standard deviation and median (range) of the data.
Go to :
RESULTS
Conventional FCXM
In the conventional FCXM between multiparous recipients and previous sensitizers, the positivity rate was 51.7% (74/143) (Table 2). The criteria used to differentiate DSAs between class I and class II are also summarized in Table 2.
Table 2
Conventional FCXM results with neat sera from multiparous recipients against T cells or B cells from previous sensitizers, and criteria to differentiate the DSAs between class I and class II.
![]()
Neutralizing effects of donor serum
We initially considered the dilution effects of the recipient sera with RPMI (Fig. 4). The majority of the MFI ratios of the diluted sera in the inhibition FCXM were lower than those of the neat sera in the conventional FCXM. Generally, MFI values linearly reflected the DSA levels in recipient sera. When the MFI ratios of neat sera were more than 10 or less than 2, the dilution effects were not apparent. This may be because the relationship between the MFI ratio and the corresponding DSA level is not linear within these ranges.
 | Fig. 4Dilution effects on inhibition FCXM with RPMI as the diluent. In principle, the MFI ratio of a serum diluted with RPMI should be less than that of the neat serum with DSAs, and thus be plotted under the diagonal line, y=x. Most MFI ratios of diluted sera in the inhibition FCXM were lower than those of neat sera in the conventional FCXM. The higher values might be due to the prozone phenomenon (excess antibody).
Abbreviations: DSA, donor-specific HLA alloantibody; FCXM, flow cytometric crossmatch; MFI, mean fluorescence intensity.
|
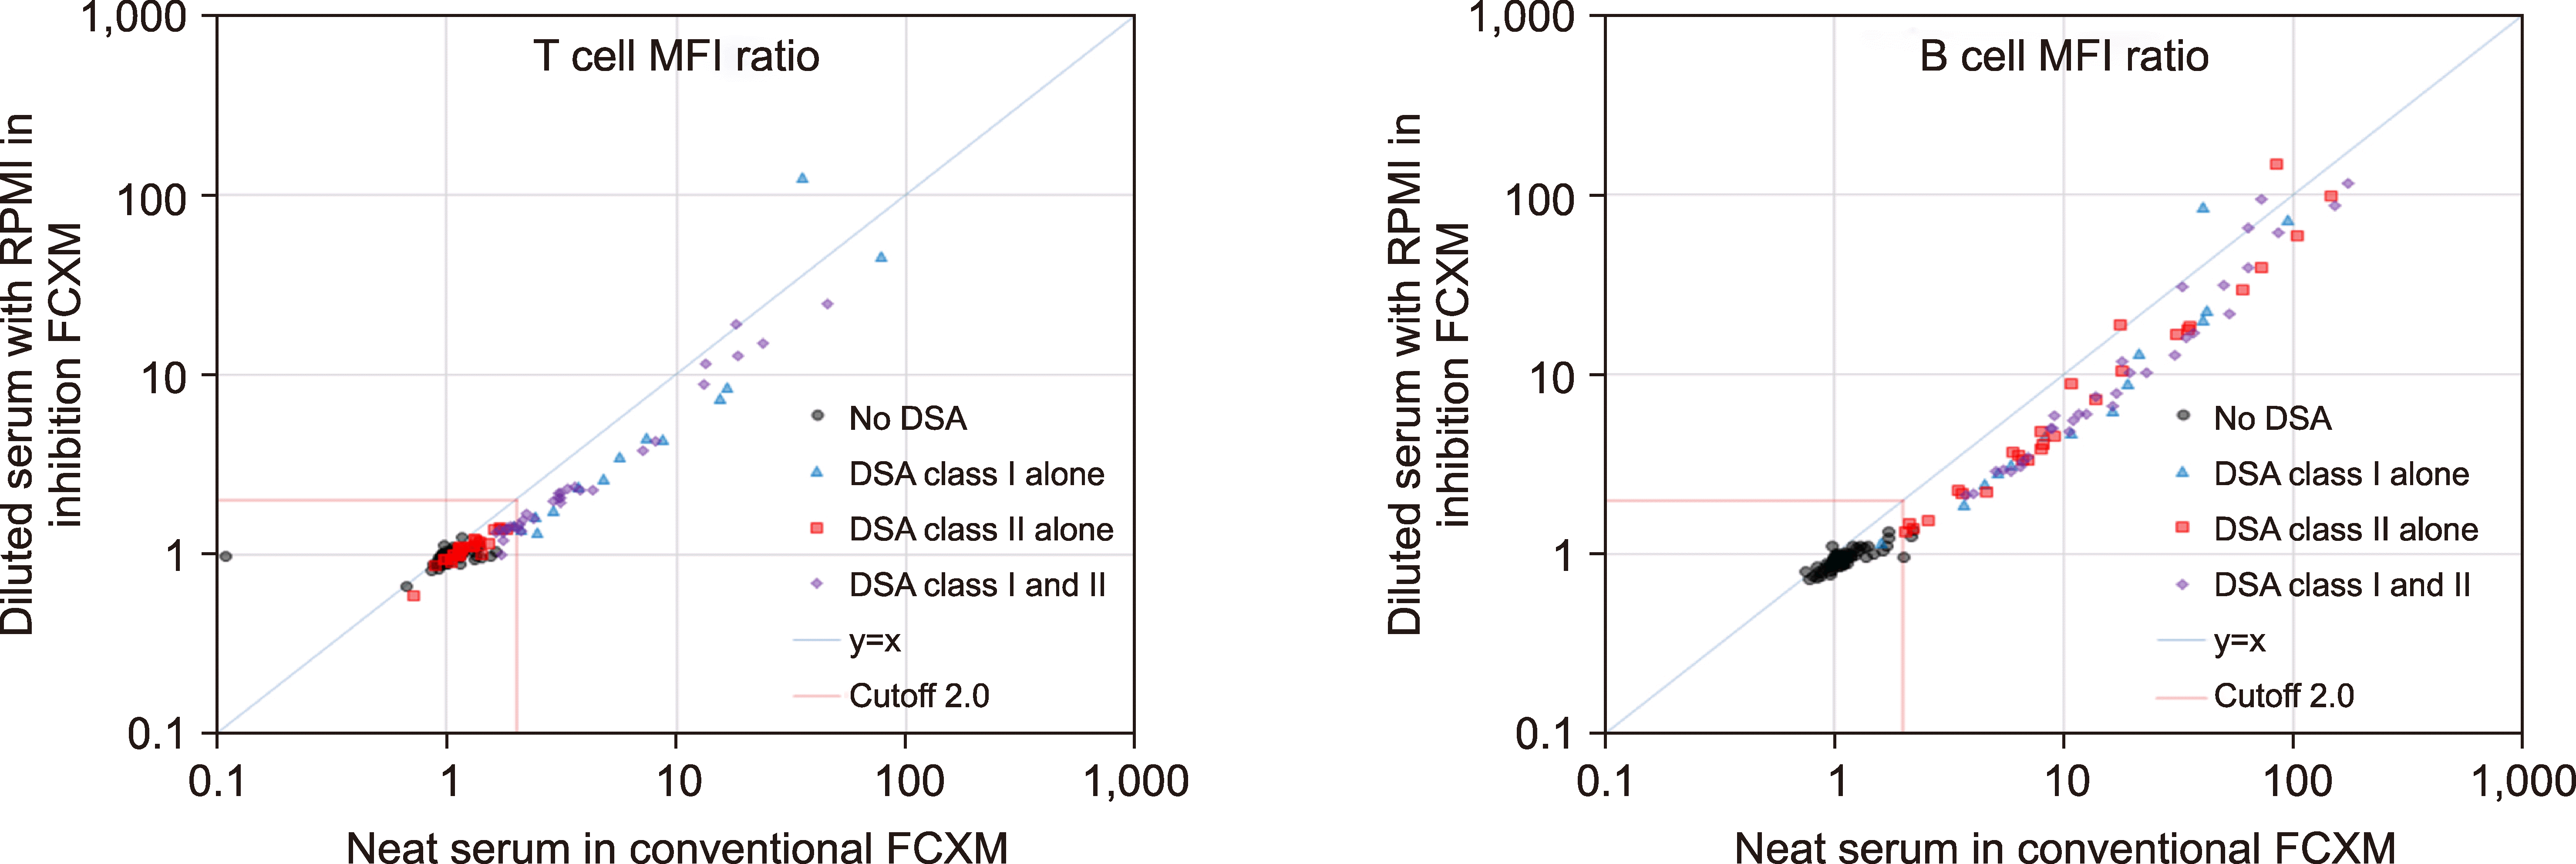
To avoid confusion caused by dilution effects, the mixed sera (recipient+donor) were compared only to the diluted sera (with RPMI or third-party serum). The inhibition FCXM experiments for verifying the neutralizing effects of a previous sensitizer’s serum are summarized in Fig. 5 and Table 3.
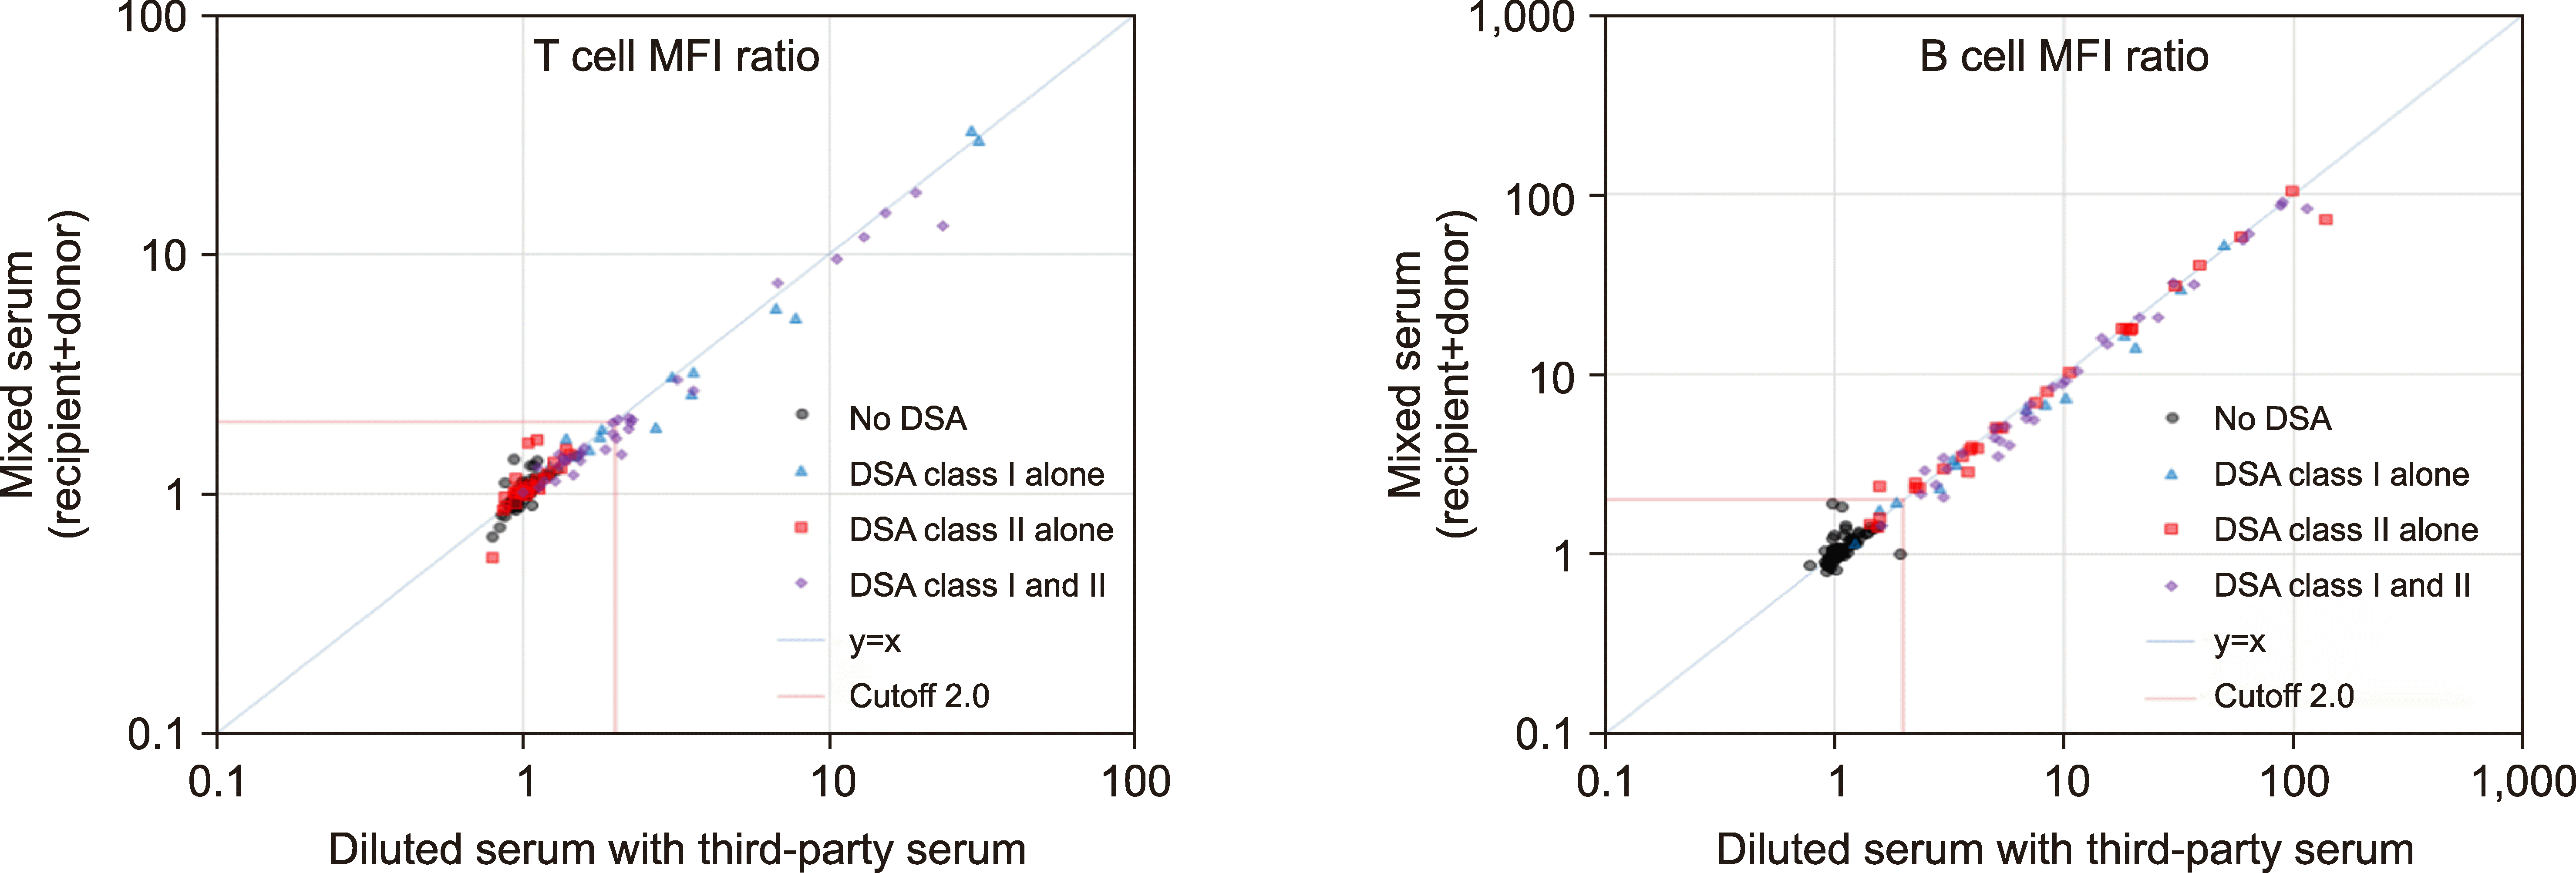 | Fig. 5The neutralizing effects of donor sera compared to third-party sera as diluents in inhibition FCXM. When the neutralizing effects of the sera of previous sensitizers are evident, their MFI ratios should be less than those generated by the sera diluted with third-party sera and thus should be plotted under the diagonal line, y=x. In the group with both class I and class II DSAs (N=33), neutralizing effects were evident in both T cell and B cell FCXM. In the group with any positive DSAs (class I or class II DSAs, N=74), neutralizing effects were evident in the B cell FCXM only.
Abbreviations: DSA, donor-specific HLA alloantibody; FCXM, flow cytometric crossmatch; MFI, mean fluorescence intensity.
|
Table 3
Comparison of MFI ratios between mixed serum and diluted serum in inhibition FCXM, Wilcoxon signed-rank test.
| Donor | N |
T cell MFI ratio, mean±SD, median (range) |
B cell MFI ratio, mean±SD, median (range) |
||||||
|---|---|---|---|---|---|---|---|---|---|
|
|
|
||||||||
| Inhibition FCXM |
Conventional FCXM (neat recipient serum) |
Inhibition FCXM |
Conventional FCXM (neat recipient serum) |
||||||
|
|
|
||||||||
| Recipient serum diluted with |
Mixed serum (recipient+donor) |
Recipient serum diluted with |
Mixed serum (recipient+donor) |
||||||
|
|
|
||||||||
| RPMI | Third-party serum | RPMI | Third-party serum | ||||||
| Previous sensitizer | |||||||||
| Negative DSA | 69 | 0.97±0.09 | 1.01±0.11 | 1.03±0.15 | 1.05±0.20 | 0.96±0.13 | 1.09±0.18 | 1.10±0.21 | 1.14±0.30 |
|
0.98▼a) (0.66–1.25) |
1.00 (0.79–1.50) |
1.03 (0.67–1.44) |
1.00 (0.11–1.63) |
0.95▼ (0.73–1.37) |
1.04 (0.79–1.95) |
1.06 (0.81–1.93) |
1.05 (0.75–2.20) |
||
| P<0.00005 | P=0.0894 | P<0.0000001 | P=0.5757 | ||||||
| DSA class I alone | 14 | 15.13±33.76 | 6.93b)±10.01 | 6.74±10.50 | 13.38±20.58 | 17.84±26.92 | 11.74±14.01 | 10.87±14.26 | 22.38±25.20 |
|
3.04▲ (1.33–125.39) |
2.88 (1.23–30.81) |
2.25 (1.31–32.51) |
5.28 (1.95–77.68) |
5.48▼ (1.16–85.62) |
6.00 (1.23–49.33) |
5.76 (1.16–52.46) |
13.54 (1.61–94.26) |
||
| P<0.01 | P=0.1671 | P<0.05 | P=0.0962 | ||||||
| DSA class II alone | 27 | 1.07±0.18 | 1.07±0.17 | 1.14±0.25 | 1.24±0.27 | 18.99±33.19 | 18.94±32.01 | 16.56±24.90 | 26.10±36.15 |
|
1.07 (0.59–1.39) |
1.04▼ (0.79–1.42) |
1.06 (0.54–1.67) |
1.16 (0.71–1.83) |
4.50 (1.34–145.98) |
5.08 (1.44–138.47) |
5.03 (1.41–103.53) |
8.14 (2.06–144.92) |
||
| P=0.0652 | P<0.05 | P=0.5561 | P=0.2276 | ||||||
|
Both DSA classes (class I and II) |
33 | 4.32±5.78 | 4.13±5.61 | 3.60±4.53 | 6.38±9.06 | 21.40±29.51 | 20.57±28.98 | 18.88±26.14 | 32.39±40.12 |
|
1.97▲ (0.99–24.77) |
1.96▲ (1.00–23.41) |
1.55 (1.01–18.10) |
3.09 (1.65–45.78) |
7.49▲ (2.15–114.56) |
7.16▲ (1.60–114.28) |
6.19 (1.46–91.02) |
16.19 (3.74–173.15) |
||
| P<0.00001 | P<0.0005 | P<0.0005 | P<0.005 | ||||||
|
Any DSA (class I or II) |
74 | 5.18±15.60 | 3.54±6.02 | 3.30±5.72 | 5.83±11.42 | 19.85±30.09 | 18.30±27.91 | 16.52±23.78 | 28.20±36.06 |
|
1.40▼ (0.59–125.39) |
1.40▲ (0.79–30.81) |
1.46 (0.54–32.51) |
1.99 (0.71–77.68) |
6.17▲ (1.16–145.98) |
6.80▲ (1.23–138.47) |
5.60 (1.16–103.53) |
12.09 (1.61–173.15) |
||
| P<0.0001 | P<0.05 | P<0.0005 | P<0.0005 | ||||||
| Total | 143 | 3.15±11.38 | 2.32±4.50 | 2.20±4.26 | 3.52±8.53 | 10.73±23.56 | 10.00±21.79 | 9.08±18.72 | 15.24±29.55 |
|
1.04 (0.59–125.39) |
1.06 (0.79–30.81) |
1.11 (0.54–32.51) |
1.18 (0.11–77.68) |
1.40 (0.73–145.98) |
1.56▼ (0.79–138.47) |
1.60 (0.81–103.53) |
2.11 (0.10–173.15) |
||
| P=0.4435 | P=0.2897 | P=0.5126 | P<0.001 | ||||||
| Non-sensitizer | 6 | 1.00±0.13 | 1.05±0.08 | 1.03±0.13 | 1.14±0.25 | 1.62±0.78 | 1.79±0.75 | 1.71±0.78 | 1.14±0.19 |
|
0.99 (0.84–1.18) |
1.03 (0.97–1.18) |
1.00 (0.90–1.18) |
1.01 (0.95–1.59) |
1.68 (0.64–2.91) |
1.72 (1.04–3.17) |
1.65 (0.92–3.12) |
1.13 (0.83–1.42) |
||
| P=0.1441 | P=0.2785 | P=0.2476 | P=0.1411 | ||||||
a)The symbols ▼and ▲indicate a significantly decreased or increased median value, respectively, when the MFI ratios of diluted sera were compared to those of mixed sera. b)Bold fonts indicate the most efficient comparisons between the diluted serum and the mixed serum to reveal neutralization effects with minimal matrix effects.
![]()
1. Negative FCXM with non-sensitizers or previous sensitizers as donors: The sera of non-sensitizers (N=6) did not show any neutralizing effects. In negative FCXM, even with previous sensitizers as donors (N=69), matrix effects of RPMI were apparent in both T cell and B cell FCXM.
2. Matrix effects in any positive FCXM (T cell or B cell) with previous sensitizers as donors (N=74): Matrix effects of RPMI were evident in the B cell FCXM with class I DSAs alone (N=14), and in the T cell FCXM with any positive DSA (class I or class II, N=74). Matrix effects of third-party sera were shown in the T cell FCXM with class II DSAs alone (N=27), in the T cell FCXM with any positive DSA (class I or class II, N=74), and in the B cell FCXM for total previous sensitizers (N=143).
3. Neutralizing effects in any positive FCXM (T cell or B cell) with previous sensitizers as donors (N=74): In the group with class I DSAs alone (N=14), neutralizing effects were evident in the T cell FCXM compared to the sera diluted with RPMI. In the group with class II DSAs alone (N=27), no neutralizing effects were seen in the B cell FCXM. In the group with both class I and class II DSAs (N=33), neutralizing effects were apparent in both FCXMs (T cell and B cell) regardless of diluents (RPMI or third-party serum). In the group with any positive DSA (class I or class II DSAs, N=74), neutralizing effects were evident in the B cell FCXM only, regardless of the diluent (RPMI or third-party serum). Overall, the neutralizing effects of sHLA in the serum of a previous sensitizer on DSAs in a recipient serum were confirmed for sHLA-I but not for sHLA-II.
Go to :
DISCUSSION
In this study, natural sHLA in donor serum was demonstrated to neutralize DSAs in recipient serum. In particular, the neutralizing effects were verified for sHLA-I but not for sHLA-II, although it has been reported that both sHLA-I and sHLA-II can be measured using ELISA [3]. However, our finding is consistent with the previous observation that plasma exchange with IVIG can eliminate class I DSAs more easily than class II DSAs [11]. To the best of our knowledge, this is the first report where FCXM has been used to demonstrate the neutralizing effects of sHLA. These potentially beneficial effects of sHLA infused via blood-derived products should be considered for desensitization of highly HLA-sensitized patients.
We considered that the most efficient way of revealing neutralization effects of sHLA would be by comparing the diluted serum with third-party serum (inducing minimal matrix effects) and the mixed serum. Thus, attention was given to the following five FCXM measurement conditions in the current study: 1, 2) T cell and B cell FCXM for sera with DSA class I alone; 3) B cell FCXM for sera with DSA class II alone; and 4, 5) T cell and B cell FCXM for sera with DSA of both classes. As expected, both the mean and median values of MFI ratios for the mixed sera were always lower than those for the corresponding diluted sera (Table 3, bold fonts) in all five cases; two cases showed statistically significant differences.
An MFI ratio in FCXM reflects the DSA level in the recipient serum, and this is more accurate in T cells than in B cells [12]. Class II DSAs can be detected in B cell FCXM only. This may explain why neutralizing effects could not be demonstrated for sHLA-II in our study. In other words, we failed to measure and show the effects of sHLA-II in B cell FCXM, whereas sHLA-II should be present at any level in donor serum, and thus neutralize class II DSAs in recipient serum.
In our study, diluent matrix effects were seen with third-party serum as well as RPMI. This may be because we used third-party sera of blood group AB that had low total IgG levels. Indeed, individuals with blood group AB have been reported to often have relatively low total IgG levels [13].
For histocompatibility antigen-mismatched skin grafts in rats, pretransplant infusion of donor serum has been shown to significantly prolong graft survival [14]. In human liver transplantation, some studies have suggested that tolerance may be associated with the formation of immune complexes involving sHLA-I shed from the transplanted liver [1]. The donor sHLA in liver transplant recipients may be capable of removing the alloreactive T cells from circulation [15], since sHLA-I is capable of inhibiting all core active CD8+ T cells [16]. Liver-kidney transplant recipients with high concentrations of soluble HLA-G in their sera have been reported to have low numbers of acute rejection episodes, potentially requiring less immunosuppressive therapy [17]. In blood transfusions, sHLA-I could contribute to the immunosuppressive effects [18].
Fortunately, HLA molecules per se are very poor immunogens, unless they are presented on live lymphocytes [19]. If the T cell receptor or CD4/CD8 of a given T cell is simply blocked or engaged without receiving the second signal (co-stimulation) to become fully activated, the T cell leads to cell apoptosis and sHLA-II promotes suppressive activity in CD4+ T cells [20, 21]. Good evidence is being found using the desensitization protocol (plasma exchange with IVIG) for ABO-incompatible organ transplantation. When fresh frozen plasma (FFP) of group AB is used as a replacement fluid in ongoing immunosuppressive drug therapy, soluble ABH substance in the FFP can neutralize recipient ABO antibodies without evoking de novo formation of ABO antibodies in recipients [22]. Therefore, sHLA in donor plasma is also expected to be an effective desensitizing agent rather than a potent immunogen.
Pretransplant donor-specific transfusion (DST) has either a beneficial effect of improving graft survival or a detrimental effect of inducing sensitization [23]. The exact mechanism by which DST induces the beneficial effect has remained a mystery [24]. One possibility is that pre-exposure to alloantigen results in the induction of regulatory cells with the capacity to control the effector arm of the immune response [25]. Alternatively, as deduced from our study, sHLA in donor plasma may have the capacity to neutralize DSAs and eliminate alloreactive T cells. Therefore, pretransplant or posttransplant infusion of donor plasma, from which cellular components have been completely removed, might be an efficient approach to antigen-specific immunomodulatory therapy under concomitant administration of immunosuppressive drugs.
IVIG preparations block cytotoxic DSAs in vitro and allow for the successful transplantation of incompatible organs in vivo. Explanations for these effects are as follows: 1) sHLA in IVIG, 2) anti-idiotypic antibodies in IVIG, or 3) complement inhibitory capacity of IVIG [10, 26]. Our study used sera obtained from healthy donors without HLA alloantibodies, and prefers sHLA in IVIG as a neutralizing agent.
As sHLA-I are detectable in blood components [18], both sHLA-I and sHLA-II are also detectable in blood-derived products, such as IVIG, factor VIII, albumin, and prothrombin complex concentrate. However, the sHLA-I and sHLA-II concentrations in these products are unequivocally below the mean sHLA concentrations in human plasma [3]. For example, the concentration of sHLA in albumin and IVIG is more than 50-fold lower than that in normal human serum, but considerable differences exist between products of different manufacturers [19, 27]. Therefore, if given in a sufficient volume, these preparations may trigger immunomodulatory activities [3, 27, 28].
In a previous report, sHLA-II concentration in IVIG preparations exceeded that found in the plasma of healthy humans, suggesting that the extraction procedure may concentrate not only immunoglobulins but also sHLA-II molecules [28]. Therefore, the process of manufacturing IVIG preparations from pooled human plasma should be improved to maintain or concentrate sHLA molecules in IVIG to enhance their therapeutic efficacy for desensitization protocols.
Maternal formation of anti‐HLA alloantibodies to paternal HLAs is estimated to occur in 7–39% of pregnant women [29]. In our study, the positivity rate of multipara FCXM with previous sensitizers was 51.7%. Currently, neither FFP nor platelet concentrates from multiparous donors, which are associated with a high risk of inducing transfusion-related acute lung injury, are transfused anymore. To avoid the neutralization of sHLA by these maternal antibodies, we suggest that plasma from males or from non-multiparous non-sensitized females should be pooled to prepare IVIG as a desensitizing agent.
In conclusion, our study, using inhibition FCXM, demonstrated that natural sHLA-I in donor serum neutralizes DSAs in recipient serum. To use sHLA as an antigen-specific immunomodulatory or desensitizing agent, further clinical trials of pretransplant or posttransplant donor plasma infusion are required, along with further research to enhance sHLA concentrations in IVIG manufactured from pooled human plasma.
Go to :
 XML Download