INTRODUCTION
MATERIALS AND METHODS
Subjects
Methods
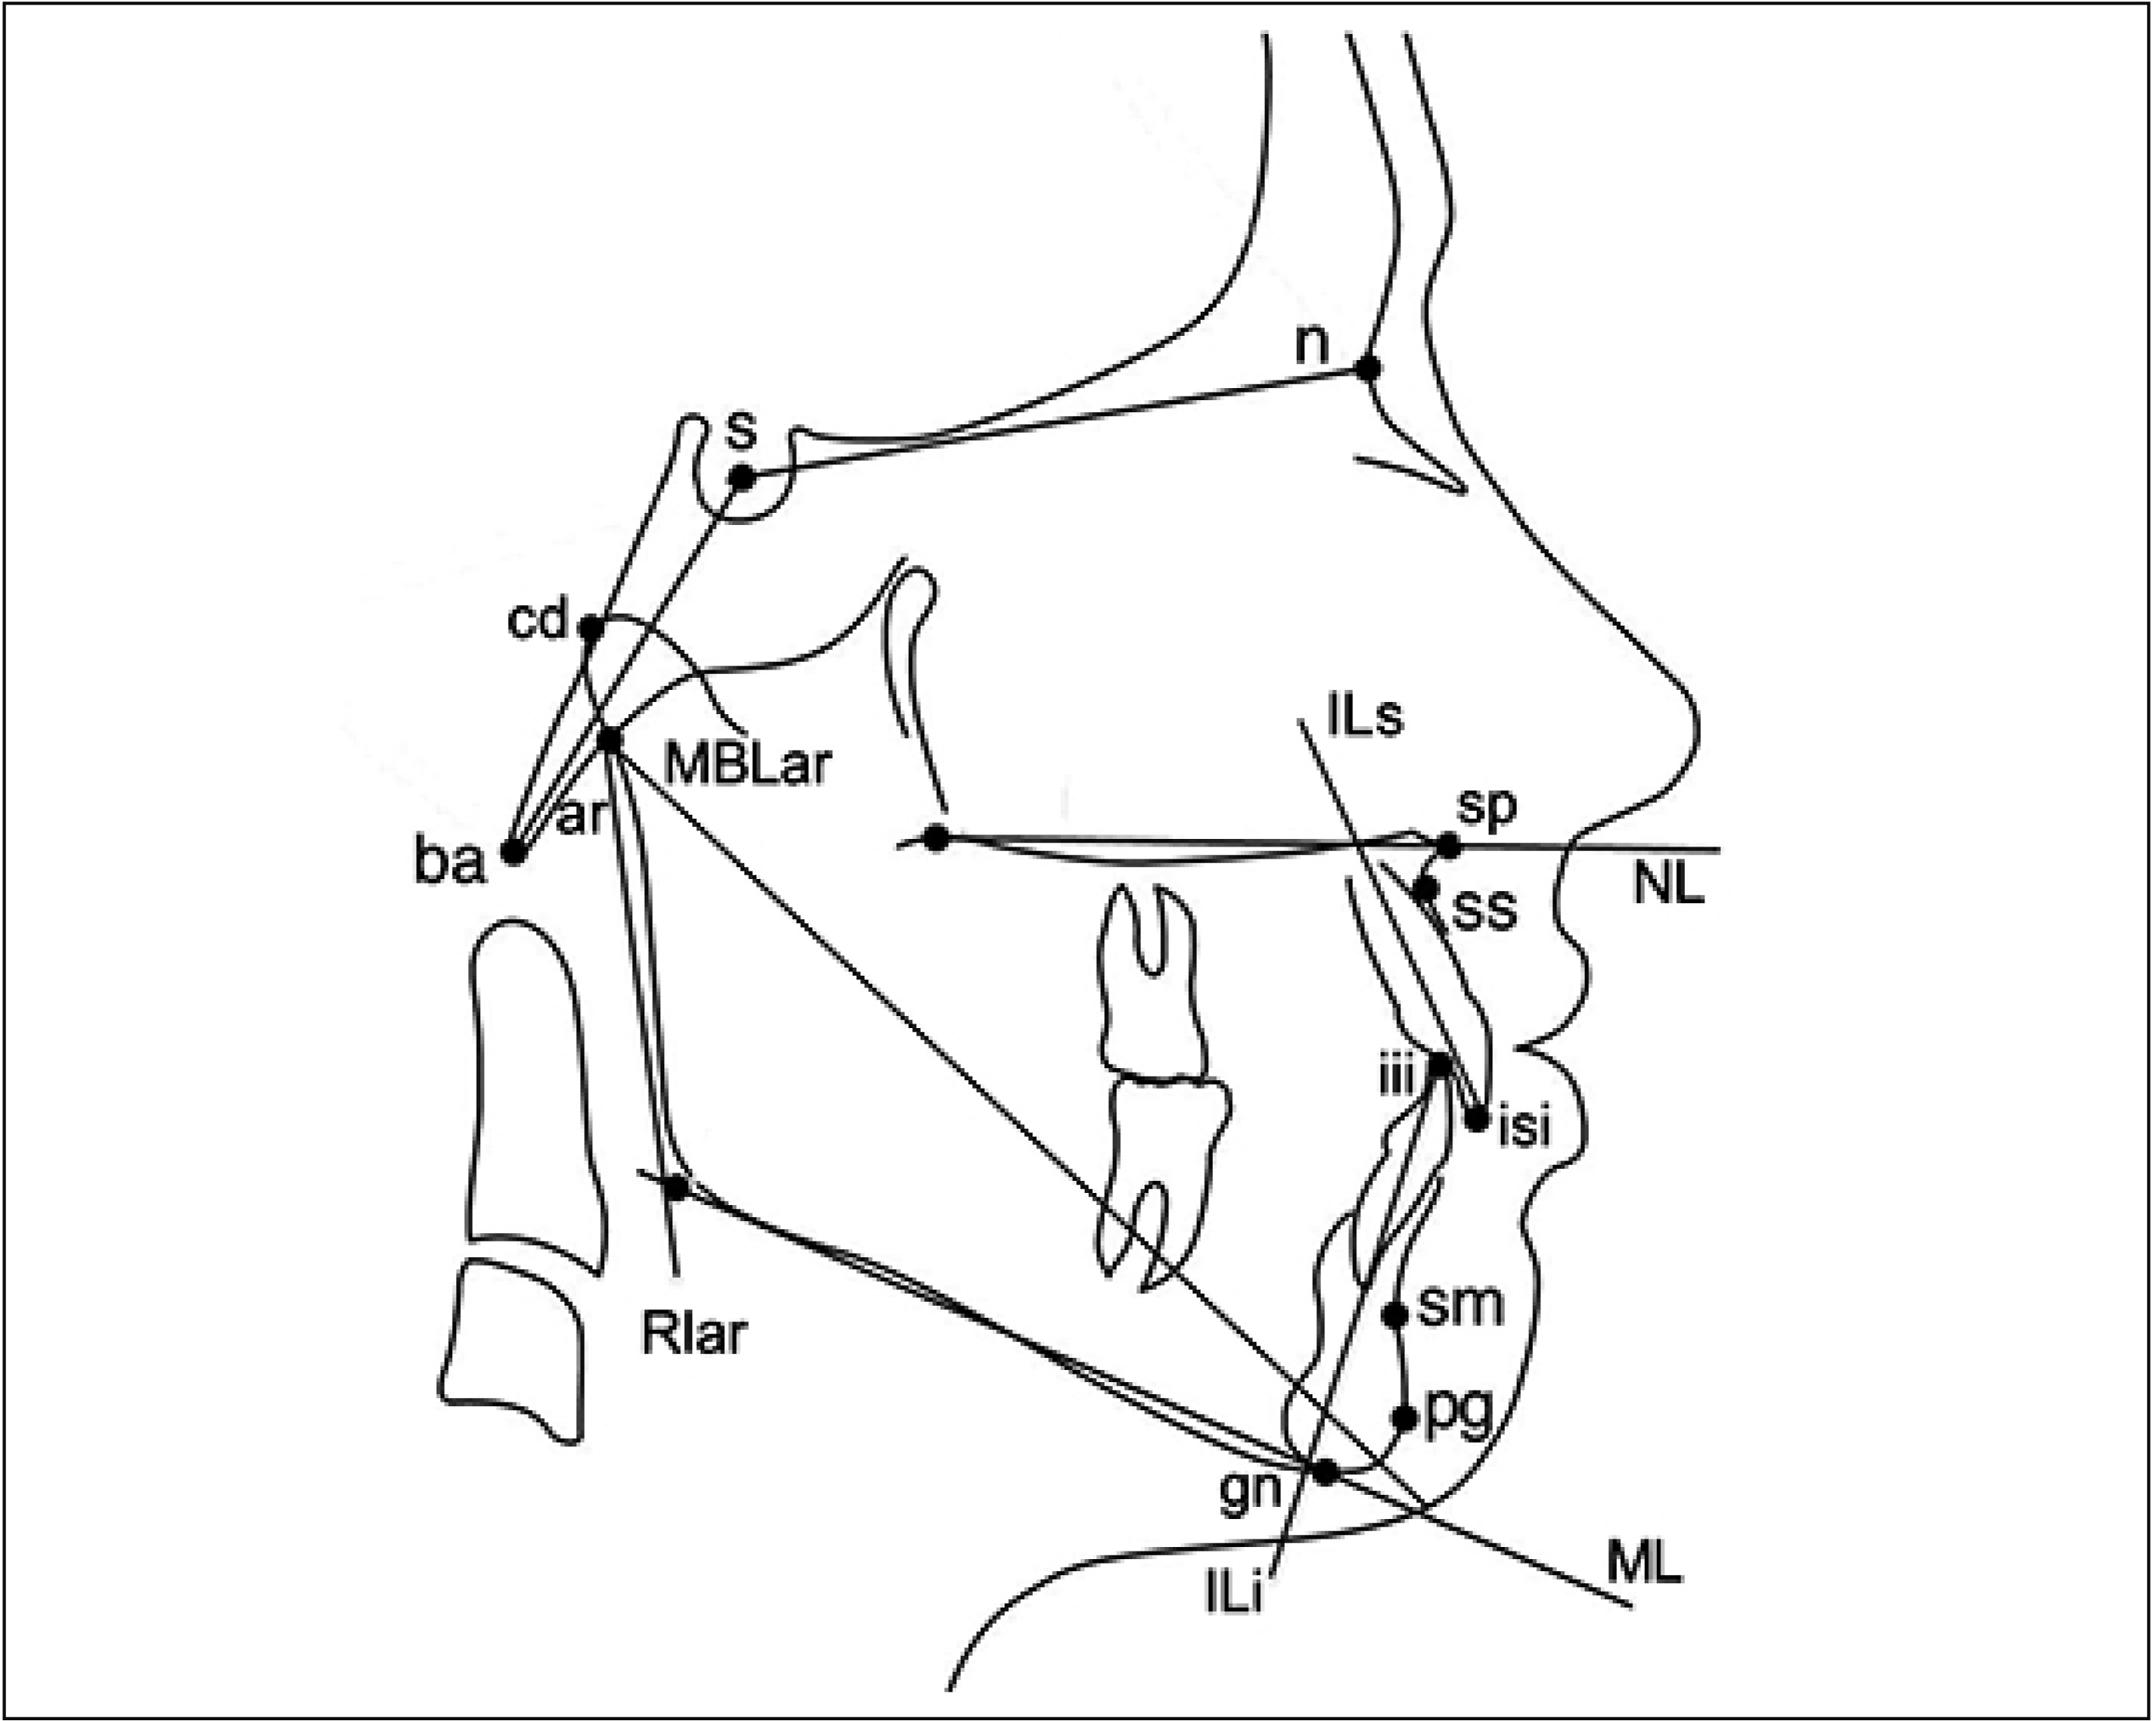
 | Figure 2Cephalometric landmarks used for measurements.14
n, Nasion; s, sella; cd, condylion; ba, basion; ar, articulare; gn, gnathion; pg, pogonion; sm, supramentale; isi, incisal superior incisor; iii, incisal inferior incisor; ss, subspinale; sp, spinale; MBLar, mandibular base line; Rlar, ramus line; ILi, incisal line inferior; ILs, incisal line superior; ML, mandibular line; NL, nasal line.
|
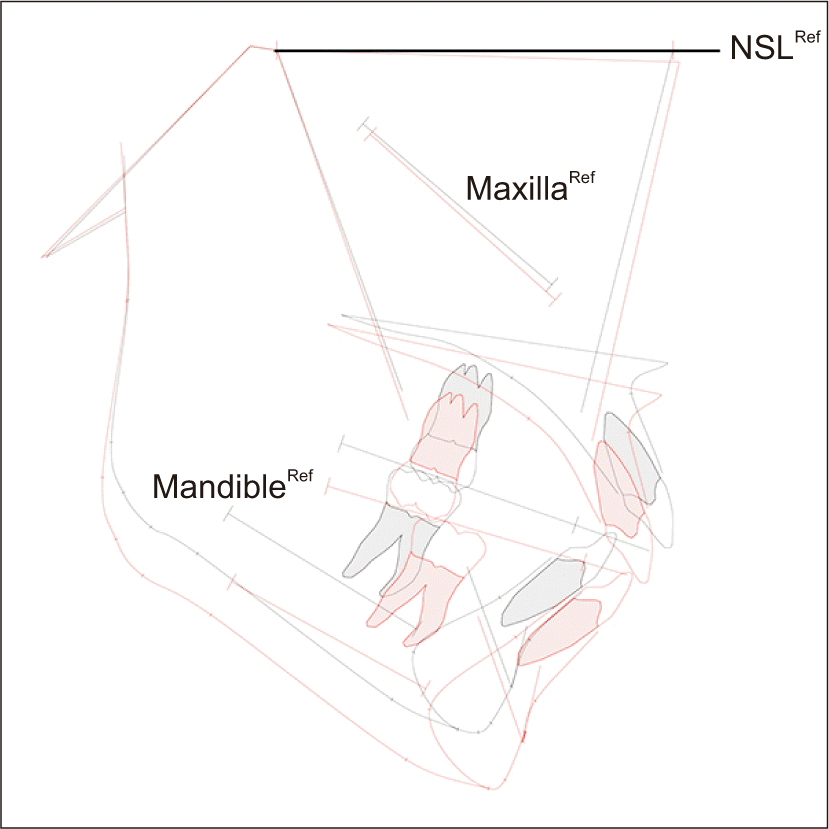
 | Figure 3Illustration of superimposition on the stable structures in the anterior cranial base between two stages.9
NSLRef, Nasion-sella line at before treatment (T1) transferred to the following lateral cephalogram as a reference line when the two sets are superimposed on the stable structures in the anterior cranial base; MaxillaRef, a reference line drawn in the maxilla when the two sets are superimposed on the stable structures in the maxilla; MandibleRef, a reference line drawn in the mandible when the two sets are superimposed on the stable structures in the mandible.
|
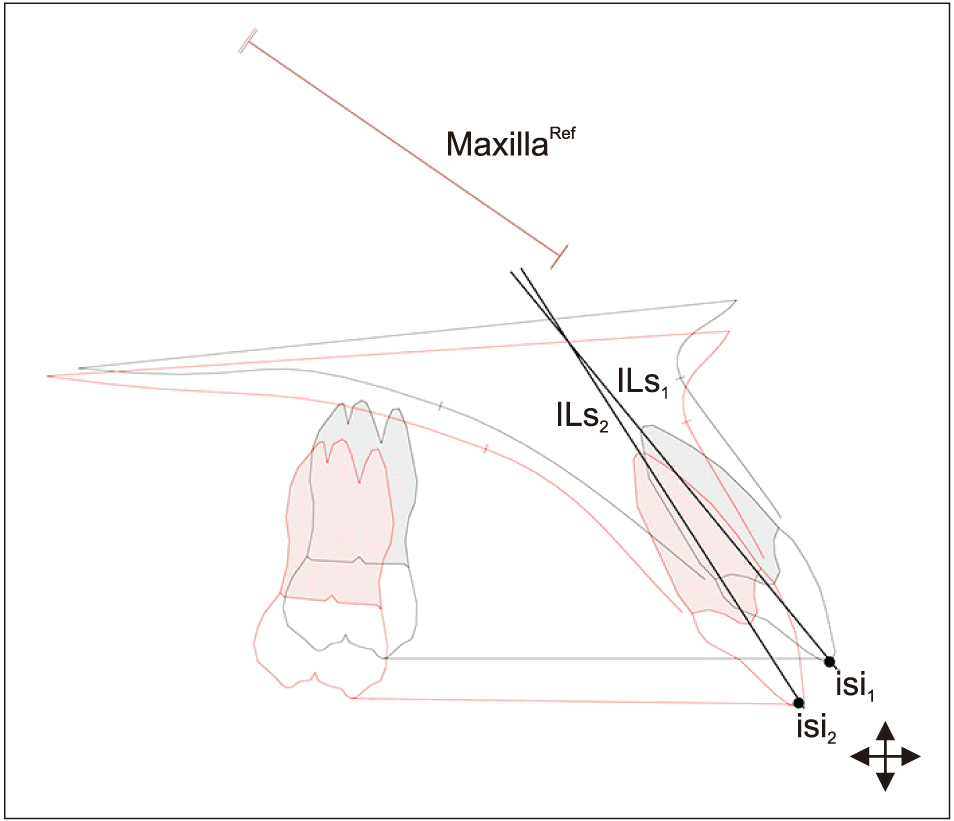
 | Figure 4Illustration of superimposition on the stable structures in the maxilla between two stages.9
MaxillaRef, Maxillary reference line; ILs1, incisal line superior stage 1; ILs2, incisal line superior stage 2; isi1, incisal superior stage 1; isi2, incisal superior stage 2.
|
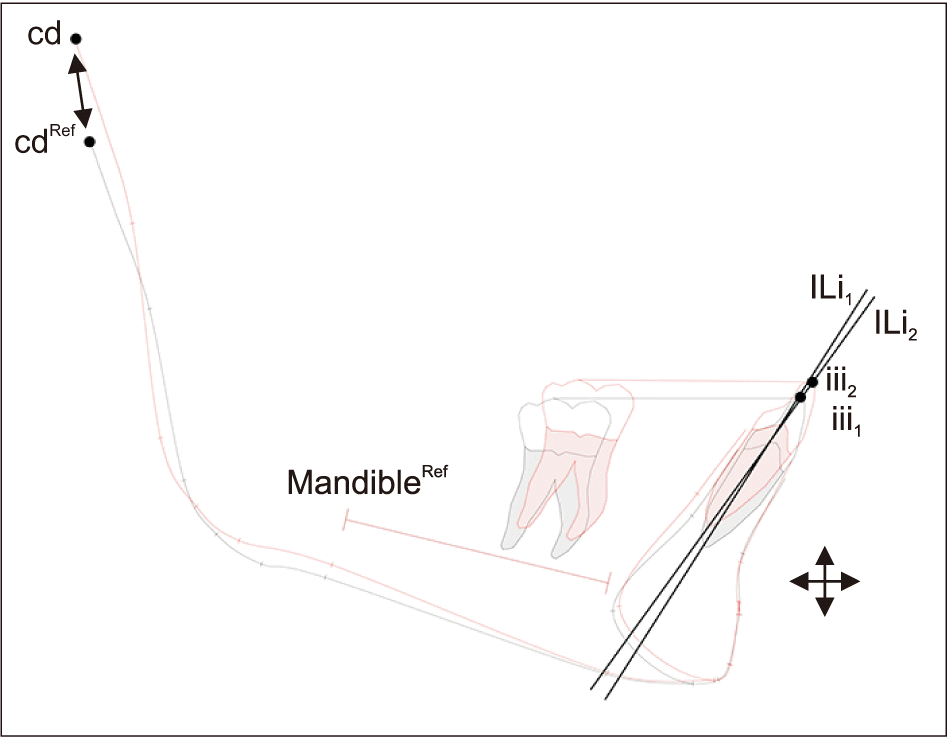
 | Figure 5Illustration of superimposition on the stable structures in the mandible between two stages.9
cd, Condylion; cdRef, condylion at baseline (T1); MandibleRef, mandibular reference line; ILi1, incisal line inferior stage 1; ILi2, incisal line inferior stage 2; iii1, incisal inferior stage 1; iii2, incisal inferior stage 2.
|
Table 1
| Variable | Z-activator (15 girls, 19 boys) | E-activator (16 girls, 12 boys) | Control (8 girls, 9 boys) | p-value | |
|---|---|---|---|---|---|
|
|
|||||
| Z vs. C | E vs. C | ||||
| CVM methods | NS | NS | |||
| CS1 | 5 (14.7) | 7 (25.0) | 1 (5.9) | ||
| CS2 | 13 (38.2) | 11 (39.3) | 7 (41.2) | ||
| CS3 | 10 (29.4) | 7 (25.0) | 9 (52.9) | ||
| CS4 | 6 (17.6) | 3 (10.7) | 0 (0) | ||
| Treatment timing | NS | NS | |||
| Early (pre-peak) | 17 (50.0) | 17 (60.7) | 8 (47.1) | ||
| Late (on-peak) | 17 (50.0) | 11 (39.3) | 9 (52.9) | ||
| Upper spine morphology | |||||
| Fusion | 3 (8.8) | 7 (25.0) | 2 (11.8) | NS | NS |
| PAD | 8 (23.5) | 8 (28.6) | 3 (17.6) | NS | NS |
| Age (yr) | 11.82 ± 1.48 | 11.17 ± 1.20 | 11.76 ± 1.50 | NS | NS |
| Atlas dimension (mm) | |||||
| Dorsal arch height | 8.49 ± 1.59 | 7.70 ± 2.03 | 8.09 ± 1.59 | NS | NS |
| PNAH | 4.02 ± 0.68 | 3.90 ± 0.92 | 4.19 ± 0.93 | NS | NS |
| A-P dimension | 45.11 ± 2.91 | 44.19 ± 3.28 | 43.47 ± 3.26 | NS | NS |
| Cranial base angle (°) | |||||
| n-s-ba | 134.24 ± 4.96 | 131.74 ± 5.25 | 130.57 ± 4.20 | < 0.05* | NS |
| Sagittal dimensions (°) | |||||
| ss-n-pg | 6.07 ± 1.67 | 5.14 ± 1.78 | 4.14 ± 1.94 | < 0.01** | NS |
| s-n-ss | 80.33 ± 2.89 | 80.81 ± 3.17 | 80.95 ± 3.01 | NS | NS |
| s-n-pg | 74.27 ± 2.66 | 75.69 ± 3.79 | 76.82 ± 3.42 | < 0.05* | NS |
| Vertical dimensions (°) | |||||
| NL/ML | 27.88 ± 4.04 | 24.37 ± 5.09 | 27.57 ± 7.73 | NS | < 0.05* |
| NSL/NL | 8.73 ± 3.17 | 8.48 ± 3.78 | 6.74 ± 2.11 | NS | NS |
| NSL/ML | 36.61 ± 4.25 | 32.85 ± 6.77 | 34.31 ± 8.07 | NS | NS |
| Mandibular form (°) | |||||
| ML/Rlar | 121.34 ± 5.54 | 120.33 ± 8.15 | 124.47 ± 6.99 | NS | < 0.05* |
| ML/MBLar | 19.26 ± 2.83 | 19.95 ± 2.96 | 19.17 ± 3.21 | NS | NS |
| Dental | |||||
| Overjet (mm) | 8.64 ± 2.11 | 8.45 ± 2.29 | 7.25 ± 2.29 | < 0.001*** | < 0.01** |
| Overbite (mm) | 2.91 ± 1.88 | 4.04 ± 1.68 | 1.41 ± 3.35 | NS | < 0.01 |
| ILs to NL (°) | 117.26 ± 6.03 | 117.41 ± 6.80 | 113.49 ± 5.77 | NS | NS |
| ILi to ML (°) | 94.78 ± 6.42 | 98.69 ± 6.67 | 94.78 ± 5.89 | NS | NS |
| Lower anterior facial height (sp-gn, mm) | 65.52 ± 3.57 | 60.02 ± 4.67 | 62.28 ± 7.69 | NS | < 0.05* |
Multiple linear regression analysis for craniofacial morphology, adjusted for age, sex, and ethnicity.
Z vs. C, Significant difference between Z-activator and control; E vs. C, significant difference between E-activator and control; T1, before treatment; CVM, cervical vertebral maturation; CS1, cervical stage 1; CS2, cervical stage 2; CS3, cervical stage 3; CS4, cervical stage 4; PAD, posterior arch deficiency; PNAH, posterior neural arch height; A-P, anteroposterior; NS, not significant.
Table 2
| Variable | Z-activator (n = 34) | E-activator (n = 28) | Control (n = 17) | p-value | |
|---|---|---|---|---|---|
|
|
|||||
| Z vs. C | E vs. C | ||||
| Treatment duration (yr) | 1.55 ± 0.67 | 1.79 ± 1.18 | 1.46 ± 0.51 | NS | NS |
| Age at T2 (yr) | 13.36 ± 1.39 | 12.89 ± 1.45 | 13.24 ± 1.69 | NS | NS |
| Cranial base changes (°) | |||||
| n-s-ba | −1.05 ± 1.84 | −0.60 ± 2.46 | 0.38 ± 1.61 | < 0.001*** | < 0.05* |
| Sagittal changes (°) | |||||
| ss-n-pg | −2.27 ± 1.28 | −1.78 ± 1.30 | −0.68 ± 0.91 | < 0.001*** | < 0.001*** |
| s-n-ss | −1.25 ± 1.52 | −0.67 ± 1.54 | 0.17 ± 0.81 | < 0.001*** | < 0.05* |
| s-n-pg | 1.02 ± 1.31 | 1.10 ± 1.56 | 0.84 ± 0.87 | NS | NS |
| Vertical changes (°) | |||||
| NL/ML | −1.59 ± 1.72 | −1.10 ± 1.78 | −0.94 ± 2.47 | NS | NS |
| NSL/NL | 0.82 ± 1.36 | 1.43 ± 1.97 | 0.94 ± 1.85 | NS | NS |
| NSL/ML | −0.79 ± 1.65 | 0.34 ± 2.11 | −0.84 ± 1.56 | NS | NS |
| Jaw rotations (°) | |||||
| NSL/MaxillaRef | 0.09 ± 0.75 | 0.44 ± 1.53 | −0.43 ± 1.01 | NS | < 0.01** |
| NSL/MandibleRef | −1.30 ± 1.94 | −1.02 ± 2.42 | −1.67 ± 2.20 | NS | NS |
| Condylar growth (mm) | |||||
| cd-cdRef | 6.52 ± 2.71 | 8.62 ± 3.47 | 4.41 ± 2.12 | < 0.001*** | < 0.001*** |
| ar-arRef | 6.52 ± 2.71 | 7.44 ± 2.86 | 4.41 ± 2.20 | < 0.01** | < 0.001*** |
| Mandibular form changes (°) | |||||
| ML/Rlar | 0.21 ± 2.20 | 0.84 ± 2.76 | −0.63 ± 2.45 | NS | NS |
| ML/MBLar | 0.39 ± 1.01 | −0.12 ± 1.38 | 0.24 ± 1.42 | NS | NS |
| Upper teeth to MaxillaRef | |||||
| isi horizontal (mm) | −2.54 ± 2.20 | −1.75 ± 1.83 | 0.96 ± 0.62 | < 0.001*** | < 0.001*** |
| isi vertical (mm) | 1.95 ± 1.89 | 2.69 ± 2.16 | 1.41 ± 0.88 | NS | < 0.05* |
| ILs inclination (°) | −5.01 ± 5.07 | −7.09 ± 5.48 | 1.89 ± 2.86 | < 0.001*** | < 0.001*** |
| Lower teeth to MandibleRef | |||||
| iii horizontal (mm) | 0.53 ± 1.59 | 1.54 ± 1.91 | 0.29 ± 1.15 | NS | < 0.01** |
| iii vertical (mm) | 1.66 ± 1.30 | 0.26 ± 1.60 | 0.87 ± 1.45 | < 0.05* | NS |
| ILi inclination (°) | 0.61 ± 4.76 | 4.47 ± 6.96 | 0.21 ± 3.14 | NS | < 0.001*** |
| Dental relationship (mm) | |||||
| Overjet | −4.96 ± 2.20 | −5.36 ± 2.43 | 0.32 ± 1.01 | < 0.001*** | < 0.001*** |
| Overbite | −0.65 ± 1.60 | −2.03 ± 2.02 | −0.11 ± 1.67 | NS | < 0.01** |
| Lower anterior facial height (sp-gn, mm) | 3.22 ± 1.84 | 4.05 ± 2.08 | 1.83 ± 1.65 | < 0.05* | < 0.001*** |
Multiple linear regression analysis, adjusted for age, sex, treatment timing, treatment duration, and ethnicity.
Table 3
| Variable | Z-activator (n = 34) | E-activator (n = 28) | Control (n = 17) | p-value | |
|---|---|---|---|---|---|
|
|
|||||
| Z vs. C | E vs. C | ||||
| Treatment duration (yr) | 3.58 ± 1.25 | 3.75 ± 1.75 | 3.41 ± 0.97 | NS | NS |
| Age (yr) | 15.36 ± 1.49 | 14.84 ± 1.90 | 15.56 ± 1.74 | NS | NS |
| Cranial base changes (°) | |||||
| n-s-ba | −2.41 ± 2.35 | −1.77 ± 2.76 | −0.34 ± 2.23 | < 0.01** | NS |
| Sagittal changes (°) | |||||
| ss-n-pg | −2.19 ± 1.53 | −2.17 ± 1.44 | −0.92 ± 1.33 | < 0.001*** | < 0.01** |
| s-n-ss | −0.27 ± 1.80 | −0.15 ± 1.84 | 0.56 ± 1.13 | < 0.01** | NS |
| s-n-pg | 1.92 ± 1.78 | 2.00 ± 1.76 | 1.46 ± 1.76 | NS | NS |
| Vertical changes (°) | |||||
| NL/ML | −1.23 ± 2.60 | −1.45 ± 2.19 | −1.72 ± 2.84 | NS | NS |
| NSL/NL | 0.04 ± 2.04 | 0.96 ± 1.82 | 0.04 ± 2.09 | NS | NS |
| NSL/ML | −1.10 ± 2.53 | −0.41 ± 2.01 | −1.69 ± 2.31 | NS | NS |
| Jaw rotations (°) | |||||
| NSL/MaxillaRef | −0.86 ± 1.03 | −0.32 ± 1.66 | −0.79 ± 1.28 | NS | NS |
| NSL/MandibleRef | −2.34 ± 3.41 | −2.49 ± 2.68 | −3.19 ± 3.08 | NS | NS |
| Condylar growth (mm) | |||||
| cd-cdRef | 11.54 ± 5.08 | 12.74 ± 5.16 | 9.65 ± 4.24 | NS | NS |
| ar-arRef | 9.78 ± 5.21 | 10.35 ± 4.90 | 8.14 ± 3.70 | NS | NS |
| Mandibular form changes (°) | |||||
| ML/Rlar | −1.69 ± 2.51 | −1.42 ± 2.94 | −2.64 ± 2.16 | NS | NS |
| ML/MBLar | 1.22 ± 1.61 | 0.77 ± 1.29 | 0.85 ± 1.39 | NS | NS |
| Upper teeth to MaxillaRef | |||||
| isi horizontal (mm) | −2.28 ± 3.39 | −1.53 ± 2.87 | 1.34 ± 0.89 | < 0.001*** | < 0.001*** |
| isi vertical (mm) | 3.92 ± 1.94 | 4.39 ± 2.45 | 2.85 ± 1.54 | < 0.001*** | NS |
| ILs inclination (°) | −5.18 ± 7.09 | −6.61 ± 8.22 | 2.21 ± 2.37 | < 0.001*** | < 0.001*** |
| Lower teeth to MandibleRef | |||||
| iii horizontal (mm) | 1.24 ± 2.36 | 1.75 ± 2.20 | 0.43 ± 1.21 | NS | < 0.01** |
| iii vertical (mm) | 1.96 ± 2.21 | 1.11 ± 1.87 | 2.00 ± 1.94 | NS | < 0.01** |
| ILi inclination (°) | 4.14 ± 7.69 | 4.25 ± 5.81 | 0.83 ± 3.47 | NS | < 0.01** |
| Dental relationship (mm) | |||||
| Overjet | −5.84 ± 2.55 | −5.54 ± 2.57 | 0.48 ± 1.25 | < 0.001*** | < 0.001*** |
| Overbite | −1.50 ± 1.38 | −1.96 ± 1.49 | 0.15 ± 1.17 | < 0.05* | < 0.001*** |
| Lower anterior facial height (sp-gn, mm) | 6.02 ± 2.31 | 6.51 ± 3.17 | 3.82 ± 2.62 | < 0.05* | < 0.05* |
Multiple linear regression analysis, adjusted for age, sex, treatment timing, treatment duration, and ethnicity.


 PDF
PDF Citation
 Print
Print


 XML Download