INTRODUCTION
MATERIALS AND METHODS
Subjects
Table 1
| Year | Elementary school | Middle school | High school | Total | ||||||
|---|---|---|---|---|---|---|---|---|---|---|
|
|
|
|
||||||||
| E1 | E4 | M1 | H1 | |||||||
|
|
|
|
|
|
||||||
| Number | % of malocclusion | Number | % of malocclusion | Number | % of malocclusion | Number | % of malocclusion | Number | % of malocclusion | |
| 2012 | 5,848 | 7.0 | 5,912 | 16.0 | 8,734 | 21.7 | 8,572 | 24.3 | 29,066 | 18.3 |
| 2013 | 5,679 | 8.5 | 5,776 | 16.4 | 8,461 | 23.0 | 8,258 | 26.6 | 28,174 | 19.7 |
| 2014 | 5,639 | 9.4 | 5,584 | 17.2 | 7,787 | 23.3 | 8,129 | 28.7 | 27,139 | 20.3 |
| 2015 | 5,553 | 8.2 | 5,481 | 14.4 | 7,437 | 23.1 | 8,883 | 23.8 | 27,354 | 17.8 |
| 2016 | 5,545 | 9.4 | 5,486 | 16.5 | 7,419 | 23.7 | 9,086 | 25.3 | 27,536 | 19.3 |
| 2017 | 5,479 | 7.2 | 5,617 | 14.3 | 7,213 | 22.4 | 8,418 | 23.1 | 26,727 | 16.9 |
| Sum | 33,743 | - | 33,856 | - | 47,051 | - | 51,346 | - | 165,996 | - |
| Mean | 5,623.8 | 8.3 | 5,642.7 | 15.8 | 7,841.8 | 22.9 | 8,557.7 | 25.3 | 27,666 | 18.7 |
| ρ-value* | 0.129 | −0.495 | 0.406 | −0.383 | −0.449 | |||||
| p-value† | 0.808 | 0.318 | 0.425 | 0.454 | 0.372 | |||||
Source of numbers and % values: annual reports of national students health examination results from 2012 to 2017.20
Assessment of malocclusion
Statistical analysis
RESULTS
The estimated prevalence of major oral diseases
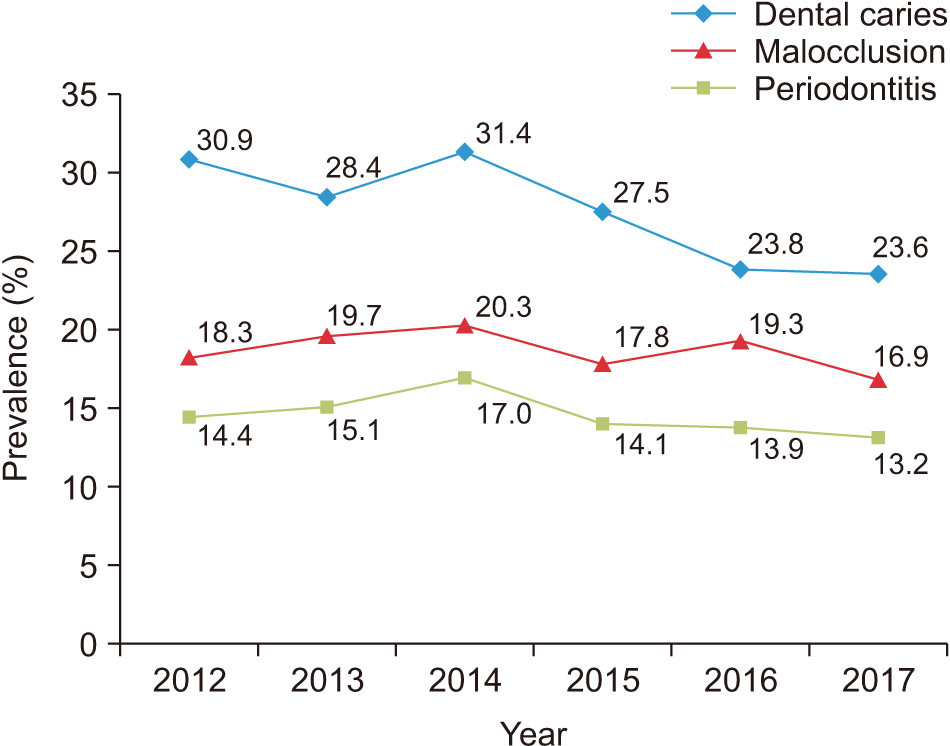
 | Figure 2Trend of changes in the estimated prevalence of major oral diseases across nationwide oral health examinations during 2012–2017. The stratified and extracted samples consisted of students in the first grade (elementary school), fourth grade (elementary school), seventh grade (middle school), and tenth grade (high school).
Source of origin: annual reports of national students health examination results from 2012 to 2017.20
|
Year-by-year changes in the prevalence of malocclusion
Changes in the prevalence of malocclusion according to sex*grade
Table 2
| Group | Value* | ||
|---|---|---|---|
| Elementary school | E1 (33,743) | Number | 5,623.8 |
| Total (%) | 8.3 | ||
| Male (%) | 7.4 | ||
| Female (%) | 9.2 | ||
| E4 (33,856) | Number | 5,642.7 | |
| Total (%) | 15.8 | ||
| Male (%) | 14.3 | ||
| Female (%) | 17.4 | ||
| Middle school | M1 (47,051) | Number | 7,841.8 |
| Total (%) | 22.9 | ||
| Male (%) | 21.0 | ||
| Female (%) | 24.9 | ||
| High school | H1 (51,346) | Number | 8,557.7 |
| Total (%) | 25.3 | ||
| Male (%) | 23.3 | ||
| Female (%) | 27.0 | ||
| Total (165,996) | Number | 27,666 | |
| Total (%) | 18.7 | ||
| Male (%) | 16.5 | ||
| Female (%) | 19.6 | ||
| p-value | Grade: E1 < E4 < M1 < H1, p < 0.0001; Sex: Male < Female, p < 0.0001; Grade*Sex, p = 0.296 | ||
p-value from two-way analysis of variance test regarding two factors including four grade levels and sex.
E1, The first grade of elementary school; E4, the fourth grade of elementary school; M1, the first grade of middle school (seventh grade); H1, the first grade of high school (tenth grade).
* Secondary data based on raw data from annual reports of national students health examination results from 2012 to 2017.20
Changes in the prevalence of malocclusion according to sex and grades
DISCUSSION
The estimated prevalence of major oral diseases
The estimated prevalence of malocclusion
Comparison of the estimated prevalence of malocclusion in the Korean population
Table 3
| Author (year) | Assessment | Sample | Size | Prevalence (%) | Included as variables | ||
|---|---|---|---|---|---|---|---|
|
|
|||||||
| Angle classification | Sex | Age | |||||
| Suhr et al.7 (1984) | Angle classification | 7–22 year old students in Seoul | 8,989 | 61 | Yes | Yes | Yes |
| Sohn et al.8 (1993) | HLD, TPI, and HMAR | Elementary students from Seoul, Gwangju, Hwasun, and Anyang | 649 | Not applicable | No | Yes | No |
| Kwon et al.9 (1989) | Angle classification | Kyungpook National University Dental Hospital | 1,795 | Not applicable | Yes | Yes | Yes |
| Yang10 (1995) | Angle classification | Seoul National University Dental Hospital | 6,788 | Not applicable | Yes | Yes | Yes |
| Baik et al.11 (1995) | Angle classification | Yonsei University Dental Hospital | 2,155 | Not applicable | Yes | Yes | Yes |
| Yu et al.12 (1999) | Angle classification | Yonsei University Dental Hospital | 9,159 | Not applicable | Yes | Yes | Yes |
| Hwang et al.13 (2001) | Angle classification | Chosun University Dental Hospital | 3,070 | Not applicable | Yes | Yes | Yes |
| Im et al.14 (2003) | Angle classification | Seoul National University Dental Hospital | 676 | Not applicable | Yes | Yes | Yes |
| Chung and Lee15 (2006) | Angle classification | Yeungnam University Hospital | 993 | Not applicable | Yes | Yes | Yes |
| Yoon16 (2008) | Angle classification | Dankook University Dental Hospital | 4,043 | Not applicable | Yes | Yes | Yes |
| Jung18 (2009) | Angle classification | Private clinics | 1,620 | Not applicable | Yes | Yes | Yes |
| Piao et al.17 (2016) | Angle classification | Yonsei University Dental Hospital | 7,476 | Not applicable | Yes | Yes | Yes |
| Choi19 (2017) | Angle classification | Private clinic | 1,254 | Not applicable | Yes | Yes | Yes |
| This study | Subjective assessment | Nationwide sample | 165,996 | 18.7 | No | Yes | Yes |


 PDF
PDF Citation
 Print
Print


 XML Download