INTRODUCTION
METHODS
Study participants
Data collection and measurements
Statistical analysis
RESULTS
General characteristics of the study participants
Table 1.
| Characteristic | Total (n=1,850) |
Daily duration of leisure-time moderate to vigorous physical activity, min/day |
Ptrenda | ||||
|---|---|---|---|---|---|---|---|
| 0 (n=750) | 1 to <10 (n=286) | 10 to <30 (n=328) | 30 to <60 (n=256) | 60≤ (n=230) | |||
| Age, yr | 39.4±15.9 | 42.2±17.2 | 36.2±13.9 | 37.9±14.5 | 38.5±14.9 | 37.0±15.4 | <0.001 |
| BMI, kg/m2 | 27.3±5.7 | 27.7±5.7 | 27.0±5.6 | 27.7±6.3 | 26.0±5.2 | 27.0±5.6 | 0.006 |
| Weight change for recent 1 year, kg | 1.8±8.3 | 1.8±8.6 | 2.1±7.5 | 2.7±9.0 | 1.5±7.4 | 0.3±7.9 | 0.102 |
| Total energy, kcal | 2,264.7±1,043.1 | 2,103.2±972.0 | 2,390.3±1,056.4 | 2,248.6±1,033.7 | 2,335.2±919.5 | 2,579.2±1,276.1 | <0.001 |
| Total monounsaturated fatty acids, g | 31.4±18.8 | 28.6±17.9 | 33.2±18.9 | 31.2±17.9 | 33.1±18.0 | 36.8±22.1 | <0.001 |
| Total polyunsaturated fatty acids, g | 17.0±11.5 | 15.5±10.7 | 18.4±12.2 | 17.4±10.9 | 17.3±11.4 | 19.3±13.3 | <0.001 |
| Total saturated fatty acids, g | 27.6±17.1 | 25.0±15.7 | 29.9±17.4 | 27.7±17.4 | 28.7±16.5 | 32.2±20.1 | <0.001 |
| Male sex | 877 (47.4) | 333 (44.4) | 138 (48.3) | 138 (42.1) | 123 (48.1) | 145(63.0) | <0.001 |
| Non-Hispanic white | 834 (45.1) | 258 (34.4) | 151 (52.8) | 163 (49.7) | 147 (57.4) | 115 (50.0) | <0.001 |
| BMI ≥30 kg/m2 | 473 (25.6) | 218 (29.1) | 66 (23.1) | 91 (27.7) | 44 (17.2) | 54 (23.5) | 0.005 |
| Current smokers | 476 (25.7) | 216 (28.8) | 84 (29.4) | 67 (20.4) | 55 (21.5) | 54 (23.5) | 0.004 |
Physical activity and serum concentrations of OCPs/PCBs
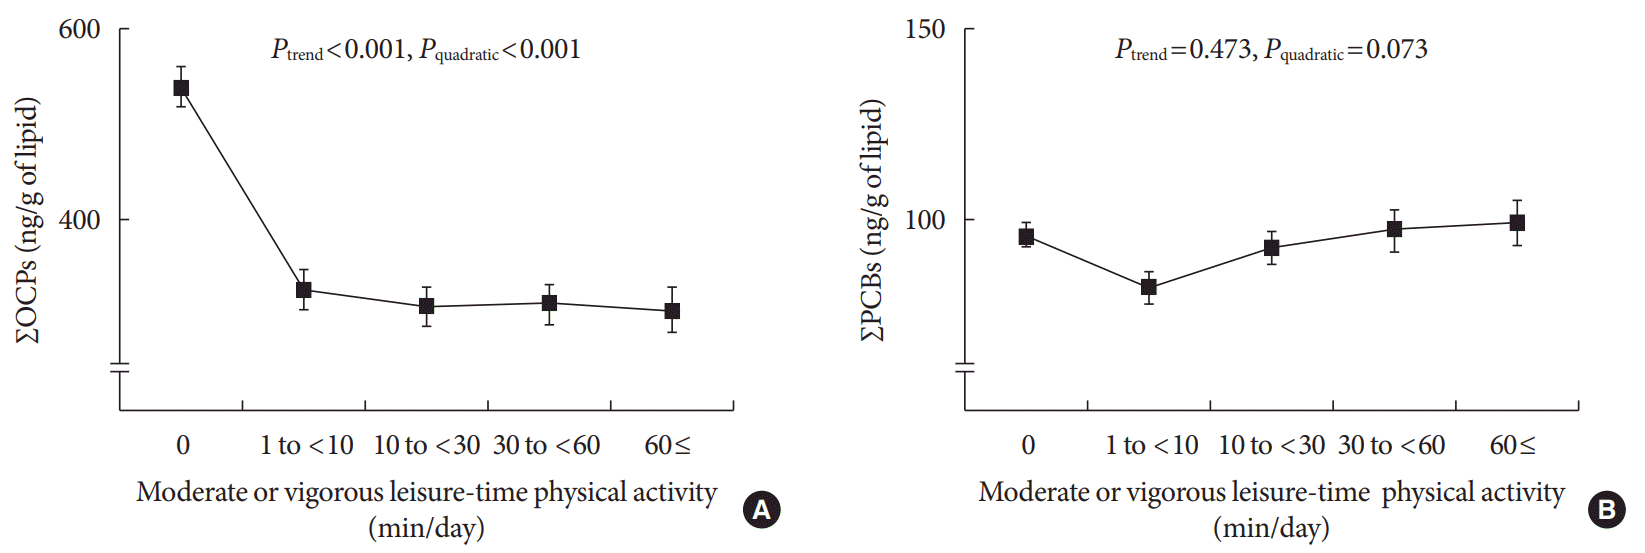
Fig. 1
Distribution of serum concentrations of persistent organic pollutants based on the level of moderate or vigorous leisure-time physical activity. Geometric mean±standard error. (A) ΣOCPs, sum of six OCPs (β-hexachlorocyclohexane, p,p′-DDE, p,p′-DDT, oxychlordane, trans-nonachlor, and heptachlor epoxide). (B) ΣPCBs, sum of 12 PCBs (PCB74, PCB99, PCB118, PCB138, PCB146, PCB153, PCB156, PCB170, PCB180, PCB187, 3,3′4,4′,5-pentachlorobiphenyl, and 3,3′,4,4′,5,5′-hexachlorobiphenyl).

Table 2.
| Variable | Modela |
Daily duration of leisure-time moderate to vigorous physical activity, min/day |
Ptrend | Pquadratic | |||||
|---|---|---|---|---|---|---|---|---|---|
| 0 | 1 to <10 | 10 to <30 | 30 to <60 | 60≤ | |||||
| No. of subjects | 750 | 286 | 328 | 256 | 230 | ||||
| ∑OCPs | 1 | 429.5±14.7 | 371.0±20.0 | 321.7±16.2 | 338.3±19.2 | 335.2±20.2 | <0.001 | 0.009 | |
| 2 | 426.9±14.8 | 374.2±20.1 | 323.3±16.3 | 334.3±19.2 | 334.3±20.2 | <0.001 | 0.013 | ||
| β-Hexachlorocyclohexane | 1 | 9.5±0.3 | 7.6±0.4 | 7.4±0.4 | 7.4±0.4 | 7.3±0.5 | <0.001 | 0.016 | |
| 2 | 9.4±0.3 | 7.7±0.4 | 7.4±0.4 | 7.5±0.5 | 7.3±0.5 | <0.001 | 0.022 | ||
| p,p'-DDE | 1 | 350.4±13.1 | 307.2±18.0 | 261.2±14.3 | 278.7±17.3 | 274.3±18.0 | <0.001 | 0.018 | |
| 2 | 348.4±13.2 | 309.8±18.2 | 262.4±14.5 | 274.7±17.2 | 273.2±18.0 | <0.001 | 0.026 | ||
| p,p'-DDT | 1 | 8.7±0.3 | 7.4±0.4 | 6.7±0.3 | 6.8±0.4 | 6.7±0.4 | <0.001 | 0.016 | |
| 2 | 8.5±0.3 | 7.4±0.4 | 6.6±0.3 | 6.6±0.4 | 6.6±0.4 | <0.001 | 0.024 | ||
| Oxychlordane | 1 | 9.7±0.2 | 9.2±0.4 | 9.0±0.3 | 8.8±0.4 | 9.8±0.4 | 0.390 | 0.018 | |
| 2 | 9.8±0.2 | 9.3±0.4 | 9.3±0.3 | 9.0±0.4 | 10.0±0.4 | 0.607 | 0.045 | ||
| Trans-nonachlor | 1 | 14.4±0.4 | 14.2±0.6 | 14.0±0.6 | 13.7±0.6 | 14.8±0.7 | 0.897 | 0.251 | |
| 2 | 14.6±0.4 | 14.5±0.6 | 14.4±0.6 | 14.0±0.6 | 15.1±0.7 | 0.918 | 0.382 | ||
| Heptachlor epoxide | 1 | 5.3±0.1 | 5.1±0.2 | 5.2±0.2 | 4.9±0.2 | 4.6±0.2 | 0.006 | 0.383 | |
| 2 | 5.3±0.1 | 5.1±0.2 | 5.3±0.2 | 5.0±0.2 | 4.6±0.2 | 0.016 | 0.205 | ||
| No. of subjects | 671 | 252 | 321 | 234 | 224 | ||||
| ∑PCBs | 1 | 90.5±2.2 | 89.8±3.4 | 97.3±3.3 | 99.1±4.0 | 104.9±4.3 | 0.001 | 0.592 | |
| 2 | 90.9±2.2 | 90.2±3.4 | 98.4±3.4 | 99.1±3.9 | 104.6±4.3 | <0.001 | 0.734 | ||
Values are presented as geometric mean±standard error (ng/g of lipid).
ΣOCPs, sum of six OCPs (β-hexachlorocyclohexane, p,p'-DDE, p,p'-DDT, oxychlordane, trans-nonachlor, and heptachlor epoxide); ΣPCBs, sum of 12 PCBs (PCB74, PCB99, PCB118, PCB138, PCB146, PCB153, PCB156, PCB170, PCB180, PCB187, 3,3',4,4',5-pentachlorobiphenyl, and 3,3',4,4',5,5'-hexachlorobiphenyl).
a Model 1: adjusted for age, sex, and race/ethnicity; Model 2: further adjustment for smoking status, body mass index, changes in weight over the past year, total calorie intake, dietary intake of total monounsaturated fatty acids, dietary intake of total polyunsaturated fatty acids, and dietary intake of total saturated fatty acids.
Subgroup analysis: physical activity and serum OCP concentrations
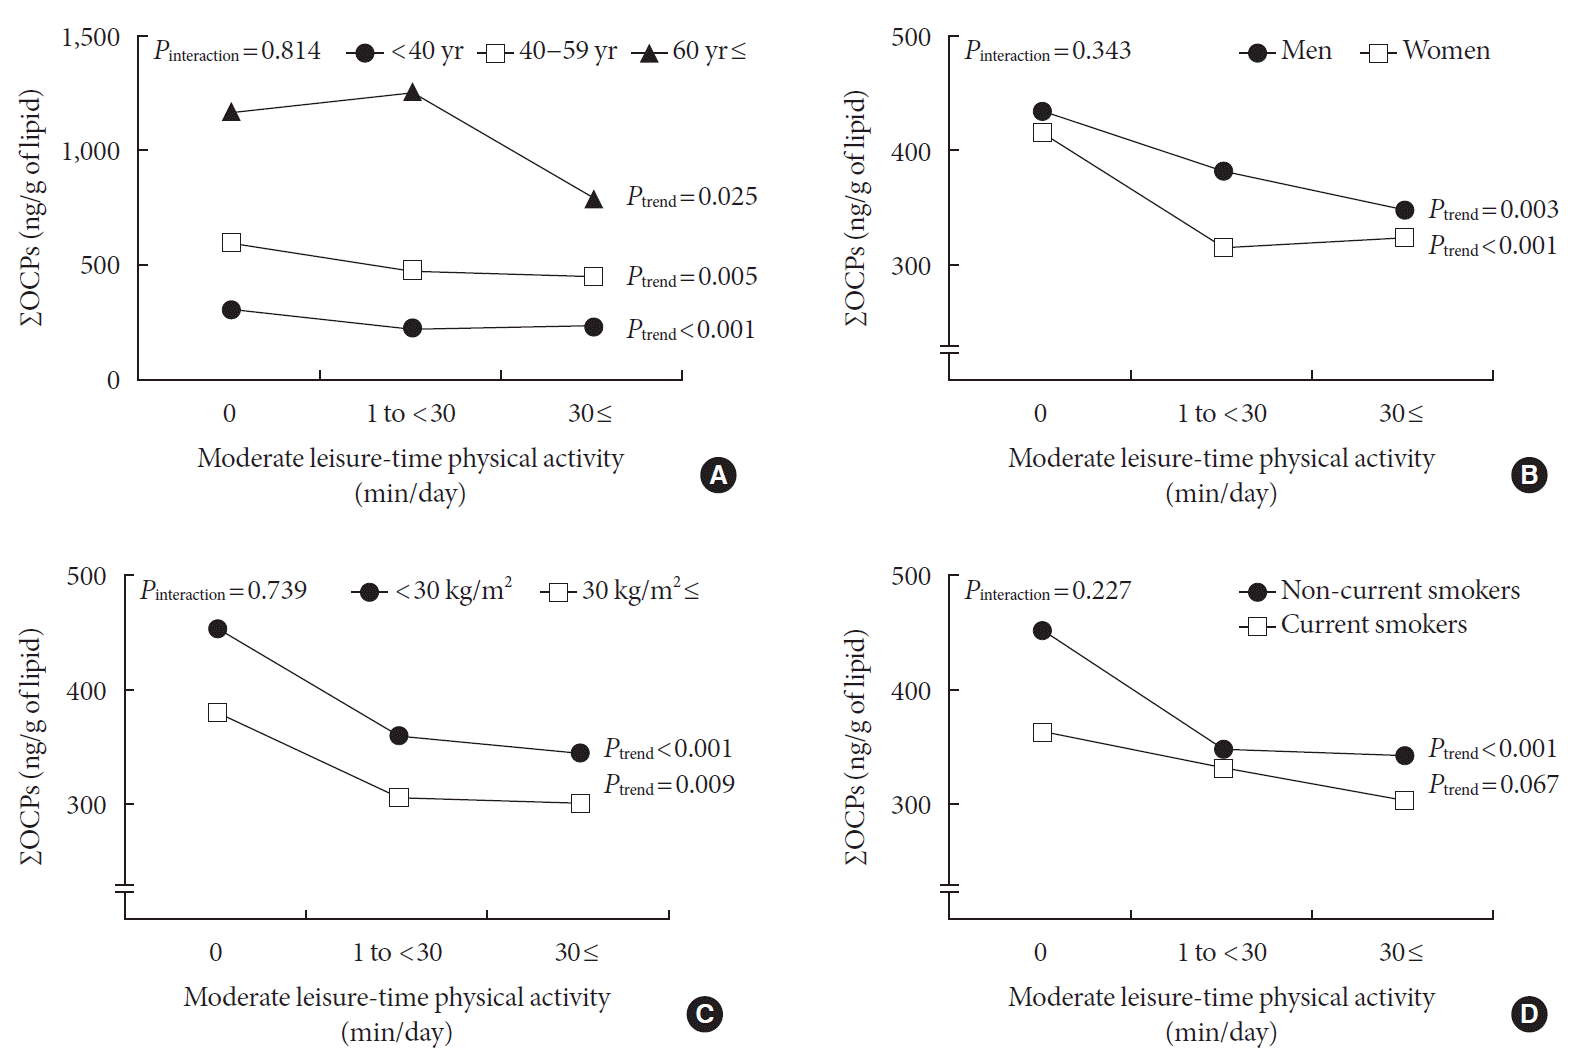
Fig. 2
Stratified analyses for the associations between duration of leisure-time physical activity and the concentrations of organochlorine pesticides (OCPs). Geometric mean±standard error. (A) Stratified by age (sample sizes: 1,087 for age <40; 518 for age 40–59; 245 for age ≥60). (B) Stratified by sex (sample sizes: 877 for men; 973 for women). (C) Stratified by body mass index (sample sizes: 1,377 for body mass index [BMI] <30 kg/m2; 473 for BMI ≥30 kg/m2). (D) Stratified by smoking status (sample sizes: 476 for current smokers; 1,374 for non-current smoker). All of these analyses were adjusted for age, sex, race/ethnicity, smoking status, body mass index, changes in weight over the past year, dietary intake of total monounsaturated fatty acids, total polyunsaturated fatty acids, total saturated fatty acids, and total energy intake. Among all covariates mentioned above, the variable used for stratification was excluded from adjustment in each analysis. ΣOCPs, sum of six OCPs (β-hexachlorocyclohexane, p,p′-DDE, p,p′-DDT, oxychlordane, trans-nonachlor, and heptachlor epoxide).


 PDF
PDF Citation
 Print
Print


 XML Download