

 PDF
PDF Citation
 Print
Print


INTRODUCTION
Incomplete polymerization of resin-based composites, due to light scattering, yields a resin with a low degree of conversion (DC%), and poor mechanical and physical properties [1]. Moreover, the unpolymerized residual monomers which elute into the oral cavity and the pulp chamber are causing several biocompatibility side effects, including cytotoxicity and mutagenicity [2]. To avoid such risks, incremental placement, with controlled layer thickness, is recommended with separate curing of each increment, however, clinically, such technique is sensitive and time-consuming [3].
As an effort to introduce resin composites that can be filled in bulk, modifications in monomer chemistry, initiation system, and filler content, as well as developing novel polymerization strategies were investigated [4]. Innovative formulations of resin monomer systems have been evaluated, such as derivatives of urethane dimethacrylate (UDMA) developed by incorporating aromatic or aliphatic groups. Aromatic urethane dimethacrylate (AUDMA) has a high molecular weight, which improves the mechanical properties and reduces the polymerization shrinkage, and water sorption [5678]. Furthermore, a new pattern of crosslinked polymers called covalent adaptable networks (CANs) has been explored. They have reversible covalent bonds whose reversibility could be triggered by light, temperature, or another external stimulus. They have the ability to adjust their internal structure through either reversible bond exchange mechanisms or reversible addition/condensation polymerization reactions. Any of these mechanisms enable the material to essentially re-equilibrate at its new structure [9]. Addition-fragmentation monomer (AFM) was incorporated in CANs. Upon light curing, subsequent bond exchange within AFM occurs, leading to enhanced photo-induced plasticity, and hence introducing new technology to reduce the polymerization-associated stresses [10]. In literature, in spite of the presence of several studies assessing the bulk-fill resin composites [1112131415], there is a lack of data focusing on studying the impact of these novel resin modifications on polymerization efficiency.
The polymerization efficiency of light-activated resin composites can be assessed by measuring the DC% [16]. One of the common ways of measuring DC% is using spectrometers, such as Raman spectrometer and Fourier infrared spectrometer; however, this technique is time and temperature-dependent [17]. The attenuated total reflection method of Fourier transformation infrared spectroscopy is a well-accepted widely used non-destructive method to evaluate DC% of dental materials [1418–22]. Furthermore, polymerization efficiency could be assessed indirectly by quantification of the unreacted residual monomers. For the quantitative measurement of monomer elution, high-performance liquid chromatography (HPLC) is widely used [23].
The aim of this study was to evaluate the polymerization efficiency of a matrix-modified bulk-fill composite (Filtek Bulk Fill) and compare it to a conventional resin composite (Filtek Supreme XTE), which has nearly the same filler system according to the data provided by the manufacturer. DC% and elution of four monomers were measured over 3 different storage periods (24 hours, 7 days, and 30 days). In addition, the fillers were examined for both materials after calcination by scanning electron microscopy (SEM).
Go to : 
MATERIALS AND METHODS
Specimen preparation
A bulk-fill composite Filtek Bulk Fill (B) (shade: A2) (3M ESPE, St. Paul, MN, USA) and a conventional resin composite Filtek Supreme XTE (S) (shade: A2 body) (3M ESPE) were utilized (Table 1). Cylindrical specimens (diameter: 3 mm, height: 5 mm) were made from both materials using a Teflon mold. A total sample size of 38 specimens was used in this study, 18 specimens for DC% and 18 for monomer elution tests, where the number of specimens in each experimental group equal to six (n = 6). For SEM examination, additional 2 specimens were prepared, one from each material. A power analysis was designed to have adequate power to apply a two-sided statistical test of the research hypothesis (null hypothesis) that there is no difference between different tested materials on packing in bulk or incremental. According to the results of Sgabri et al. [1] and Rothmund et al. [11], effect size (f) was found to be 9.81. By adopting an alpha (α) level of 0.05 and a beta (β) level of 0.20 (Power = 80%); the predicted sample size (n) was found to be a total of 6 samples, 2 samples per group. Sample size calculation was performed using G*Power (version 3.1.9.4). Filtek Bulk Fill composite was packed in bulk (5 mm one time) (BB group) and incrementally (increments: 2 mm + 2 mm + 1 mm) (BI group), while Filtek Supreme was packed incrementally (increments: 2 mm + 2 mm + 1 mm) (SI group). A celluloid strip was placed on a glass slide under the lower surface of the mold before packing of the materials and another one on the top side after the packing of the last increment and before curing. Specimens were light-cured for 30 sec per each increment (following the manufacturer instructions) using a light-curing device 3M Elipar DeepCure-S (3M ESPE), which produces blue light (430–480) nm wavelength and with an output intensity of 1470 mW/cm2. The light guide tip has a 10 mm diameter and was placed perpendicularly and directly on the celluloid strip covering the top surface of the specimen. The light intensity was periodically checked (every 3 irradiations) by a built-in radiometer.
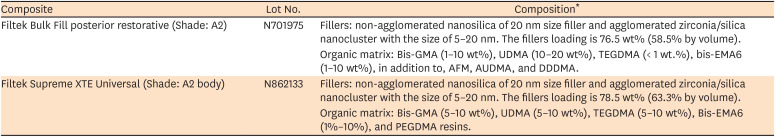
Table 1
Materials used in the study, their lot number and composition
wt%, percentage by weight; Bis-GMA, bisphenol-A glycidyl dimethacrylate; UDMA, urethane dimethacrylate; TEGDMA, triethylene glycol dimethacrylate; Bis-EMA6, bisphenol A polyethylene glycol diether dimethacrylate; AFM, addition-fragmentation monomer; AUDMA, aromatic urethane dimethacrylate; DDDMA, 1,12-dodecane dimethacrylate; PEGDMA, polyethylene glycol dimethacrylate.
*According to data provided by the manufacturer (3M ESPE, St. Paul, MN, USA).
![]()
Measurement of DC%
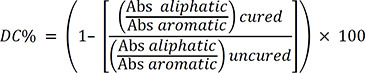
For measuring DC%, specimens were stored immediately after preparation. To keep them dry, they were stored in light-proof glass vials with silica gel orange (2–3 mm) with an indicator (Perlform, Carl Roth, Karlsruhe, Germany). They were preserved at 37°C in a VWR digital mini incubator (VWR; Radnor, PA, USA). Specimens were taken for measurement after 24 hours, 7 days and 30 days and stored back in the incubator in-between. Measurements were done using Fourier-transform infrared spectrometer (FTIR) (PerkinElmer Universal ATR, PerkinElmer, Waltham, MA, USA) coupled to a sampling accessory that has an attached Frontier Universal Diamond/ZnSe ATR crystal with a single reflection top-plate and pressure arm. Before starting the measurement, a background spectrum was measured. Five unpolymerized specimens were also measured. The measurement of each polymerized specimen was performed at the bottom surface of the specimen. Each specimen was suitably pressed against the ATR crystal by the aid of the pressure arm to maintain good contact between the specimen and the ATR crystal. The FTIR spectrometer was operated under the following conditions: 4000–500 cm−1 wave number, 4 cm−1 resolution, and 30 scans. Plot wave number versus absorption peak intensity was digitally recorded using a spectrum software (PerkinElmer Spectrum 10; PerkinElmer). The spectra were then transferred to data sheets Excel 2007 (Microsoft, Redmond, WA, USA). DC% was measured by calculating the ratio of the absorbance intensities (Abs) of the aliphatic C=C peak at wave number 1,638 cm−1 and that of the aromatic C=C (internal standard) at 1,608 cm−1 of the uncured and cured specimens. In the case of Filtek Bulk Fill composite, the aromatic C=C peak at wave number 1600 cm−1 was used as an internal standard due to the lack of the aromatic C=C peak at 1,609 cm−1. DC% was calculated according to the following equation:
Monomer elution
For measuring monomer elution, each prepared specimen was weighted by a standard level analytical balance that has readability down to 0.1 mg and capacity up to 220 g (Mettler-Toledo, Giessen, Germany). The mean mass of Filtek Bulk Fill specimens was 13.6 mg, and the mean mass of Filtek Supreme XTE specimens was 13.1 mg. Each specimen was then immersed in 1 mL of 75% ethanol/water solution (Ethanol HPLC Grade; Sigma-Aldrich, Steinheim, Germany) in a glass vial and stored in darkness at room temperature. HPLC measurements were performed after 24 hours, 7 days, and 30 days after immersion, respectively. After each interval, the whole solution was taken up for analysis, following that the samples were air-dried with a very mild stream of air and then immersed in 1 mL of fresh 75% ethanol/water solution and then stored back in darkness at room temperature. Quantitative analysis was performed by HPLC device (Agilent 1260 series, Agilent, Santa Clara, CA, USA) equipped with a stationary phase: column C18 (Zorbax Eclipse; Agilent) having 100 mm length, 4.6 mm inner diameter and with a particle size of 3.5 μm. The mobile phase was a mixture of water and acetonitrile (HPLC Grade; Sigma–Aldrich); (H2O:CH3CN): (30%:70%) (Isocratic: constant ratio all over the cycle). The flow rate was 1 mL/min and the injector volume was 10 μL. The column temperature was maintained at 40°C. The initial conditions were re-established and held for 5 minutes to ensure minimal carry-over between injections. Ultraviolet detection was performed at 205 nm for monitoring the elution of hydroxyethyl methacrylate (HEMA), bisphenol-A glycidyl dimethacrylate (Bis-GMA), UDMA, and triethylene glycol dimethacrylate (TEGDMA) by a multi-wavelength detector. Data acquisition was completed using Chromeleon software (Dionex, Sunnyvale, CA, USA). Before measurement, the standard solutions were diluted with 75% ethanol/water solution to produce the final calibration solutions: 2.5, 5, 10, 20, 40, and 80 µg/mL. The peak area for each monomer was determined and plotted versus concentration using linear regression analysis (calibration curves). The regression equations of the calibration curves, the linear correlation coefficient (R2), the retention times (RT), the limit of detection (LoD), and the limit of quantification (LoQ) of each investigated monomer are shown in (Table 2). The compounds were identified by comparison of their retention times with those of the reference compounds under the same HPLC conditions. The calculation of the eluted monomers was done after consideration of the mean mass of the specimen of each material to be expressed in the unit µg/mg.
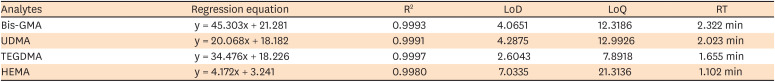
Table 2
The regression equations of the calibration curves, the linear correlation coefficient (R2), the limit of detection (LoD) in µg/mL, the limit of quantification (LoQ) in µg/mL, and the retention times (RT) in min of the investigated monomers at 205 nm
R2, linear correlation coefficient; LoD, limit of detection; LoQ, limit of quantification; RT, retention time; Bis-GMA, bisphenol-A glycidyl dimethacrylate; UDMA, urethane dimethacrylate; TEGDMA, triethylene glycol dimethacrylate; HEMA, hydroxyethyl methacrylate.
![]()
SEM
In order to study the filler content, specimens were calcinated by heating them in dry conditions for one hour at 600°C in a muffle Heraeus Thermicon P furnace (Heraeus Instruments, Hanau, Germany). Calcinated specimens were then cleaned using ethanol solution in an ultrasound bath for 10 minutes and then dried by air. After drying, the specimens were sputter-coated with Gold/Platinum by an ion-sputter instrument (SCD 030, Balzer, Liechtenstein) for 1 minute, and then examined using SEM (Philips XL 30 CP, Philips, Eindhoven, The Netherland) operated at 10 kV.
Statistical analysis
Two-way mixed model analysis of variance (ANOVA) was used to study the effect of packing techniques of different materials and storage periods, as well as their interaction. Repeated measures ANOVA followed by multiple pairwise comparisons utilizing Bonferroni correction was used to analyze the effect of storage periods, while one-way ANOVA followed by Tukey's post hoc test was used for analyzing the effect of packing techniques (α = 0.05, IBM SPSS Statistics for Windows, Version 20.0. IBM Corp, Armonk, NY, USA).
Go to :
RESULTS
Statistical analysis of DC% results revealed that, after 24 hours and 7 days storage periods, Filtek Bulk Fill-packed incrementally (BI group) had no significant difference in DC%, 50% ± 3%, 57% ± 3%, compared to Filtek Bulk Fill composite-packed in bulk (BB group), 48% ± 3%, 52% ± 2%, respectively. No significant difference was found in DC% between BB and Filtek Supreme-packed incrementally (SI group) over the different storage periods. For BB, DC% did not increase significantly with increasing storage period (Table 3).
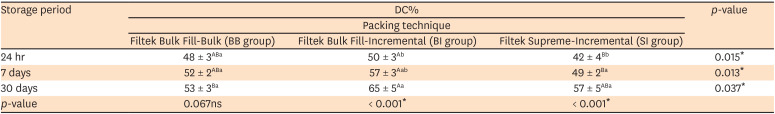
Table 3
Mean ± standard deviation (SD) values of degree of conversion (DC%) for different packing techniques and storage periods
The values are mean ± SD.
SD, standard deviation; DC%, degree of conversion.
Different uppercase and lowercase superscript letters indicate a statistically significant difference within the same horizontal row and vertical column respectively; *, significant (p ≤ 0.05); ns, non-significant (p > 0.05).
![]()
Statistical analysis of monomer elution results revealed that Filtek Supreme composite had significantly higher elution than Filtek Bulk Fill composite packed either in bulk or incrementally. Regarding the difference in elution between different types of monomers, HEMA had the highest mean elution value followed by UDMA then Bis-GMA, while TEGDMA was not quantified. After 30 days, no elution was detected from all groups except for HEMA from BI (2.8 ± 0.8 µg/mg) and SI (13.5 ± 1.6 µg/mg) (Table 4).
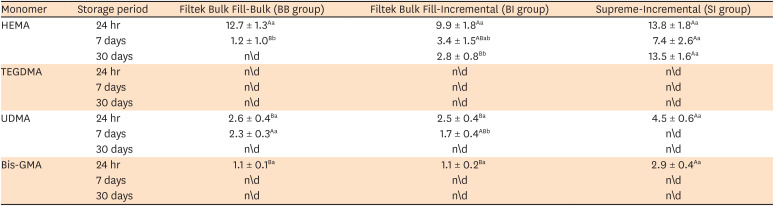
Table 4
Mean ± standard deviation (SD) values of monomer elution (µg/mg) for different packing techniques and storage periods
The values are mean ± SD.
SD, standard deviation; n∖d, not detected; HEMA, hydroxyethyl methacrylate; TEGDMA, triethylene glycol dimethacrylate; UDMA, urethane dimethacrylate; Bis-GMA, bisphenol-A glycidyl dimethacrylate.
Different uppercase and lowercase superscript letters indicate a statistically significant difference within the same horizontal row and vertical column respectively in the same monomer.
![]()
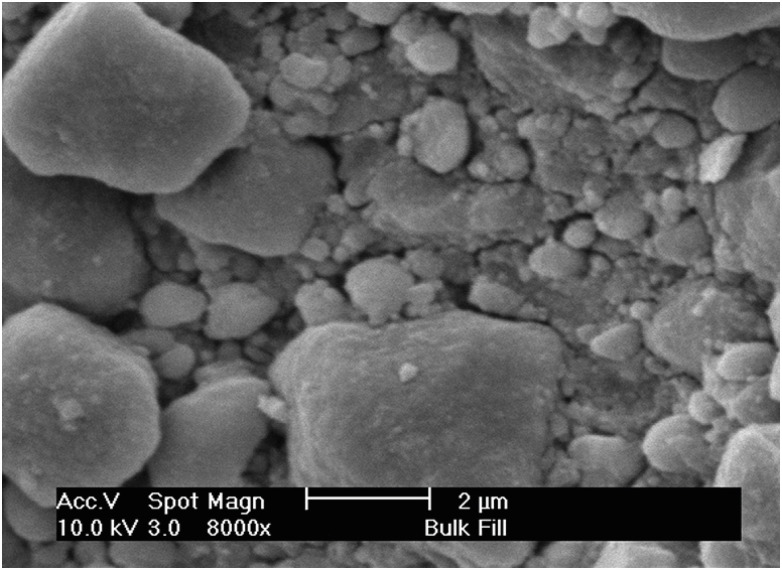
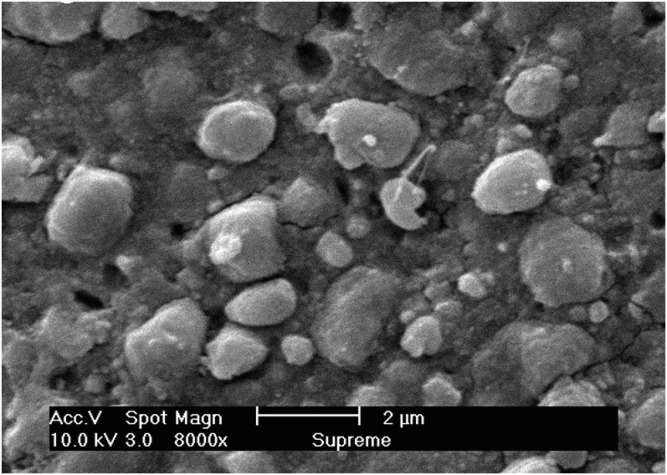
Unlike the data provided by the manufacturer, that both materials have the same filler system, differences were found in fillers' size and agglomeration between them. Filtek Bulk Fill composite was characterized by having clusters composed of three distinguished filler sizes (5 µm, 2 µm, and 0.5 µm), while Filtek Supreme composite had a more homogenous distribution (2 µm and 0.5 µm) in addition to sub-microscopic fillers fill the inter-spaces (Figures 1 and 2).
Go to :
DISCUSSION
The polymerization efficiency of resin composites depends mainly on matrix formulation, filler content, and polymerization conditions [24]. Filtek Bulk Fill composite was chosen in the current study to evaluate the polymerization efficiency of bulk-fill composites based on matrix modification technology. The manufacturer claimed that Filtek Bulk Fill was produced by matrix-modification of Filtek Supreme XTE with keeping the same filler system unmodified. The polymerization conditions, including temperature, mold, irradiation protocol, and shade of the material were standardized in this study. Hence, the difference in the test results between both materials assumed to be attributed to the difference in the chemistry of the resin matrix.
However, the differences in fillers' size and agglomeration, found in this study, should be considered which might have an impact on light penetration and curing efficiency. Besides, there is a slight difference in the filler volume percentage disclosed by the manufacturer (Table 1). Filtek Bulk Fill has a filler volume percentage of 58.5%, while Filtek Supreme has 63.3%. Moreover, no information was disclosed by the manufacturer about the initiator/accelerator content. All of these factors could have an influence on the polymerization process and hence might affect DC% and monomer elution results.
Specimens of DC% test were stored with silica particles in order to ensure dryness and to prevent water adsorption onto specimens; since moisture acts as a source of noise in FTIR measurements on using the mid-IR [18]. DC% is time and temperature-dependent; that's why it was measured over three different storage periods and the specimens were kept stored on a constant temperature (normal mouth temperature) 37°C [17]. DC% after 24 hours was 48 ± 3% for Filtek Bulk-Bulk (BB) after 30 seconds of curing time. Lempel et al. [15] reported that DC% of Filtek Bulk Fill-Bulk was 32 ± 7% at a depth of 4 mm after 20 seconds of light curing. The disagreement of the results might be referred to as the difference in curing time.
DC is generally reported in the range of 35% to 78% [125]. Nonetheless, free monomers represent only 10% of unconverted double bonds. Hence, relatively low DC % is not always related to large numbers of unreacted monomers or unconverted double bonds [26]. However, low DC% can be attributed to the structure of some monomers, like TEGDMA, which have a couple of carbon double bonds (C=C), one on each side and it may react only with one of them. In such a case, the monomer is bonded to the polymer network from one side only and cannot be eluted. Moreover, during the termination of some polymerization reactions, new C=C bonds may be formed, which can give false lower DC% [21]. Additionally, celluloid strips used to prevent the formation of the oxygen-inhibited layer are not fully effective, as this layer is only prevented in an oxygen-free atmosphere [27].
Both BB and SI groups had comparable DC%, which is in agreement with Zorzin et al. [20] and Li et al. [16]. This could be explained by the fact that Filtek Bulk contains innovative high molecular weight monomer, AUDMA, which has a fewer concentration of double bonds per unit of weight which permits attaining higher DC% values [28].
A significant increase in DC% values was recorded with longer storage, which complies with the findings of Schneider et al. [29], who demonstrated that an increase in DC% could still be observed up to one month and they attributed this to the continuous reaction of entrapped residual monomers. Sgarbi et al. [1] reported that a larger quantity of TEGDMA is considered to be the main contributor to post-curing polymerization. This could explain why there was no significant difference in DC% values with a longer storage period of BB group (TEGDMA content is about 1 wt.%); meanwhile, DC% in SI group (TEGDMA content is about 5 wt.%) increased on storage for up to one week (Table 1). This was also in harmony with a study by Alshali et al. [18], who reported an insignificant difference between immediate and 24 hours DC% of Filtek Bulk composite when it was packed in bulk.
Another explanation of the significant post-cure increase of DC% was reported by Anseth et al. [30], who assumed that the free space generated microscopically during the polymerization of monomers needs a harmonious movement of the crosslinked polymer network to be manifested macroscopically as volumetric shrinkage. Otherwise, a temporary excess of internal free space is created within the bulk, which effectively provides more space for the mobility of free radicals. Therefore, higher DC% could be achieved with time till equilibrium. According to the manufacturer data, Filtek Bulk Fill composite was incorporated with AFMs, which provide a mechanism for rapid re-equilibration upon curing to overcome the polymerization shrinkage. That may also explain the insignificant difference in DC% with storage in the case of BB. However, in the case of BI, the oxygen-inhibited layer in-between the increments might contain excess trapped unreacted monomers which contribute to the post-cure polymerization.
Quantification of eluted residual monomers is a crucial indicator of the polymerization efficiency and the biocompatibility of the material [31]. Monomers of high molecular weight, such as Bis-GMA and UDMA decompose in the gas chromatograph, and thus just the products of their decomposition are detectable. On the contrary, HPLC has the capability of detecting leached monomers such as Bis-GMA and UDMA, as well as TEGDMA and HEMA [2832]. The United States Food and Drug Administration (USFDA) has recommended 75% ethanol/water as a food and oral simulating liquid [33]. Contamination during testing procedures may result in false-positive detection of compounds, so great care was taken in order to avoid any contamination. The use of plastic containers or instruments, as well as disposable gloves, was avoided since they could probably release leachable compounds. Therefore, glass vials and metal instruments were used in the current study [34].
The results of the current study revealed that the quantity and rate of elution varied significantly between different monomers. The monomers eluted in variable quantities in the descending following order: HEMA, UDMA, and Bis-GMA, while TEGDMA was not quantified.
Lempel et al. [15] and Tanaka et al. [35] reported that monomers with small molecular weight could be extracted in considerably higher quantities than monomers with larger molecular weight. Although TEGDMA has a lower molecular weight than Bis-GMA and UDMA, however, it showed no elution. Polydorou et al. [36], as well as Manojlovic et al. [32], stated that the low viscosity and high reactivity of TEGDMA made it more involved in the reaction and became attached to the polymer chain. In addition, TEGDMA has high hydrophilicity, which decreases its affinity to organic solvents like ethanol and consequently decreases its diffusion into the solution.
HEMA, on the other hand, is a water-soluble monomer, having a low molecular weight, as well as inherent flexibility, which leads to a high amount of release [11]. On the opposite, Bis-GMA was eluted in lesser amounts due to its high molecular weight and high viscosity. Furthermore, UDMA has a lower molecular weight than Bis-GMA. Therefore, its release is faster and larger at certain time intervals [28].
Although HEMA was not listed in manufacturers’ data as one of the components of the organic matrix, it was detected and eluted in significantly high amounts. This was in agreement with previous studies on dental composite resins [21323738] in which HEMA was eluted into organic solution and saliva, despite it is not a component of their matrix. These findings support the postulation that the HEMA monomer could elute as a degradation product of UDMA [38]. Another postulation [21] stated that HEMA is formed during the polymerization process by chemical reactions or rearrangements in the complex matrix of a composite.
The amount of solvent sorption into the structure of the polymer and the ability to swell and widen the space between the polymer chains are influenced by the degree of conversion, the density of crosslinking between the chains, the affinity of the polymeric network to the solvent and the compliance of the coupling between the resin and the filler [12]. Sideridou et al. [39] demonstrated that water sorption of the following homo-polymers was arranged in a descending way in the following order: Poly-TEGDMA, poly-Bis-GMA, and poly-UDMA. The higher water sorption of poly-TEGDMA could be attributed to the flexibility of their polymeric network that allows higher swelling by water. Meanwhile, the high water sorption of poly-Bis-GMA is attributed to the presence of hydroxyl groups. The hydrogen bonds between water and urethane groups of poly-UDMA are weaker. Therefore, it shows less water sorption. Accordingly, it could be clear why higher elution was significantly detected from Filtek Supreme than Filtek Bulk. Since, polymerized Filtek Supreme contains a larger quantity of poly-TEGDMA and poly-Bis-GMA than Filtek Bulk Fill, based on the composition of the matrix of each of them provided by the manufacturer.
According to SEM images, differences in fillers' size and agglomeration could also lead to a difference in the distribution of the matrix in each material, which might also be a reason leads to the difference in monomer elution. Increasing the filler particle size and agglomeration is a method to improve the light penetration, thus increasing the depth of cure, which was observed in Filtek Bulk Fill.
Further studies regarding quantification of the polymerization shrinkage are suggested. In addition, Michelsen et al. [40] reported that more than 30 different chemical substances released from dental resin-based composites into different storage media, including residual unreacted monomers, oligomers, polymerization catalysts, initiators, stabilizers, biodegradation products, and polymerization products, as well as, impurities, and metal ions. Hence, it is worth mentioning that the quantitative analysis by HPLC of elution of selected unreacted HEMA, Bis-GMA, TEGDMA, and UDMA would not provide an absolute measure of the quality of released components; and it is a limitation of this study. Therefore, full monomer elution analysis is recommended.
Go to :
 XML Download