INTRODUCTION
METHODS
Materials
Table 1
Peptide synthesis
Cell culture
Cell viability
Melanin content assay
Tyrosinase activity test
Melanosome isolation
Melanosome uptake test
Melanosome degradation test
Gene expression analysis (RT-PCR)
Protein expression analysis (Western blotting)
Skin equivalent analysis
Statistics
RESULTS
Peptide mixture inhibits α-MSH-induced melanin synthesis and tyrosinase activity in B16F10 cells
 | Fig. 1Effects of the peptide mixture on cell viability and melanogenesis.(A) B16F10 melanoma cells and HaCaT keratinocytes were treated with indicated concentration of peptide mixture for 72 h. Cell viability was determined by MTT assay. (B) B16F10 cells were exposed to peptide mixture in the presence of 100 ng/ml α-MSH for 72 h. Melanin content and (C) cellular tyrosinase activity were measured. Two hundreds micromole of arbutin was used as a positive control. Each determination was made in triplicate, and data are shown as means ± standard deviation. MTT, 3-[4,5-dimethylthiazole-2-yl]-2,5-diphenyltetrazolium bromide; α-MSH, alpha-melanocyte-stimulating hormone. *p < 0.05, **p < 0.01 compared to the α-MSH-treated control.
|
Peptide mixture inhibits the expression of melanosome biogenesis/transportation-related factors
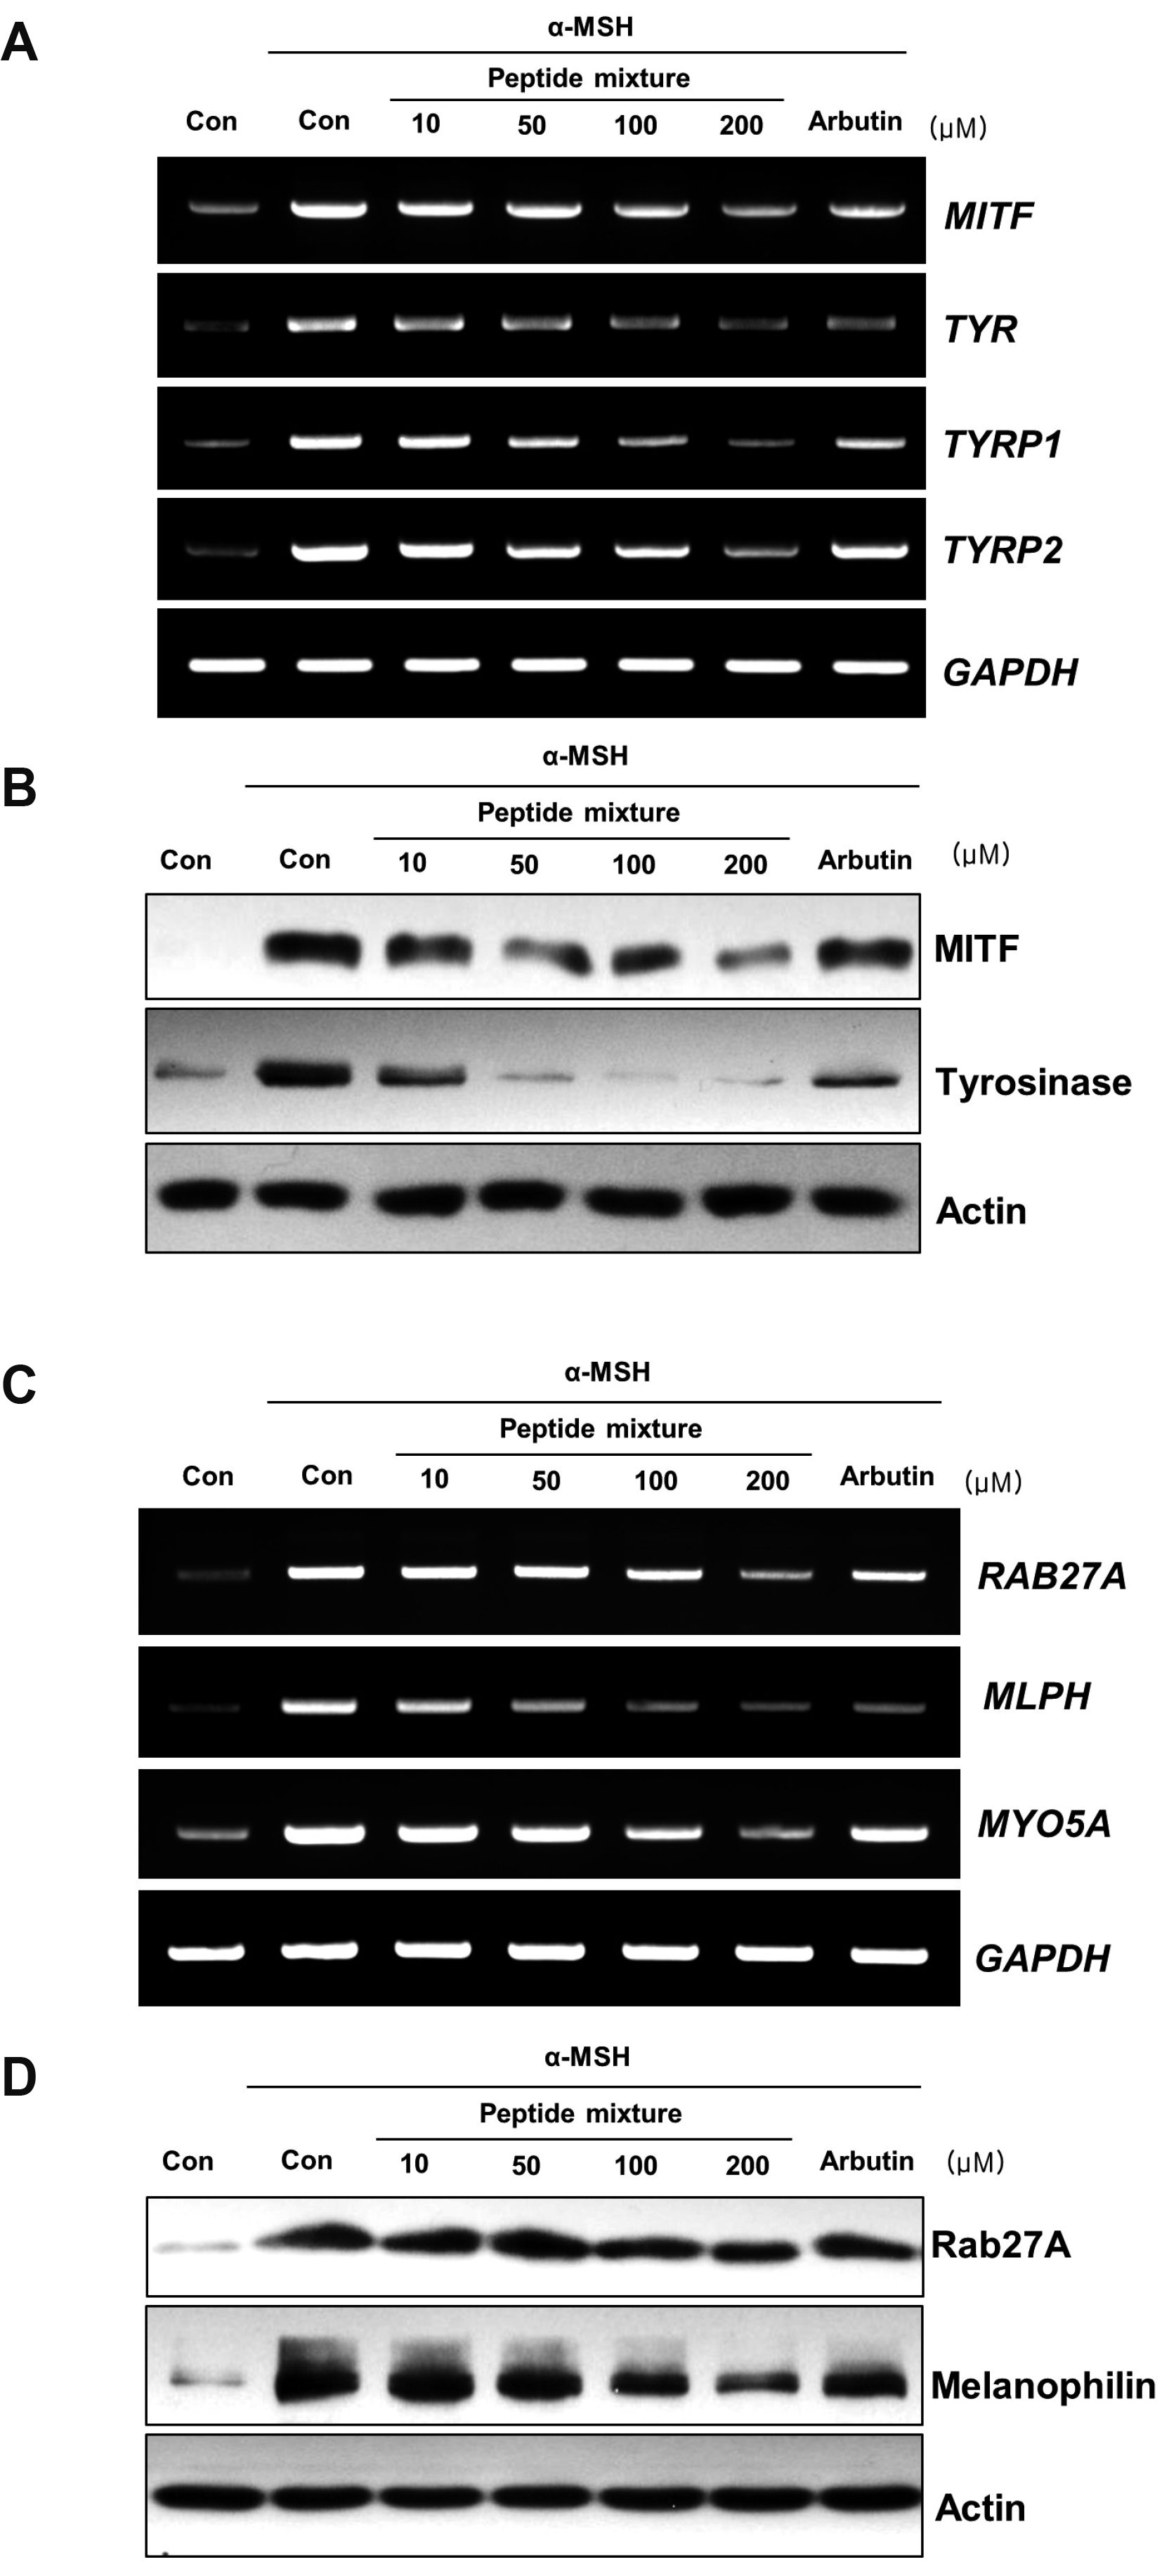 | Fig. 2Effects of the peptide mixture on the expression of melanogenesis-related factors and melanosome transport-related factors.B16F10 cells were exposed to peptide mixture in the presence of 100 ng/ml α-MSH for 72 h. Two hundreds micromole of arbutin was used as a positive control. (A) Expression levels of melanogenesis-related genes including MITF, TYR, TYRP1, and TYRP2 were analyzed by RT-PCR. (B) The protein levels of MITF and tyrosinase were detected using Western blotting. (C) Expression levels of melanosome transport-related genes including RAB27A, MLPH, and MYO5A were analyzed by RT-PCR. (D) The protein levels of Rab27a and melanophilin were detected using Western blotting. α-MSH, alpha-melanocyte-stimulating hormone; MITF, microphthalmia-associated transcription factor; TYRP, tyrosinase-related protein.
|
Peptide mixture inhibits MITF activity through the regulation of CREB and ERK phosphorylation
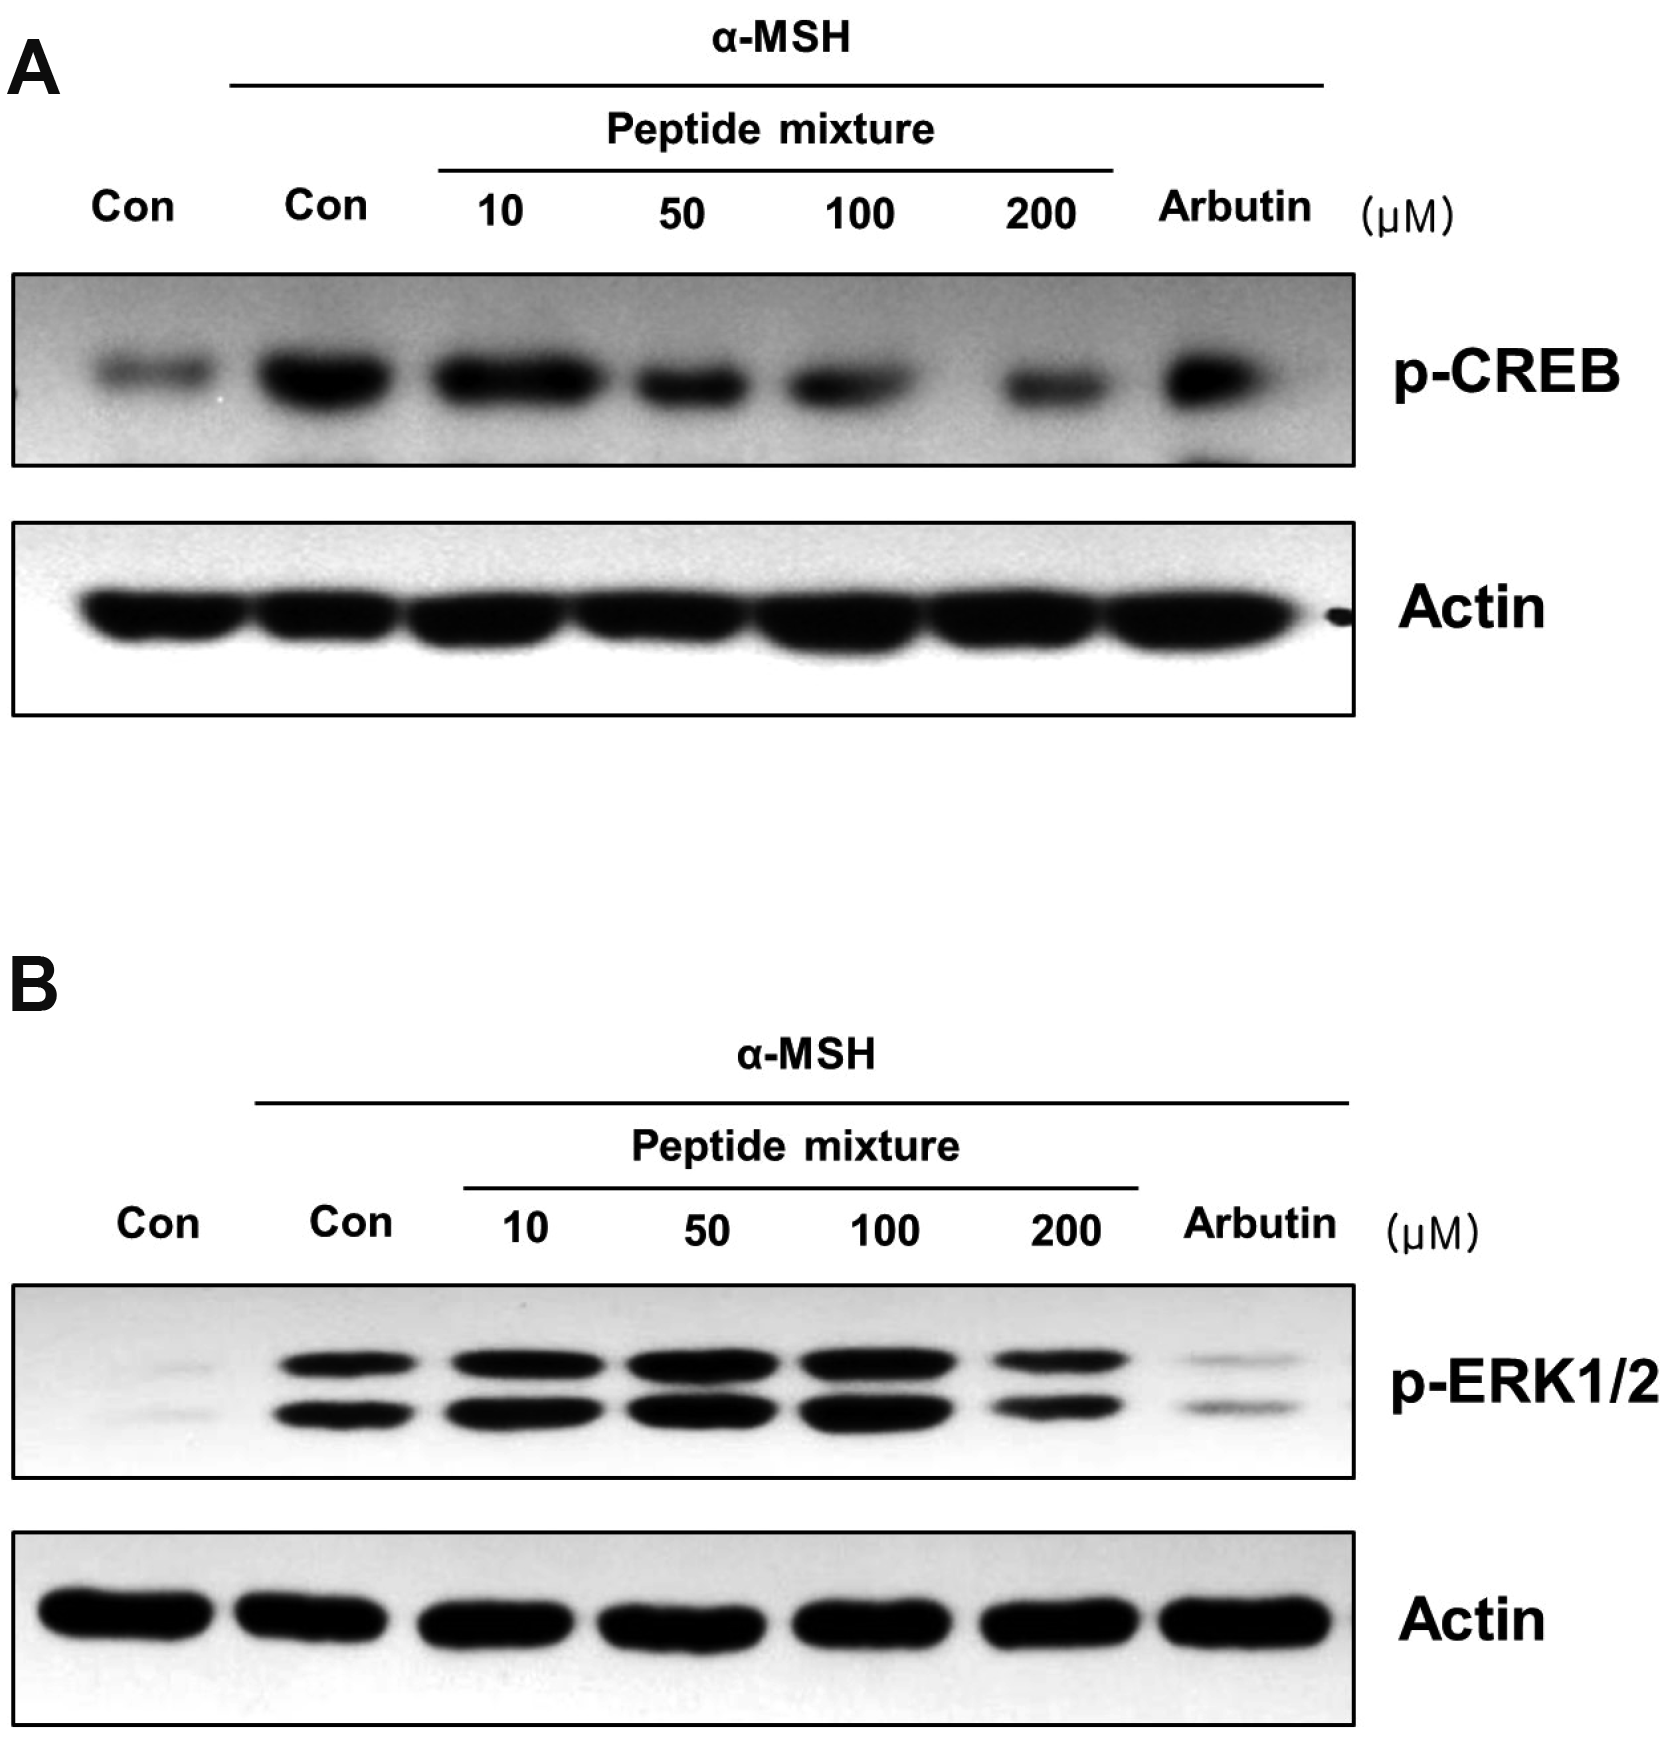 | Fig. 3Effects of the peptide mixture on the phosphorylation level of CREB and ERK.(A) B16F10 cells were exposed to peptide mixture in the presence of 100 ng/ml α-MSH for 30 min. Two hundreds micromole of arbutin was used as a positive control. Phosphorylation level of CREB, a transcriptional factor of MITF, was analyzed by Western blotting. (B) B16F10 cells were exposed to peptide mixture in the presence of 100 ng/ml α-MSH for 10 min. Two hundreds micromole of arbutin was used as a positive control. Phosphorylation level of ERK, a kinase regulates protein stability of MITF, was analyzed by Western blotting. CREB, cAMP responsive element binding protein; α-MSH, alpha-melanocyte-stimulating hormone; MITF, microphthalmia-associated transcription factor.
|
Peptide mixture suppresses melanosome uptake of HaCaT keratinocytes
 | Fig. 4Effects of the peptide mixture on the melanosome uptake of keratinocytes.HaCaT keratinocytes were exposed to peptide mixture for 1 h and additionally incubated with isolated melanosomes for 40 h. (A) After treatment, melanin content was analyzed. Each determination was made in triplicate, and data are shown as means ± standard deviation. *p < 0.05, **p < 0.01 compared to the melanosome-treated control. (B) Fontana-Masson staining was performed to observe the intracellular distribution of melanosomes. (C) HaCaT keratinocytes were pretreated with the peptide mixture for 1 h, cells were additionally incubated with 4U trypsin for 16 h. The expression level of F2RL1 gene was analyzed by RT-PCR.
|
Peptide mixture induces melanosome degradation in HaCaT keratinocytes
 | Fig. 5Effect of the peptide mixture on melanosome degradation in keratinocytes.HaCaT keratinocytes were exposed to isolated melanosomes for 48 h and additionally incubated with peptide mixture for 72 h. One micromole of rapamycin was used as a positive control. (A) After treatment, melanin content was analyzed. Each determination was made in triplicate, and data are shown as means ± standard deviation. *p < 0.05 compared to the melanosome-treated control. (B) Fontana-Masson staining was performed to observe the intracellular distribution of melanosomes. (C) HaCaT keratinocytes were treated with peptide mixture for 3 h and protein levels of Beclin-1, LC3, and p62 were analyzed by western blotting. 200 nM rapamycin was used as a positive control.
|
Peptide mixture showed anti-pigmentation effect in skin equivalent model
 | Fig. 6The whitening effect of the peptide mixture on the skin equivalent.MelanoDerm (MEL-300-B) was topically treated with liposome containing 2,000 μg/ml of peptide mixture three times a week for 2 weeks. (A) Light microscopy was conducted to observe the cell morphology (B) and melanin content was analyzed using extract of equivalent. (C) Paraffin sections were stained with Fontana-Masson to observe the melanosome distribution of the epidermal layers (scale bar = 100 μm). Each determination was made in triplicate, and data shown are means ± standard deviation. *p < 0.05 compared to the untreated control.
|
DISCUSSION
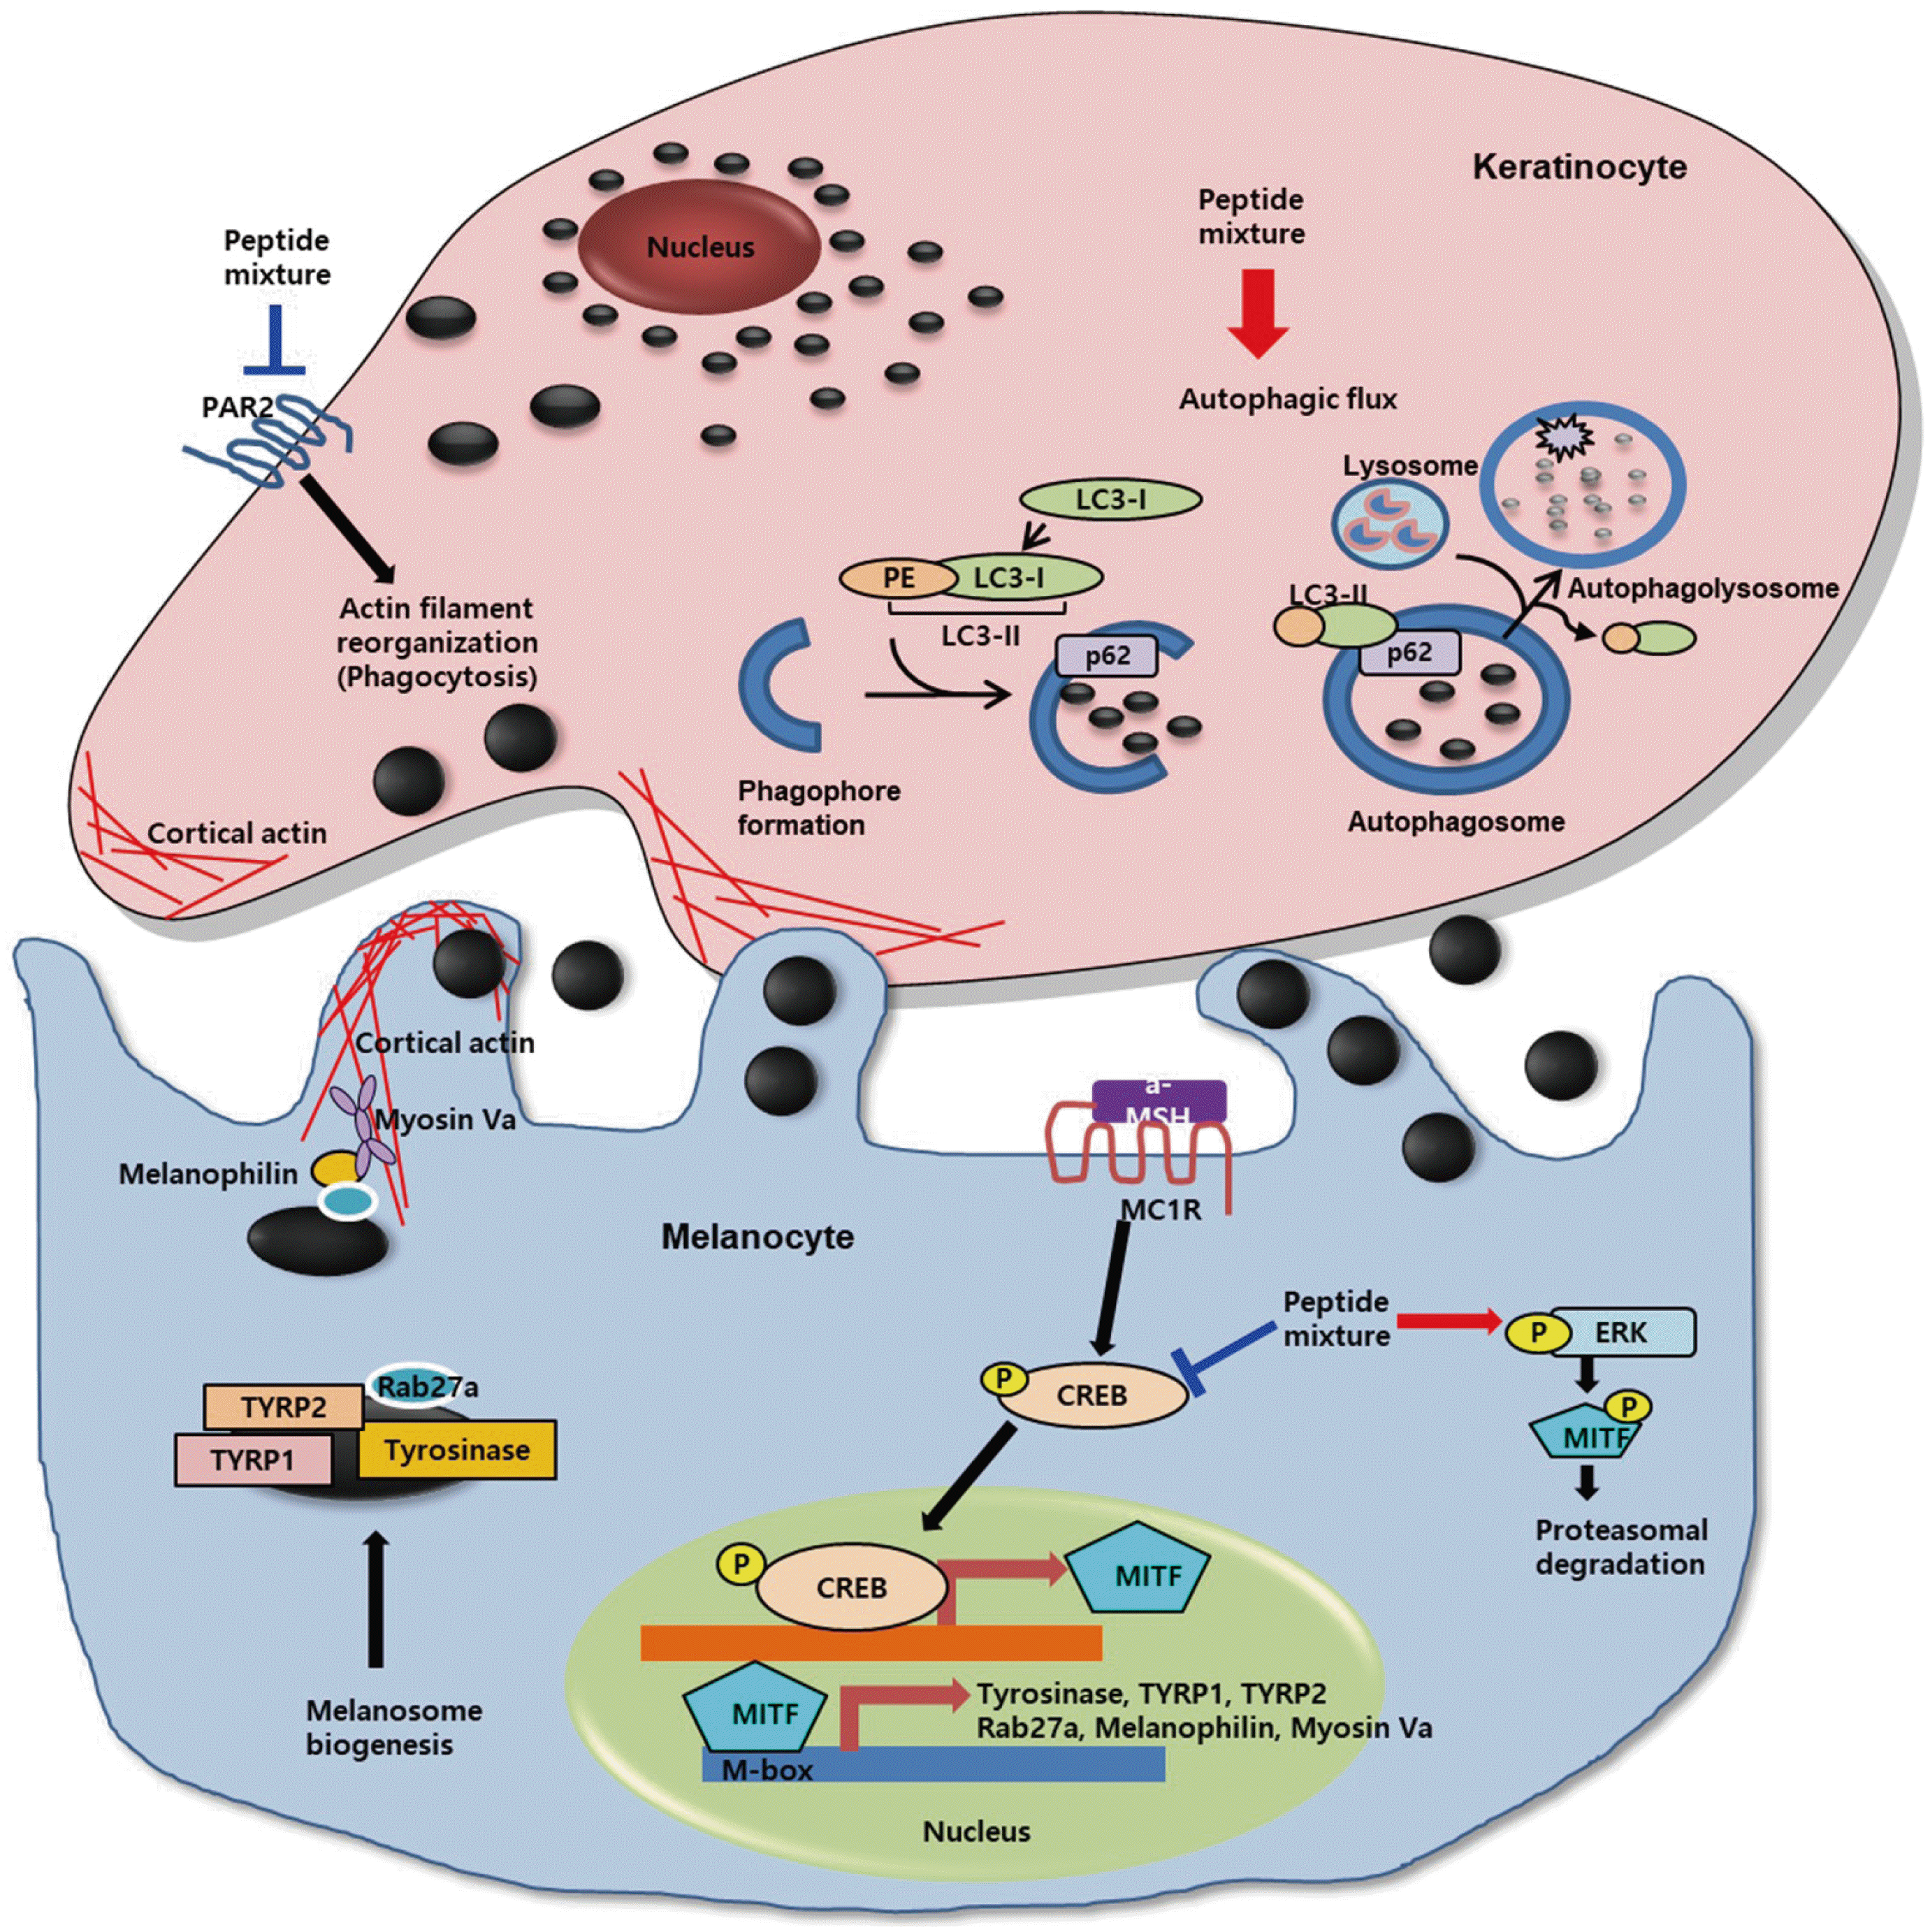 | Fig. 7Schematic diagram showing the mechanism of action of peptide mixture.CREB, cAMP-response-element-binding protein; MITF, microphthalmia-associated transcription factor; TYRP1, tyrosinase-related protein 1; TYRP2, tyrosinase-related protein 2; ERK, extracellular signal regulated kinase; PAR-2, protease activated receptor 2; PE, phosphatidylethanolamine. Arrows indicate positive regulation while T-bars denote inhibitory effects.
|


 PDF
PDF Citation
 Print
Print


 XML Download