

 PDF
PDF Citation
 Print
Print


INTRODUCTION
In the fields of regenerative medicine, the advent of induced pluripotent stem cells (iPSCs) has provided a great advance in overcoming the ethical difficulties of using embryonic stem cells, as well as the tissue-rejection problems in tissue replantation, by generating pluripotent cells from patients’ own cells [1]. However, retroviral vectors, which are used for iPSCs derivation, are randomly integrated into the host genome, thus significantly increasing the risk of cancer by insertional mutagenesis [2-4]. Although several virus-free iPSCs induction protocols have been suggested, they are still less efficient and more technically demanding than viral transduction [5,6]. Considering these limitations of conventional stem cells sources, a more practical alternative approach has been required.
As an up-and-coming strategy, direct reprogramming, also known as direct conversion or trans-differentiation, has received much attention. It can be defined as converting mature somatic cells into other, distinct types of cells directly, bypassing pluripotent stem-cell intermediates [7]; it is based on the principles of cell-fate specification, which can be changed by elimination of pre-existing transcriptional schemes, followed by re-establishment of a new gene regulatory network [8]. Since the first attempt at this method, in which fibroblasts were converted into myoblasts by single transfected cDNA [9], enforced insertion of specific transcription factors or pluripotency-related genes has been widely used as the major tool for cardiomyocytes, neurons, and pancreatic β cells [10,11]. However, this strategy has a very narrow range of applications, because it can be used only if the master regulatory transcription factor for cell-fate specification is already known [12,13]. Also, it has the same safety issues that iPSCs have.
As inferred from the famous Waddington’s epigenetic landscape model [14], the differentiation status and fates of cells can be shifted by epigenetic modification, which can regulate gene expressions and functions by modifying chromatin structure conformation, temporarily and reversibly, without any permanent genomic changes [15,16]. Among epigenetic modifications that are orchestrated by DNA methylation, histone modification, micro RNAs, and cytosine methylation have been relatively intensively studied [17]. Recently, it has been reported that differentiated cells can be converted into some somatic specialized cells, such as insulin-secreting pancreatic β cells and functional osteoblasts, by using a reversible chemical modifier [18,19], which prevents the action of the DNA methyltransferase enzyme that is mostly involved in the CpG site of DNA [20]. However, whether previous protocols suggested can be applicable more extensively to intra- or inter-lineage cell-fate conversion is not clear.
This study investigated whether fully differentiated somatic cells could be directly converted into several specialized types of cell via epigenetic modification, especially by DNA demethylation, without any permanent genetic alterations. This study proposes the possibility of applying patient-specific cell therapy to restore the damaged tissues by using easily obtainable cells, such as fibroblasts. The protocol established by this study will provide a new insight in the field of regenerative medicine.
Go to : 
METHODS
Cell culture and chemical treatment for epigenetic modification
NIH-3T3 fibroblast cell lines established from the primary Swiss albino mouse embryonic fibroblast cells were grown in Dulbecco’s modified Eagle’s medium (DMEM; Gibco BRL, Gaithersburg, MD, USA) supplemented with 10% fetal bovine serum (FBS; Gibco BRL) and 1% penicillin-streptomycin (Gibco BRL). When the cell confluency reached about 50%, cells were treated with various concentrations of 5-aza-CN (Sigma-Aldrich Co., St. Louis, MO, USA) for 24 h.
Quantification of global DNA methylation
Global DNA-methylation analysis was conducted using a MethylFlash Methylated DNA Quantification kit (Epigentek, Farming-dale, NY, USA), according to the manufacturer’s instructions. Briefly, Genomic DNA was isolated from cells treated with 5-aza-CN for 24 h by a genomic DNA isolation kit (Qiagen, Valencia, CA, USA); 100–200 ng of genomic DNA was used to quantify methylated DNA colorimetrically. The relative percentage of methylated DNA was quantified using a formula provided by the manufacturer.
Cellular differentiation
For cellular differentiation, cells were treated with or without 5-aza-CN for 24 h, then washed with growth media and replaced in a proper differentiation medium. For osteoblastic induction, we replaced them into DMEM supplemented 2% FBS containing 170 μM ascorbic acid 2-phosphate (AA; Sigma-Aldrich), 5 mM β-Glycerophosphate (β-GP; Sigma-Aldrich) and 200 ng/ml BMP2 (R&D Systems, Minneapolis, MN, USA). For adipogenic differentiation, the media were changed to DMEM supplemented 2% FBS with 0.5 mM 3-isobutyl-1-methylxanthine (IBMX) (Sigma-Aldrich), 1 μM dexamethasone (DEX) (Sigma-Aldrich), 100 μM Indomethacin (Sigma-Aldrich), and 10 μg/ml Insulin (Sigma-Aldrich). For chondrogenic differentiation, the media were changed to chondrogenic differentiation media (Gibco BRL). For neurogenic differentiation, the cells were induced by culturing in DMEM supplemented 2% FBS, 2% dimethyl sulfoxide (Sigma-Aldrich), 100 μM butylated hydroxyanisole (Sigma-Aldrich). All cell differentiation media were changed every other day.
Reverse transcriptase-polymerase chain reaction (RT-PCR) and real time quantitative RT-PCR (RT-qPCR)
The total RNA was extracted using Trizol Reagent (Gibco BRL). RT was conducted with a RT system containing Moloney Murine Leukemia Virus reverse transcriptase (Promega, Madison, WI, USA). Conventional PCR was performed on a Palm Cycler thermocycler (Corbett Life Science, Sydney, Australia) and products were resolved on a 1.5% agarose gel. Real time RT-PCR was run on a Rotor-Gene RG-3000 (Corbett Life Science) using the SYBR Green PCR Master Mix Reagent kit (Qiagen). Ratios of the intensities of the target genes and β-actin, an internal control, were used as a relative measure of the target gene expression. The mean fold change of expression in the experimental group compared with the control group was calculated using the 2–∆∆ct method, and the range of the fold changes was calculated from the standard error of the values. To ensure experimental accuracy, real-time RT-PCR assays were conducted in triplicate for each sample. Primer sequences and product sizes are defined in Table 1.
Table 1
Oligonucleotide sequences of primers
SOX2, sex determining region Y(SRY)-box 2; KLF4, Krüppel-like factor 4; OCT4, octamer-binding transcription factor 4; ALP, alkaline phosphatase; BSP, bone sialoprotein; OCN, osteocalcin; OPN, osteopontin; RUNX2, Runt-related transcription factor 2; OSX, osterix; AP2, adipocyte protein 2; C/EBP, CCAAT-enhancer-binding proteins; PPARG, peroxisome proliferator-activated receptor gamma; ACAN, aggrecan; COL2, type II collagen; SOX9, SRY-box 9; NFM, neurofilament medium.
![]()
Western blot analysis
Proteins were extracted with a lysis buffer (Cell Signaling Technology, Danvers, MA, USA) and quantified using the bicinchonic acid protein (BCA) protein-assay reagent (Bio-Rad Laboratories, Hercules, CA, USA). Proteins were resolved by 8% sodium dodecyl sulfate polyacrylamide gel electrophoresis (SDS-PAGE) and transferred to a polyvinylidene fluoride (PVDF) membrane (Whatman GmbH, Dassel, Germany). After blocking in Tris-buffered saline with 5% milk and 0.1% Tween-20, the membrane was incubated with the neurofilament medium (NFM) antibody (Biolegend, San Diego, CA, USA) or Nestin antibody (Abcam, Beverly, MA, USA). The mouse monoclonal primary antibody to β-actin (Sigma-Aldrich) was used as the reference. Signals were visualized using an enhanced chemiluminescence reagent (ECL; Santa Cruz Biotechnology, Santa Cruz, CA, USA) in Image Reader LAS-4000 software (Fujifilm, Tokyo, Japan).
Flow cytometry analysis
Cells were split by 0.2% ethylenediaminetetraacetic acid (EDTA) in PBS. For intracellular markers, cells were fixed and permeabilized with 90% ice-cold methanol for 30 min and treated with Fc block (anti-FcgRII/III) to prevent nonspecific binding for 15 min. Indirect staining was done with primary and secondary antibodies on each step. Stained cells were analyzed on FACScan (BD Biosciences, Mountain View, CA, USA). FACS data was quantified by mean fluorescence intensity (MFI). The arithmetic mean was used in the computation of the MFI. The following antibodies and their corresponding isotype controls were used; Antibody against cluster of differentiation 146 (CD146) and octamer-binding transcription factor 4 (OCT4) was purchase from Santa Cruz Biotechnology and antibodies against mouse IgG1 and IgG2b for κ Isotype control from Biolegend.
Immunofluorescence staining
After 14 days of neuronal differentiation, cells were fixed with 10% neutral formalin for 24 h and immunofluorescence staining was done using the tyramide signal amplification (TSA) Kit (Invitrogen, Carlsbad, CA, USA). Briefly, after blocking endogenous peroxidase, cells were reacted with the NFM antibody (Biolegend) overnight and subsequently with the horseradish peroxidase (HRP)-conjugated secondary antibody (Cell Signaling Technology). Cells were incubated in Alexa Fluor 488 tyramide solution (Thermo Fisher Scientific, Waltham, MA, USA) and then counterstained with propidium iodide (Thermo Fisher Scientific). Cells were photographed using an LSM confocal microscope (Carl Zeiss, Oberkochen, Germany).
Cell staining
For alkaline phosphatase (ALP) enzyme staining, cells were fixed with 4% formaldehyde, rinsed three times with deionized water, and treated with a 5-bromo-4-chloro-3-indolyl-phosphate (BCIP)/nitro blue tetrazolium (NBT) solution (Sigma-Aldrich) for 15 min. The reaction was stopped by the addition of water, and the stains were photographed and quantified by Scion Image software (Scion Corporation, Frederick, MD, USA). To evaluate mineralization, Alizarin Red S staining was applied. Briefly, cells were fixed with 70% ethanol and then stained with 40 mM Alizarin Red S (pH 4.2) (Sigma-Aldrich) solution for 10 min. After extraction with 10% cetylpyridinium chloride (Sigma-Aldrich), the stain was quantified by measuring the absorbance at 570 nm.
Oil Red O staining is performed to evaluate adipogenic differentiation. Cells were fixed with 10% formalin for 30 min and washed with PBS, then were stained with 0.5% Oil Red O solution (Sigma-Aldrich) for 30 min, washed with deionized water, and photographed. The images of stained cells were acquired using an inverted contrast-phase microscope (Olympus Corporation, Tokyo, Japan).
To evaluate chondrogenic differentiation, Alcian blue staining was used. Briefly, cells were fixed with 4% formaldehyde, washed with deionized water, and stained with a 1% Alcian blue (pH 2.5) (Sigma-Aldrich) solution for 30 min. Stained cells were washed with deionized water and photographed.
Statistical analysis
Data are expressed as means ± standard errors. Statistical analysis was carried out using the analysis of variance (ANOVA) software (Analyse-it Software Ltd., Leeds, WY, UK). Results were considered significant at a probability level of p < 0.05. For all experiments, at least three independent trials were performed.
Go to :
RESULTS
Transient DNA demethylation by 5-aza-CN induced epigenetic modification in NIH-3T3 fibroblasts
Epigenetic changes in DNA methylation affects the differentiation potential of cells. To induce epigenetic modification in NIH-3T3 fibroblasts, we used 5-aza-CN, a DNA methyltransferase inhibitor, which is well known to cause DNA demethylation. First of all, in order to evaluate the capacity of 5-aza-CN to transform cell phenotypes, morphological changes of NIH-3T3 fibroblasts were examined under an inverted microscope. Exposure to 5 μM 5-aza-CN for 24 h led standard elongated fibroblasts to display shortening and shrinking phenotypes, which were restored efficiently to their initial shape by an additional 24 h culture in fresh medium without 5-aza-CN (Fig. 1A). Next, we examined the effect of 5-aza-CN on DNA demethylation of NIH-3T3 fibroblasts, which were treated at the indicated concentrations of 5-aza-CN for 24 h and then global DNA methylation status were assessed. As shown in Fig. 1B, methylated DNA was significantly decreased in a dose-dependent manner. Finally, we assessed the multi-lineage differentiation potential of 5-aza-CN-treated NIH-3T3 fibroblasts by evaluating the relative gene expression levels of the stem cell markers, such as (sex determining region Y[SRY]-box 2) (SOX2), Krüppel-like factor 4 (KLF4), NANOG, and OCT4, which are transcription factors that is essential maintaining in self-renewal, or pluripotency, of undifferentiated embryonic stem cells [21]. Expression of these markers was increased clearly, and the expression changes of CD146, a mesenchymal stem cell marker [22] and OCT4 protein in 5-aza-CN-treated NIH-3T3 fibroblasts were also observed in flow cytometry analysis (Fig. 1C and D). MFI of CD146 has increased significantly from 0.74 to 3.54, while the value of OCT4 has slightly changed.
 | Fig. 1Epigenetic modification in 5-azacytidine (5-aza-CN)-treated NIH-3T3 cells.(A) After 24 h of 5 μM 5-aza-CN treatment, morphologic changes of cells were observed under an inverted microscope. (a) Untreated; (b) 5-aza-CN-treated; (c) incubated in fresh media without 5-aza-CN for an additional 24 h after treatment with 5-aza-CN. (B) After treatment at the indicated concentrations of 5-aza-CN for 24 h, the global DNA methylation patterns determined by using a methylated DNA quantification kit. (C) The expression of pluripotent stem cell markers such as SOX2, KLF4, NANOG and OCT4 genes was examined by conventional (left) and quantitative RT-PCR (RT-qPCR, right) with or without 5 μM 5-aza-CN for 24 h. (D) The protein expression of CD146, mesenchymal stem cell marker and OCT4 was analyzed by flow cytometry with or without 5 μM 5-aza-CN for 24 h, and quantified to a mean fluorescent intensity (MFI) value. Control (Ctrl) means untreated. These data represent three independent experiments. The values shown represent means ± standard errors. SOX2, sex determining region Y(SRY)-box 2; KLF4, Krüppel-like factor 4; OCT4, octamer-binding transcription factor 4. *p < 0.05.
|
Transient DNA demethylation by 5-aza-CN allowed the conversion of NIH-3T3 fibroblasts into mesenchymal lineage cells
In order to evaluate the differentiation potential, brief exposure of NIH-3T3 fibroblasts to 5-aza-CN was followed by the procedure illustrated in Fig. 2A. For conversion into mesenchymal lineage cells, 5-aza-CN-treated NIH-3T3 fibroblasts were incubated with specific defined differentiation media containing 200 ng/ml BMP2. As shown in Fig. 2B, BMP2 markedly increased the mRNA of osteogenic key molecules, such as ALP, osteopontin (OPN), osteocalcin (OCN), bone sialoprotein (BSP) which are major non-collagenous proteins in bone matrix, and Runt-related transcription factor 2 (RUNX2) and osterix (OSX), which are essential transcription factors for osteoblast differentiation [23], in 5-aza-CN-treated NIH-3T3 fibroblasts cultured with osteogenic medium. Furthermore, the density of ALP and AR-S staining performed to investigate early osteogenic differentiation and mineral nodule formation, respectively, were increased significantly in the group treated with both 5-aza-CN and BMP2 (Fig. 2C and D). Next, the 5-aza-CN-treated NIH-3T3 fibroblasts expressed effectively adipogenic marker genes, such as adipocyte protein 2 (AP2) which is a carrier protein for fatty acid, and CCAAT-enhancer-binding proteins (C/EBP) and peroxisome proliferator-activated receptor gamma (PPARG) which are key transcription factors for adipocyte differentiation [24], and vigorously formed oil droplets in a specific adipogenic medium containing BMP2 compared to control (Fig. 3A and B). Finally, in chondrogenic media, BMP2 induced chondrogenic differentiation of 5-aza-CN-treated NIH-3T3 fibroblasts, which significantly increased the expression of chondrogenic markers such as aggrecan (ACAN) and type II collagen (COL2) which are major matrix proteins of cartilaginous tissue, and SRY-box 9 (SOX9) which is essential transcription factor for differentiation of precursors cells into chondrocyte [25], as well as proteoglycan stained by Alcian blue was significantly increased (Fig. 3C and D). These results indicate that 5-aza-CN-treated NIH-3T3 fibroblasts can be converted to desired mesenchymal lineage cells capable of specific matrix formation if it is properly induced.
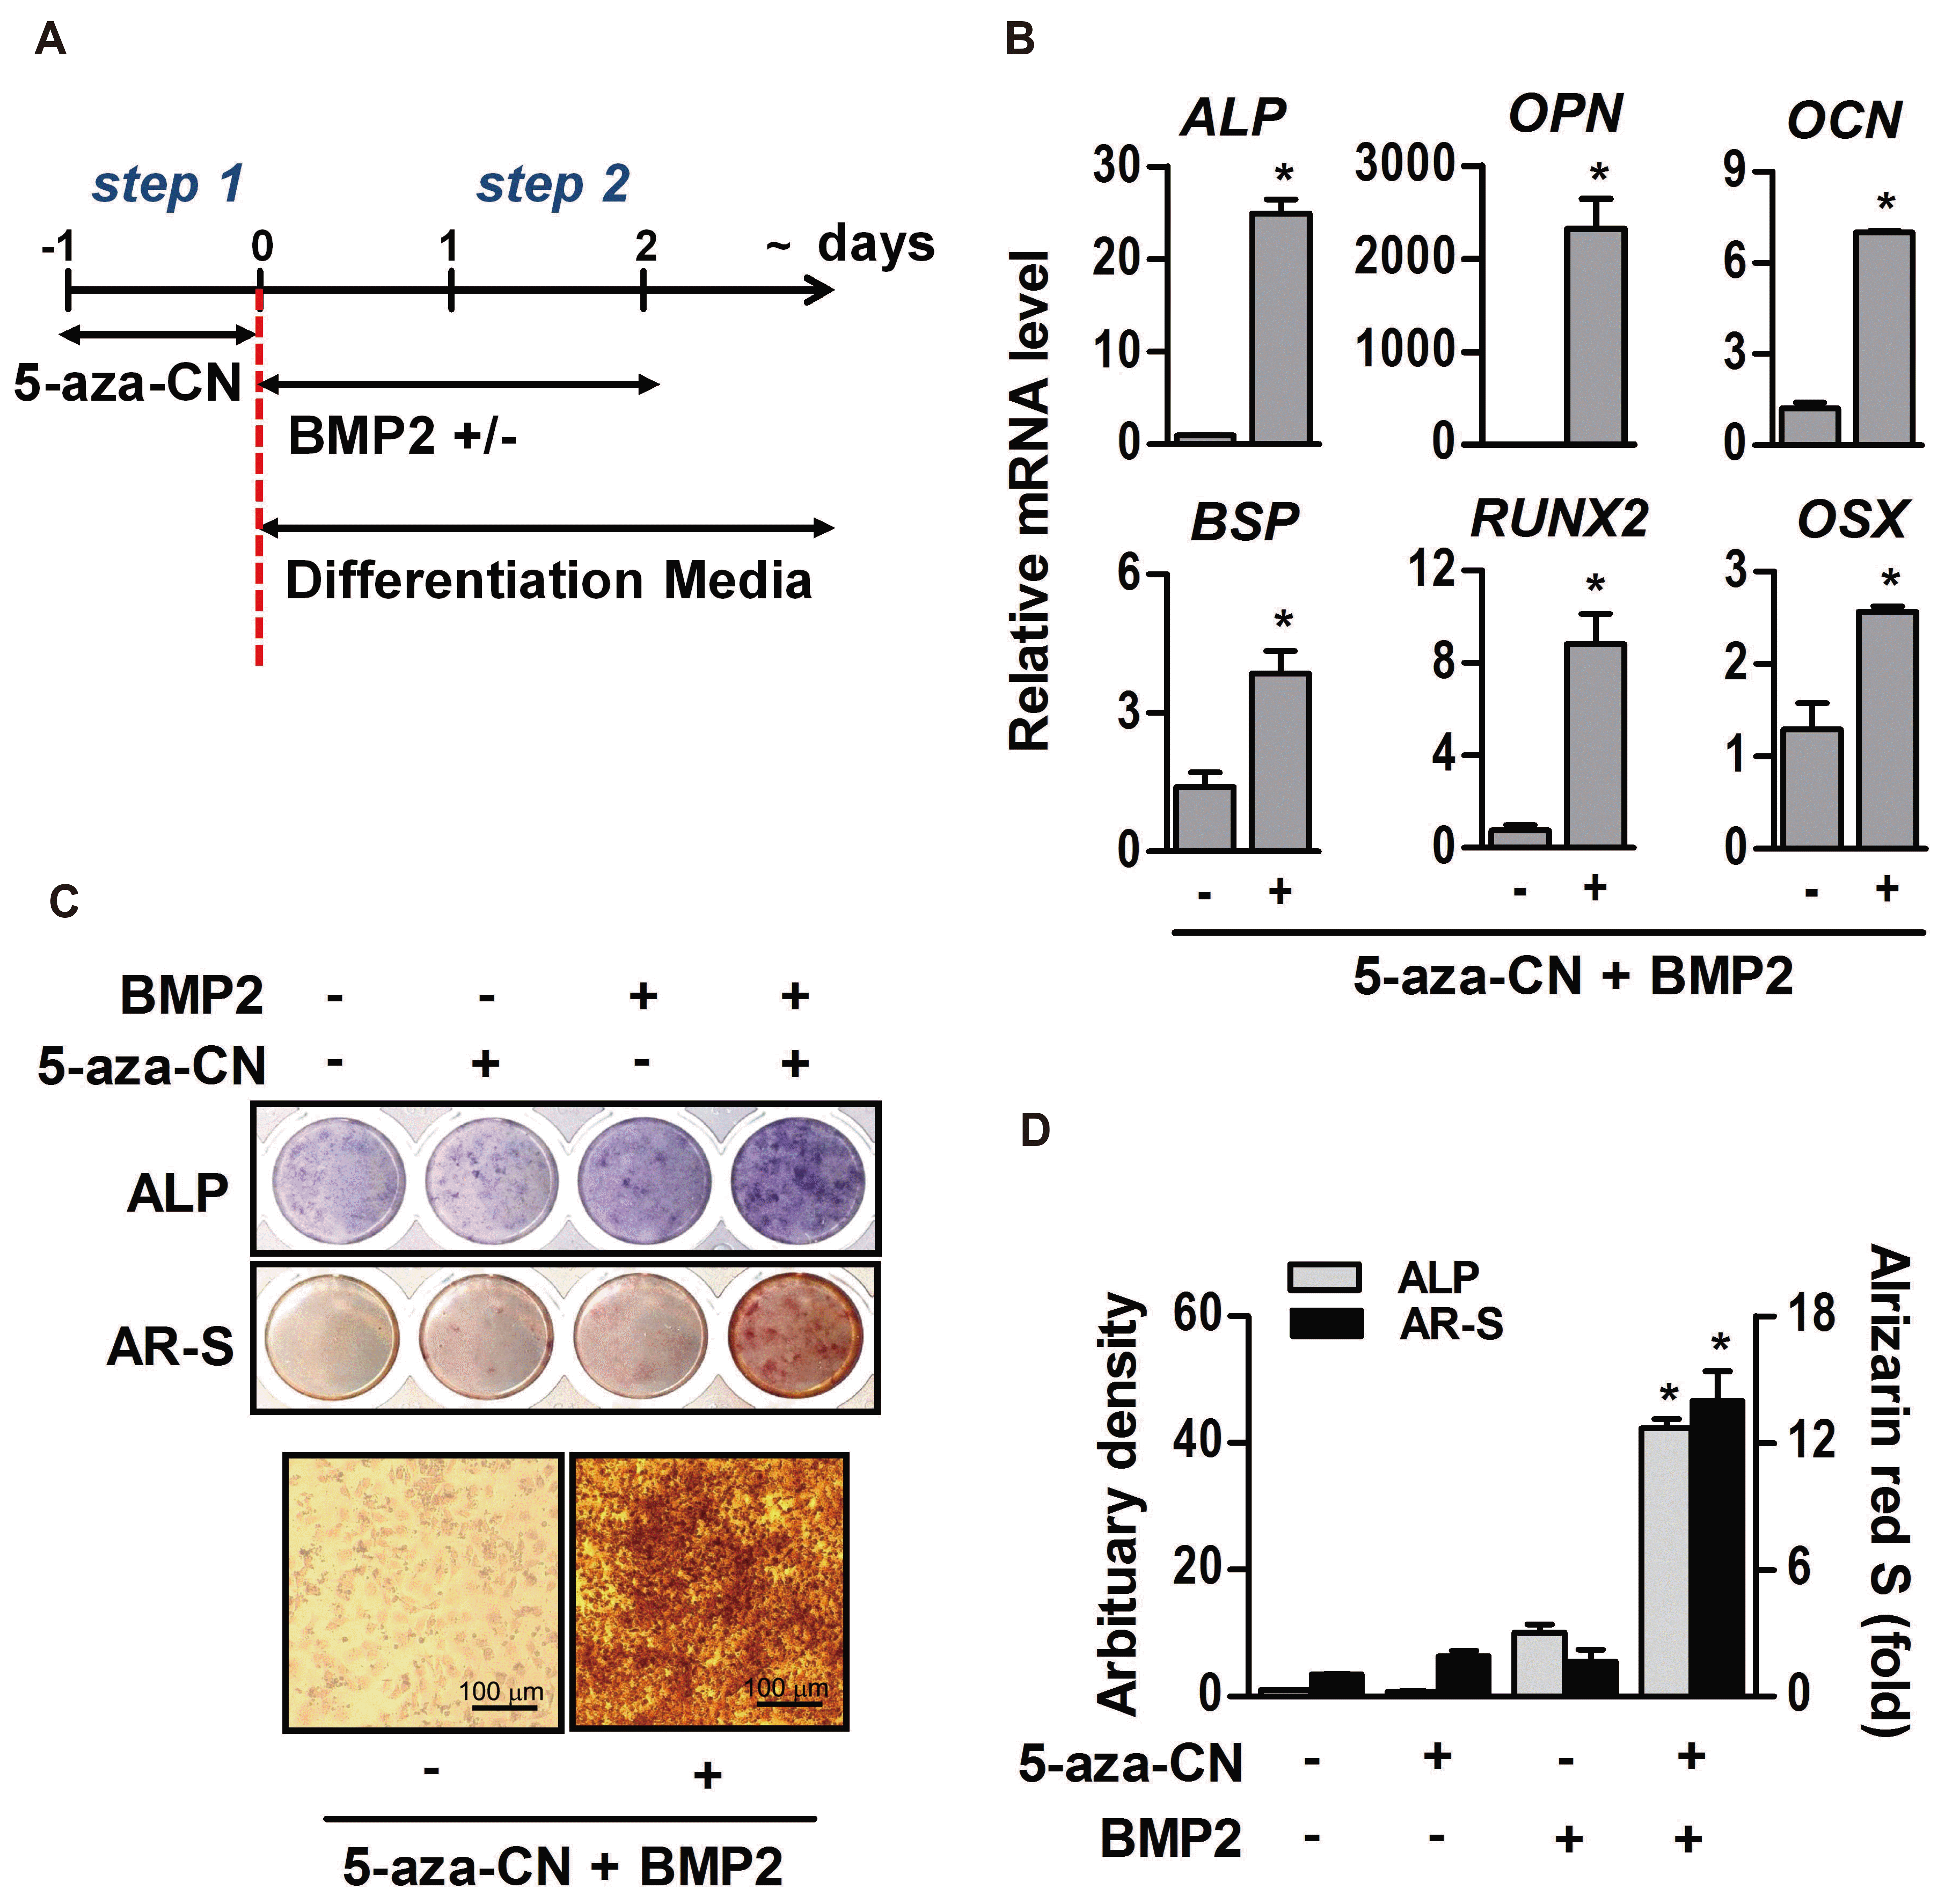 | Fig. 2Osteogenic differentiation of 5-azacytidine (5-aza-CN)-treated NIH-3T3 cells.(A) The schematic diagram of this study is based on direct reprogramming principles. After 7 days culture in osteogenic differentiation medium (DMEM supplemented 2% FBS containing 170 μM AA, 5 mM β-GP and 200 ng/ml BMP2), expression of osteogenic marker genes such as alkaline phosphatase (ALP), osteopontin (OPN), osteocalcin (OCN), bone sialoprotein (BSP), Runt-related transcription factor 2 (RUNX2) and osterix (OSX) in 5 μM 5-aza-CN-treated NIH-3T3 cells was determined by RT-qPCR (B), and osteogenic differentiation of 5-aza-CN-treated NIH-3T3 was verified by ALP and alizarin red S (AR-S) staining on days 7 and 14, respectively (C). High magnification images of AR-S staining are shown in the lower panel. (D) Densities of ALP stain were quantified by Scion Image software. AR-S stain was extracted with 10% cetylpyridinium chloride and quantified by measuring the absorbance at 570 nm using an ELISA reader. These data represent three independent experiments. The values shown represent means ± standard errors. *p < 0.05.
|
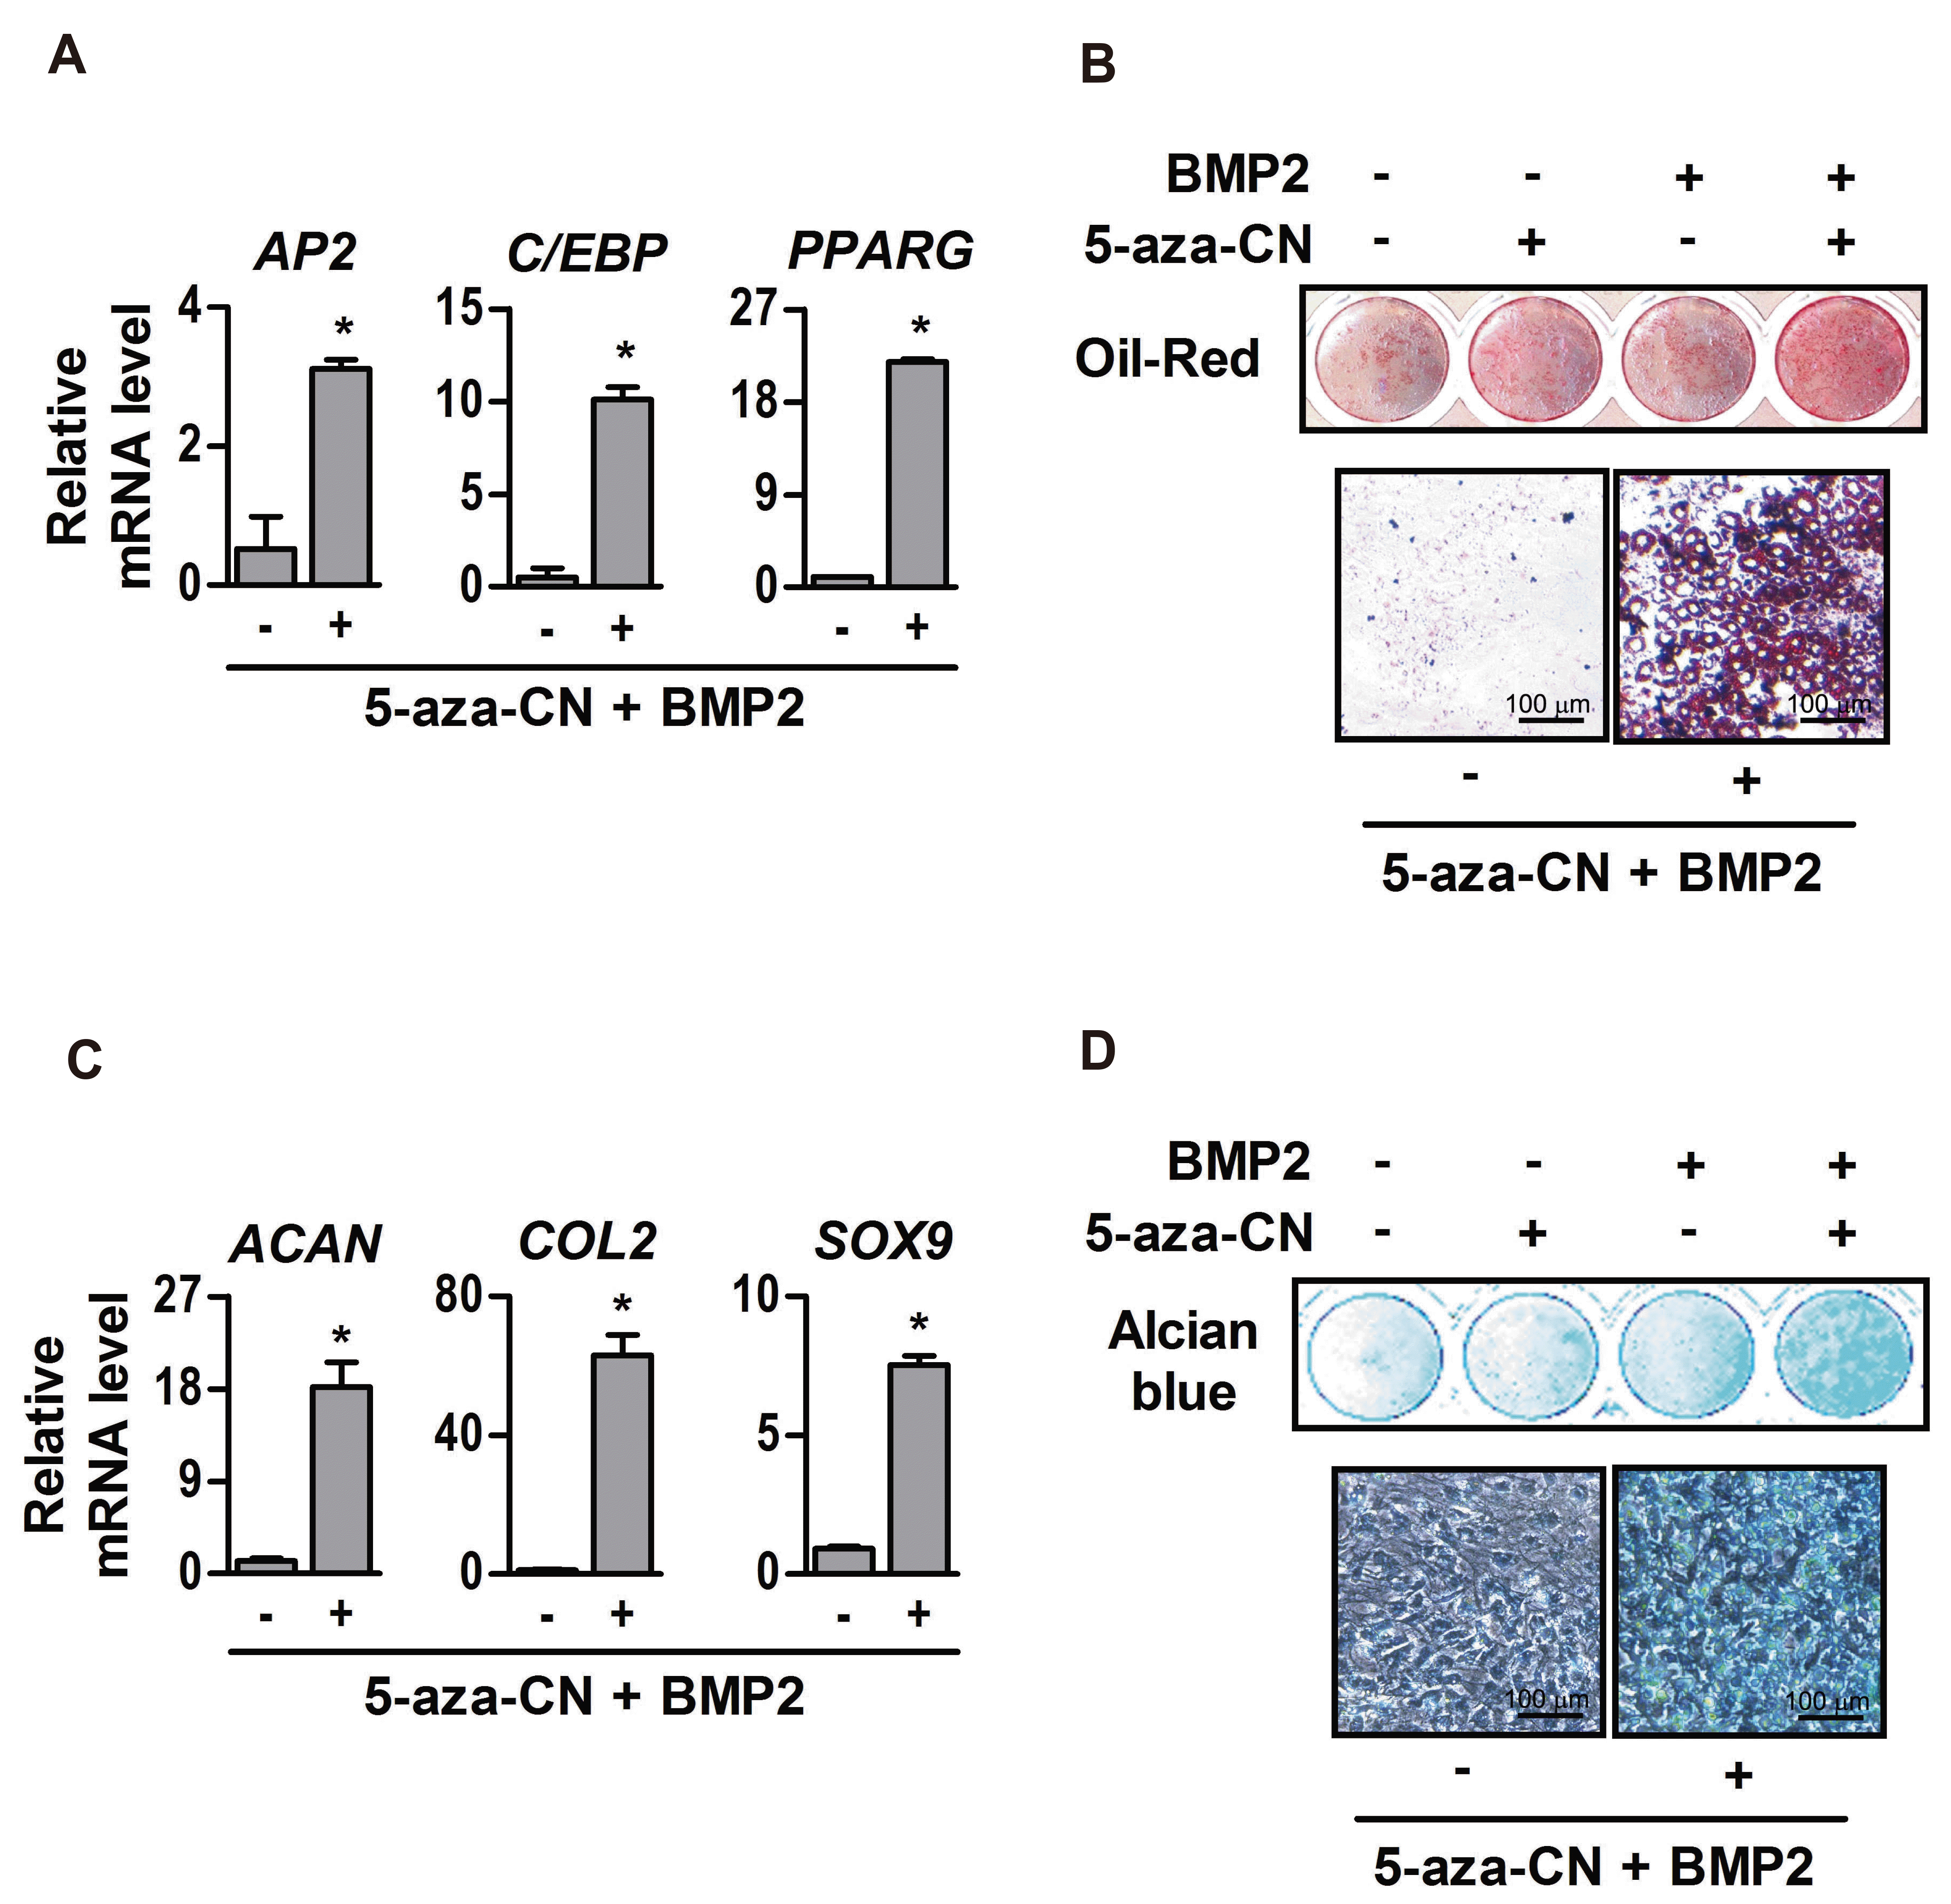 | Fig. 3Adipogenic and chondrogenic differentiation of 5-azacytidine (5-aza-CN)-treated NIH-3T3 cells.(A) After 7 days culture in adipogenic differentiation medium containing DMEM supplemented 2% FBS with 0.5 mM IBMX, 1 μM DEX, 100 μM, 10 μg/ml insulin and 200 ng/ml BMP2, expression of adipogenic marker genes such as adipocyte protein 2 (AP2), CCAAT-enhancer-binding proteins (C/EBP), peroxisome proliferator-activated receptor gamma (PPARG) in 5 μM 5-aza-CN-treated NIH-3T3 cells was quantified by RT-qPCR. (B) The lipid droplet formations were observed by Oil-Red O staining on day 14 and high magnification images of Oil-Red O staining are shown in the lower panel. (C) After 7 days of chondrogenic differentiation medium culture, expression of chondrogenic marker genes such as aggrecan (ACAN), type II collagen (COL2), SRY-box 9 (SOX9) in 5 μM 5-aza-CN-treated NIH-3T3 cells was quantified by RT-qPCR. (D) The chondrogenic matrix formation was observed by Alcian blue staining on day 14 and high magnification images of Alcian blue staining are shown in the lower panel. These data represent three independent experiments. The values shown represent means ± standard errors. *p < 0.05.
|
Transient DNA demethylation by 5-aza-CN allowed the conversion of NIH-3T3 fibroblasts into neuronal cells
After epigenetic modification, NIH-3T3 fibroblasts were incubated with a defined neurogenic medium to evaluate the neurogenic potential. As shown in Fig. 4A and B, mRNA and protein of Nestin and NFM which are intermediate filament proteins expressed in nerve cells [26], were clearly increased in 5-aza-CN-treated NIH-3T3 fibroblasts. Fig. 4C shows the morphologic changes of neurogenic differentiated NIH-3T3 fibroblasts, which have an expanded cytoplasm and elongated axon-like pod as well as an increase of NFM protein in the cell cytoplasm. In contrast, control cells showed no morphological changes or NFM protein.
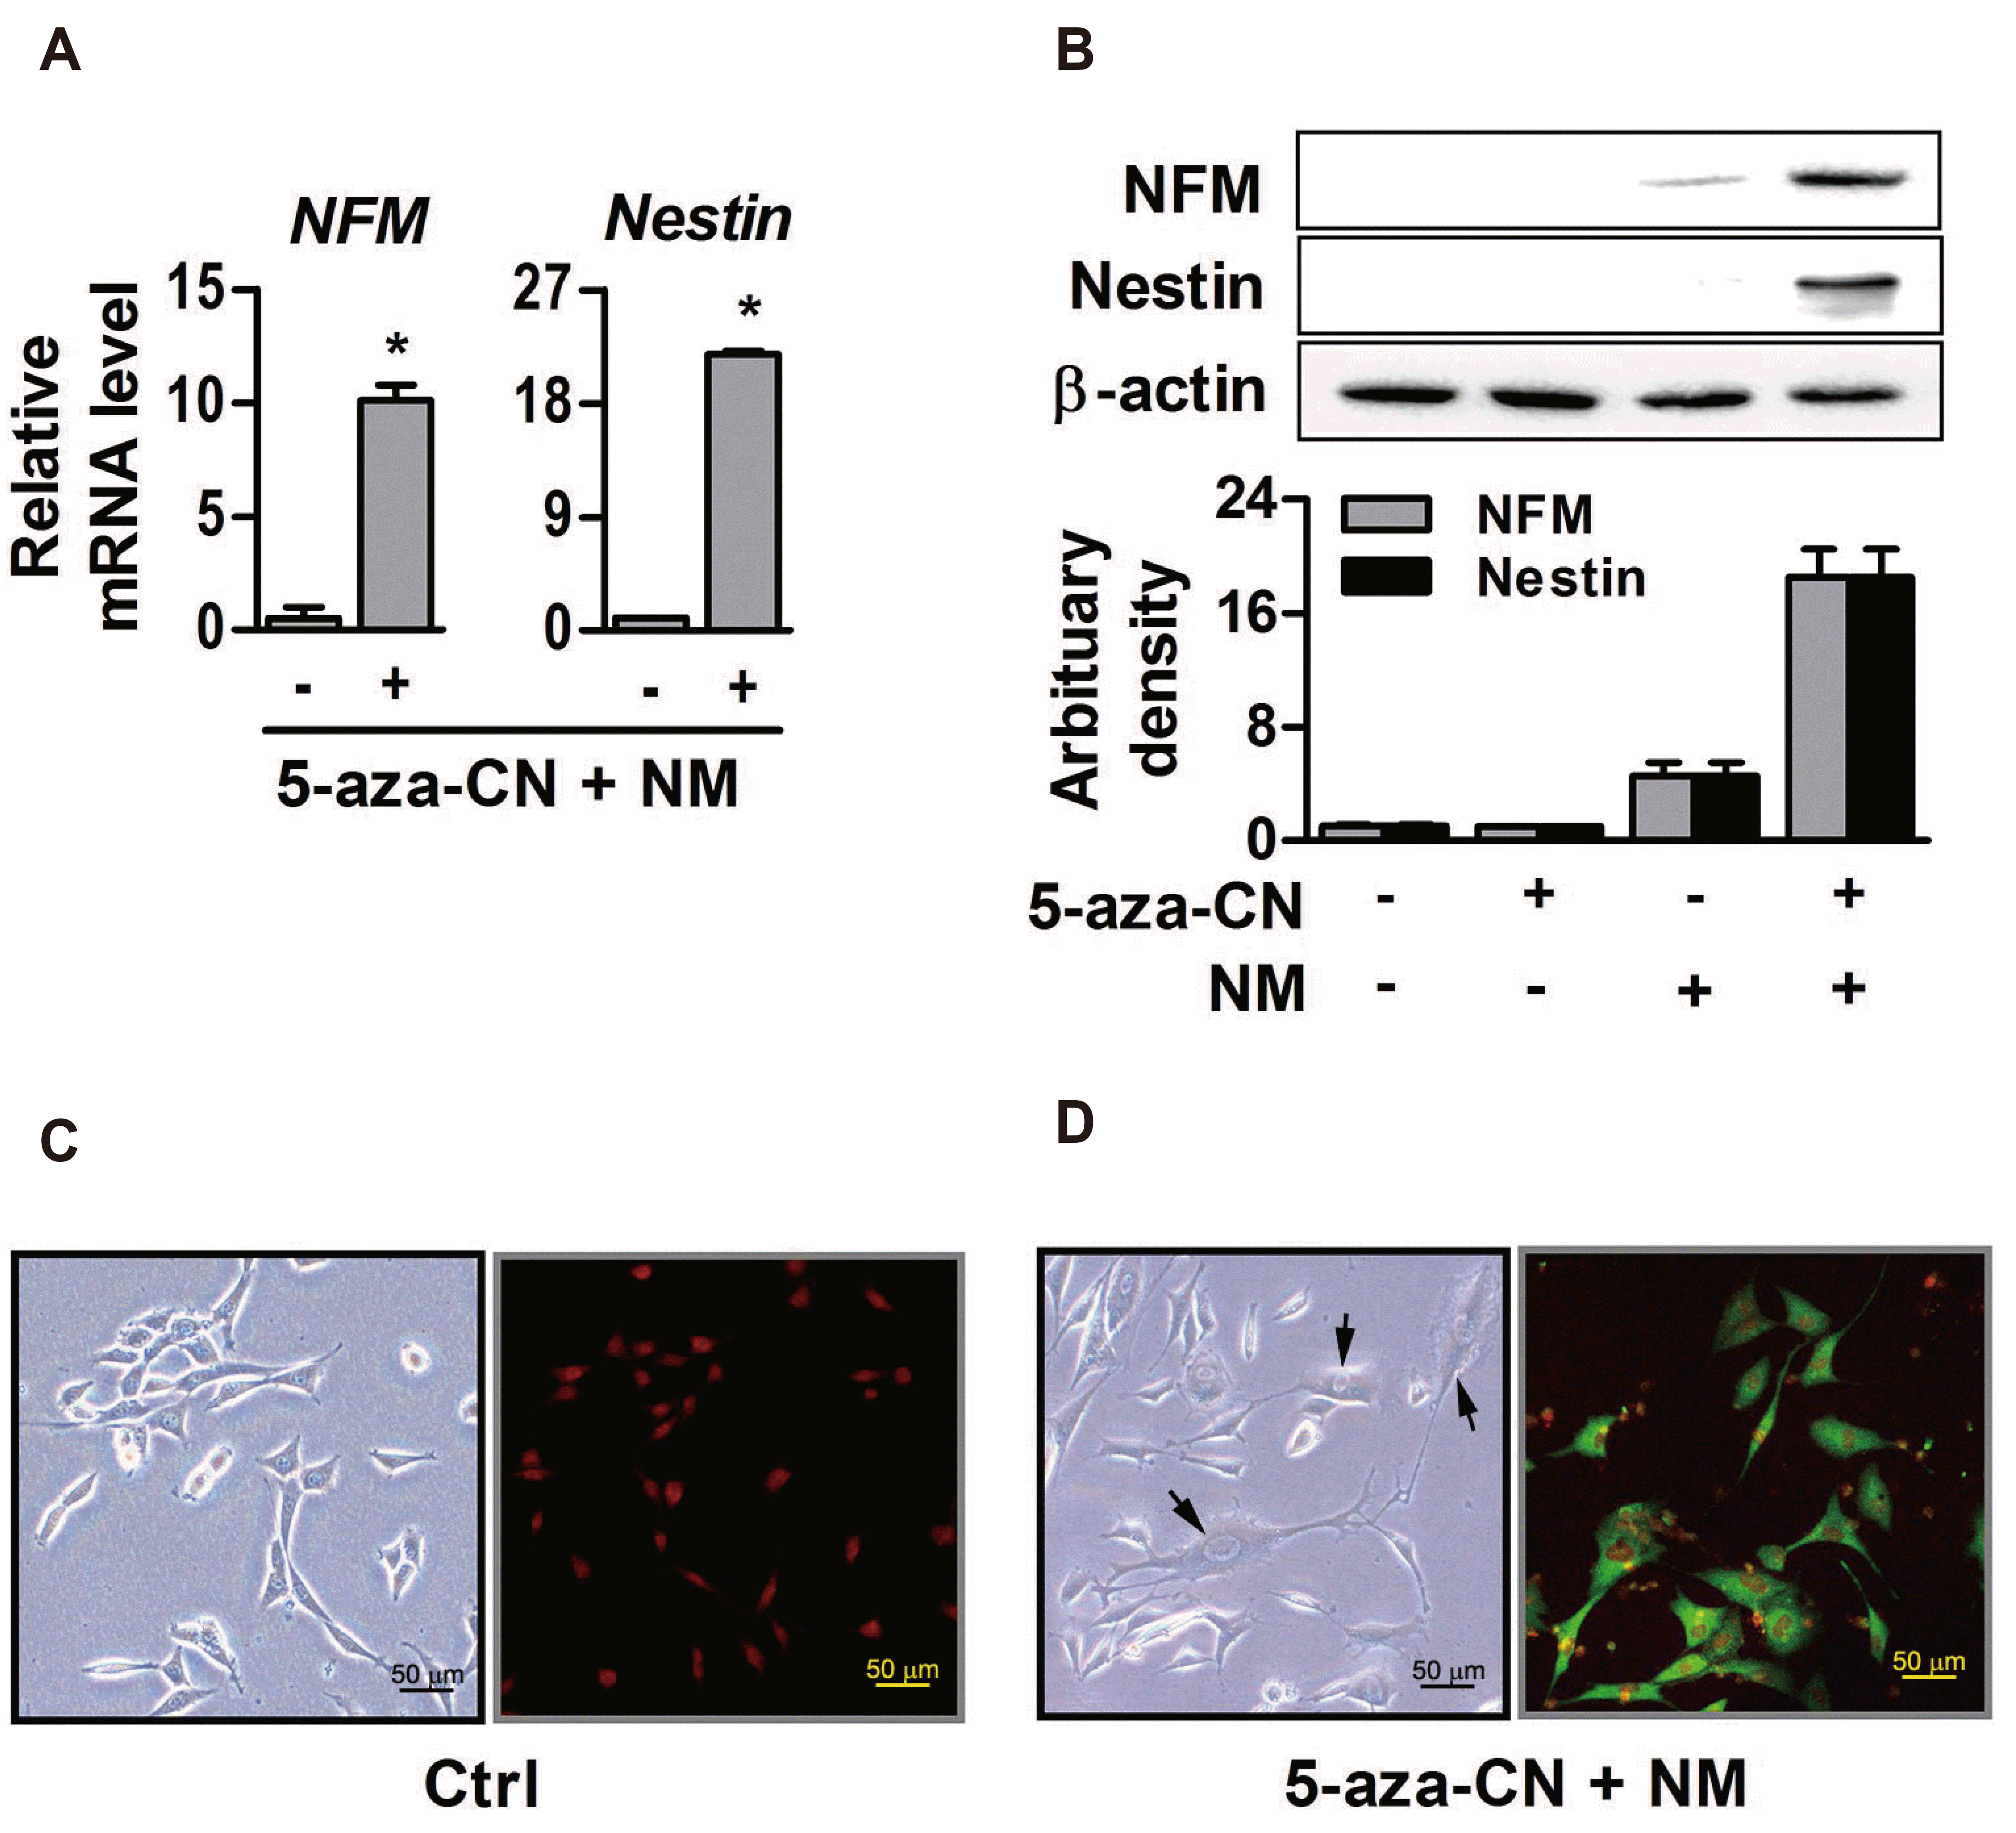 | Fig. 4Neurogenic differentiation of 5-azacytidine (5-aza-CN)-treated NIH-3T3 cells.(A, B) After 5 and 14 days culture in neurogenic differentiation medium (NM) containing DMEM supplemented 2% FBS, 2% dimethyl sulfoxide and 100 μM butylated hydroxyanisole, expressions of neuronal specific intermediated filament genes such as neurofilament medium (NFM) and Nestin in 5 μM 5-aza-CN-treated NIH-3T3 cells were quantified by RT-qPCR and Western blot analysis, respectively. Arbitrary densities of proteins were quantified by Scion Image software, as shown in the graph below. (C) After 14 days of neurogenic differentiation medium culture, morphologic changes in 5 μM 5-aza-CN-treated NIH-3T3 cells were observed under an inverted microscope (arrows), and NFM protein expression was visualized by immunofluorescence staining. Ctrl means untreated. These data represent three independent experiments. The values shown represent means ± standard errors. *p < 0.05.
|
Go to :
DISCUSSION
The observation that genetically identical cells can exhibit diverse phenotypes raises the possibility there is a novel mechanism that can modulate expressions of cell-type determinant genes. Epigenetic modification has been considered to be a promising mechanism to perform this function without genetic alteration [15,16]. Based on much evidence that epigenetic modification can affect cell-fate determination by changing gene transcription through a conformational change of chromatin, it has been used as a useful strategy to achieve lineage specification and cellular reprogramming [8].
Along with histone modification, DNA methylation, that repress the transcription, is a well-marked example of epigenetic modification extensively researched in recent years [17]. A chemical analog of cytidine, 5-aza-CN temporarily inhibits the function of DNA methyltransferase, that maintain the methylation pattern of the parent cell by recognizing hemi-methylated DNA, to form arbitrary demethylated sites in DNA, which cause changes of the cell's genetic imprinting map and ultimately activates repressed genes in heterochromated DNA [27,28]. Inspired from distinctive observations that spontaneous differentiation of mesenchymal cell lines and changes of cell phenotype appeared after exposure of 5-aza-CN [29], Pennarossa and his colleagues developed the protocol that adult fibroblasts could be transformed into endodermal pancreatic cells by brief demethylation using these chemicals [18]. Recently, it was also reported that non-osteogenic cells could be trans-differentiated into osteoblasts by epigenetic modifications followed by a specific induction step [19]. Our results revealed that if reversal of differentiation status by a temporary exposure of 5-aza-CN to mature fibroblast is immediately applied induction step for several desired cell-type-specific differentiation conditions, fibroblasts can be directly converted into diverse mesenchymal-lineage cells, such as osteogenic, chondrogenic, and adipogenic cells first. This two-step protocol enables inter-lineage conversion of fibroblast into ectodermal neuronal cells. So, if an effect of 5-aza-CN that can increase cell plasticity and coax more inducible states, assumed by expression changes of several pluripotency-related genes such as SOX2, OCT3/4, and NANOG, sequentially combined appropriate cell type determinant induction, it would be possible to allow intra- and/or inter-lineage conversions of differentiated mesenchymal-lineage fibroblasts into all three germline originated cells.
An achievement of neuronal cell fate and identity by direct lineage reprogramming was a research subject of most attention in the field of regenerative medicine in company with cardiomyocyte due to clinical significance [11,30]. A majority of studies to produce functional neurons have been undertaken by transcription factor-mediated cellular reprogramming along the lines of iPSC production [30]. Although some epigenetic-based neuronal conversion approaches using chemical compound targeting chromatin-remodelling proteins have been studied, they used mostly histone modifier as adjuvants to accelerate conversion efficiency by overexpression of PAX6 and BF1 transcription factors [31] or as only constituents of chemical cocktail including BMP and TGF-β signalling inhibitor [32]. So, suggested protocol using demethylating agent in this study may be used as a simple alternative strategy to earn functional neuronal cells.
While this study raised a possible acquisition of desired multi-lineage cell populations from mature fibroblasts by direct lineage reprogramming, it is also true that there are obvious limitations because functional data are insufficient to assess the quality of the differentiated cells and to whether the converted cells can work in the expected direction. Nevertheless, with further functional studies about converted cells, if suggested protocol can be fine-tuned by efforts to eliminate cellular toxicity of 5-aza-CN drug and discover a precise signaling molecule to determine induced cellular fate, that substitutes for BMP-2, its efficiency to earn desired patient-specific cells from easily acquired cell source may significantly improve. It will be expected to expand its availabilities such as application in conversions into hardly-obtaining cells due to loss in the developmental process such as enamel-secreting ameloblast in the fields of regenerative medicine.
Go to :
 XML Download