Journal List > Korean J Physiol Pharmacol > v.24(5) > 1145587

Chian, Lee, Lee, Chen, Wang, Lee, and Lee: Cilostazol ameliorates diabetic nephropathy by inhibiting high-glucose-induced apoptosis

Abstract

Diabetic nephropathy (DN) is a hyperglycemia-induced progressive development of renal insufficiency. Excessive glucose can increase mitochondrial reactive oxygen species (ROS) and induce cell damage, causing mitochondrial dysfunction. Our previous study indicated that cilostazol (CTZ) can reduce ROS levels and decelerate DN progression in streptozotocin (STZ)-induced type 1 diabetes. This study investigated the potential mechanisms of CTZ in rats with DN and in high glucose-treated mesangial cells. Male Sprague–Dawley rats were fed 5 mg/kg/day of CTZ after developing STZ-induced diabetes mellitus. Electron microscopy revealed that CTZ reduced the thickness of the glomerular basement membrane and improved mitochondrial morphology in mesangial cells of diabetic kidney. CTZ treatment reduced excessive kidney mitochondrial DNA copy numbers induced by hyperglycemia and interacted with the intrinsic pathway for regulating cell apoptosis as an antiapoptotic mechanism. In high-glucose-treated mesangial cells, CTZ reduced ROS production, altered the apoptotic status, and down-regulated transforming growth factor beta (TGF-β) and nuclear factor kappa light chain enhancer of activated B cells (NF-κB). Base on the results of our previous and current studies, CTZ deceleration of hyperglycemia-induced DN is attributable to ROS reduction and thereby maintenance of the mitochondrial function and reduction in TGF-β and NF-κB levels.

INTRODUCTION

Diabetic nephropathy (DN) refers to persistent proteinuria in the absence of urinary tract infection, heart failure, and non-diabetic kidney disease. After the onset of diabetes, hyperglycemia increases renal blood flow. Gradually, the loss of renal filament mesh increase renal filtration pressure and protein excretion. In addition to diabetes progression and poor blood glucose control, protein excretion increases until proteinuria develops [1]. Studies have reported that similar pathophysiological mechanisms of renal disorders occur in type 1 and 2 diabetes [2]. In molecular pathology, DN is characterized by the excessive extracellular matrix (ECM) with thickening in glomerular and tubular basement membranes, ultimately progressing to glomerulosclerosis and tubulointerstitial fibrosis accompanied by apoptosis [3,4].
Increased ROS levels in diabetes play a major role in diabetic complications [5]. In addition to the high rate of cellular respiration due to hyperglycemia, the multicomponent nicotinamide adenine dinucleotide phosphate (NADPH) oxidase is a source of cellular ROS [6]. Excessive ROS can alter the vascular endothelium, react with nitric oxide to produce cytotoxic peroxynitrite, and impair ECM proteins [7,8]. It also damages endothelial cells by stimulating the expression of various genes involved in inflammatory pathways such as transforming growth factor beta 1 (TGF-β1) and tumor necrosis factor α (TNF-α) [9]. Studies have demonstrated that high glucose-induced ROS up-regulates TGF-β1 and ECM expression in glomerular mesangial cells [10]. The pathogenesis and complications of diabetes involve mitochondrial dysfunctions and mitochondrial DNA (mtDNA) abnormalities [11]. Numerous studies have highlighted diabetes-induced mtDNA defects by examining changes in mtDNA copy numbers. The human mitochondrial genome is circular double-stranded DNA with 1,000–10,000 copies per cell; it can code for essential peptides for cellular respiration and maintenance of normal mitochondrial function [12]. Excessive mitochondrial superoxide generates during hyperglycemia compromises the antioxidant defense systems in DN and reduces mitochondria-specific manganese superoxide dismutase [13]. Damage to mtDNA impairs the electron transport chain increasing ROS production. Under different energy demands and physiological conditions, changed mtDNA copy numbers respond to mitochondrial abundance in cells [14]. An increase in mtDNA copy number is associated with oxidative stress in aging human tissues or leukocytes [12]. Additionally, other researchers have observed a positive correlation between oxidative stress and mtDNA copy numbers in the blood of patients receiving hemodialysis [15]. Al-Kafaji and Golbahar [16] demonstrated that high-glucose-induced oxidative stress increases mtDNA copy numbers in human mesangial cells [16]. These studies have indicated a strong association between mitochondria and DN.
The phosphodiesterase (PDE) family degrades intracellular second messengers, such as cyclic adenosine monophosphate (cAMP) and cyclic guanosine monophosphate (cGMP) [17,18]. Some studies have reported that cAMP or cGMP regulates several signaling pathways involved in renal disease development and progression, including mitogenesis, inflammation, and ECM synthesis [19,20]. Cilostazol (CTZ) 6-[4-(1-cyclohexyl-1H-tetrazol-5-yl)butoxy]-3, 4-dihydro-2(1H)quinolinone (Supplementary Fig. 1) is a specific inhibitor of PDE-3, and it can increase cAMP levels in tissues to prevent platelet aggregation and blood vessel dilation [21]. Lee et al. [9] demonstrated that CTZ significantly reduces superoxide production in situ. CTZ administration in streptozotocin (STZ)-induced diabetic rats exerts effects by relieving oxidative stress. Additionally, CTZ regulates the expression of NF-κB and TGF-β, which are involved in the progression of renal diseases and thus ameliorates the onset of DN [9]. To elucidate the effects of CTZ on mitochondria in DN, kidney specimens were examined through electron microscopy; mitochondrial proteins and changes in mtDNA copy numbers were also examined. Because of mesangial cell loss is correlated with worsening renal function in DN [22], rat mesangial cells (RMCs) treated with high amounts of glucose were examined to evaluate the effect of CTZ on the cellular system.

METHODS

Animals and experimental treatments

We purchased CTZ from Otsuka Co., Ltd., Tokyo, Japan. All animal experimental protocols used in this study were approved by the Institutional Animal Care and Use Committee of the Chung Shan Medical University (IACUC, CSMC, approval number is 1442) Taichung, Taiwan. Male Sprague–Dawley rats (180 ± 10 g) were used in this study and were purchased from the BioLASCO Taiwan Co., Ltd., (YiLan County, Taiwan). The rats were housed under laboratory conditions (18°C–23°C, humidity 55%–60%, 12-h light/dark cycle) for at least 1 week before the study. They were administered a single intraperitoneal injection of STZ (dissolved in 0.05 M of citrate buffer, pH 4.5), 65 mg/kg of body weight. Following 72 h of STZ administration, their blood was collected to determine the fasting glucose concentration. Rats in with a glucose concentration of less than 250 mg/dl were excluded from the study. Blood glucose and body weight were monitored every week. The rat were provided with standardized food (Purina Laboratory Chow obtained from Purina Mills, Inc., St. Louis, MO, USA) and water ad libitum, and divided into indicated groups (6 rats per group). According to a previous study [9], 5 mg/kg/day of CTZ administered for 6 or 12 weeks improves the oxidative status in STZ-induced diabetic rats. Hence, CTZ dissolved in ddH2O at the indicated dosage was administered through tube feeding. All the rats were sacrificed after treatment completion in the specified duration. Kidney tissues were collected for analysis.

Pathological histology of kidneys

Kidney specimens were obtained from the rats and were immediately fixed in paraformaldehyde and processed for histological examination. The glomerular basement membrane (GBM) thickness were measured using a transmission electron microscope (6 rats per group). Briefly, electron micrographs at 20,000×X magnification (JEM-1230 Electron Microscope; JEOL Ltd., Tokyo, Japan) were analyzed after the initial processing. Thereafter, brightness and contrast parameters were added, and image elements of required brightness were selected. Morphometric measurements were performed after filtering for noise and disturbances.

Measurement of the mtDNA copy number

Genomic DNA was extracted using the QIAamp DNA Mini Kit (Qiagen, Hilden, Germany) according to the manufacturer’s protocol. Briefly, 200 µl lysis buffer was added to the tissue homogenate, mixed, and incubated at 56°C for 10 min. Following centrifugation at 20,000 g for 1 min, absolute ethanol (200 µl) was added, and the lysate was centrifuged at 6,000 g for 1 min and washed. DNA was eluted to store at −20°C. All the DNA samples were sheared prior to use. To measure the mtDNA copy number, amplification was performed for β-actin (BA, nuclear DNA, nDNA) and mtDNA regions for mitochondrial D-loop (DL). Table 1 lists custom-made primers used in the study. Using BLAST analysis, probe and primer combinations were designed to avoid amplification of pseudogenes. The copy number of mtDNA per nuclear genome was assessed using the LightCycler system and FastStart DNA Master SYBR Green 1 Kit (Roche Molecular Biochemicals, Mannheim, Germany). Total genomic DNA (50 ng) was mixed with SYBR Green 1 probe, forward and reverse primers (100 ng/µl), and nuclease-free water to attain the final volume (50 µl). PCRs were performed in 40 cycles of denaturation at 95°C for 10 min, amplification at 95°C for 15 sec, melting at 60°C for 1 min, and cooling for 10 sec. The resulting data were analyzed using Roche Molecular Biochemicals LightCycler software. Data analysis was based on the measurement of the cycle threshold (CT), which is the PCR cycle number when the fluorescence measurement reaches a set value. Measured mtDNA copy number versus nuclear DNA copy number by amplification of the mitochondrial DL versus the nuclear BA gene (DL/BA) [CT (DL)-CT (BA)] was used as the abundance of the mitochondrial genome. The DL/BA ratio was represented as the percentage after normalized with the values for the control group.

Cell culture

RMCs obtained from American Type Culture Collection (ATCC) were maintained in 85% Dulbecco’s modified Eagle’s medium with 4 mM/L glutamine, 1.5 g/L sodium bicarbonate, 0.4 mg/ml geneticin (G418), and 15% fetal bovine serum. According to a previous study [23] and our preliminary study, 25 mM of glucose can induce cell responses in RMCs, such as inflammation or ROS elevation. To perform further examinations, the concentration of glucose in the culture medium was adjusted to 25 mM or 5 mM along with CTZ to incubate the cells.

Measurement of NADPH oxidase activity

To determine NADPH oxidase activity, the lucigenin-enhanced chemiluminescence assay was used to detect superoxide radical (O2−) production in kidney homogenates [6]. After the addition of NADPH (0.1 mM) to phosphate buffer (50 mM KH2PO4, 1 mM EGTA, 150 mM sucrose, pH 7.4), sample and lucigenin (5 µM) at final volume 250 µl were reacted. Then luminescence was measured using a microplate fluorometer (Fluoroskan Microplate Fluorometer; Thermo Scientific Co., Waltham, MA, USA) at 30°C every 10 sec for 5 min. Buffer blank was subtracted from each reading. Counts/µg protein represented NADPH oxidase activity.

Measurement of ROS production

The cellular ROS Detection Assay Kit (Abcam Co., Cambridge, UK) was used to detect the ROS activity within the cell. Briefly, 2.5 × 10⁴ cells/well were seeded in a 96-well plate. After cell diffusion, DCFDA/H2DCFDA was de-acetylated by cellular esterases to a non-fluorescent compound, which was later oxidized by ROS into 2´,7´-dichlorofluorescein (DCF). DCF was detected through fluorescence spectroscopy with maximum excitation and emission spectra of 495 and 529 nm, respectively.

Protein analysis

In animal experiments, the whole kidney tissue was extracted at 4°C through homogenization in a buffer containing 20 mM HEPES, 1 mM dithiothreitol, 50 µM antipain, 50 µM leupeptin, 50 µM chymostatin, and 50 µM pepstatin. The homogenates were then centrifuged at 10,000 g for 10 min to obtain the protein in the supernatant. After measuring the protein concentration, equal amounts of total protein from the groups were separated in 10% SDS-PAGE gels and then transferred to nitrocellulose membranes (Millipore, Bedford, MA, USA). Thereafter, the membranes were blocked with 5% nonfat milk and incubated with a primary antibody. The antibodies used in this study included Bcl-2 (1:1,000), BCL2-associated X (Bax) (1:1,000), caspase-3 (1:500) (Santa Cruz Biotech, Santa Cruz, CA, USA), and anti-α-tubulin antibody (1:1,000) (Sigma Co., St. Louis, MO, USA). After the primary antibody treatment, the membranes were washed and incubated with a secondary antibody (HRP-conjugated goat anti-rabbit antibody, 1:5,000 or HRP-conjugated rabbit anti-mouse antibody, 1:8,000) (Sigma Co.). The substrates were visualized using echochemiluminescence (Amersham Biosciences, Piscataway, NJ, USA) and analyzed using a Fuji LAS-3000 imaging system (Tokyo, Japan).
The RMCs were exposed to high glucose and a variable CTZ concentration, and the expression of cellular Bax, Bcl-2, TNF-α (1:1,000), TGF-β (1:1,000), IkB (1:1,000), and NF-κB p65 (1:1,000) (Santa Cruz Biotech) was analyzed using Western blotting. The levels of secreted TNF-α (Rat TNF-alpha DuoSet ELISA Kit; R&D Systems, Minneapolis, MN, USA) and TGF-β (TGF-beta 1 Quantikine ELISA Kit; R&D Systems) were determined using the enzyme-linked immunosorbent assay.

Statistical analysis

The animal study was conducted using a completely random design. Data were analyzed using the analysis of variance (ANOVA) and Duncan’s multiple range test. Significant difference was observed at a p-value of 0.05, and differences between treatments were tested using the least significant difference test. All statistical analyses of data were performed using SigmaStat 4.0 and SigmaPlot 10.0. In the cell study, results were expressed as the mean ± standard deviation of three determinations. Statistical differences were determined by conducting one-way ANOVA and Duncan’s multiple range test using Sigma Stat 4.0; the difference was considered significant when p < 0.05.

RESULTS

CTZ improves the kidney lesions in STZ induced diabetic rats

In our previous study, CTZ can reduce the blood urine nitrogen in STZ-induced diabetes animal [9]. The result indicated that CTZ could decelerate the diabetic nephropathy. Here, the pathological changes in the kidneys of STZ-induced diabetic rats were evaluated through electron microscopic examination. The glomerular basement membrane thickness in the diabetes group (panel B’) was higher than that in the control group (Fig. 1A). The quantification result revealed a 63% decrease in the glomerular basement membrane thickness after CTZ treatment (5 mg/kg/day) for 12 weeks (Fig. 1B). The morphology and ultrastructure of the mitochondria were also observed in the mesangial cells and proximal tubule cells of the kidney. In diabetes rat, the mitochondria showed morphological damage in both mesangial cell and proximal tubule cells. The mitochondria of mesangial cell were swollen, inner and outer membranes were damaged, cristae were blurred, boundary to the intermembrane space was lost in the diabetic group compared with the control group (Fig. 2B). The damaged mitochondria were elongated and compressed with each other to form a molding configuration. Although some lesions of the mitochondria in the CTZ group remained, the original morphological structure of the mitochondria was similar to that in the control group (Fig. 2C).

CTZ reduces the mtDNA copy number in DN

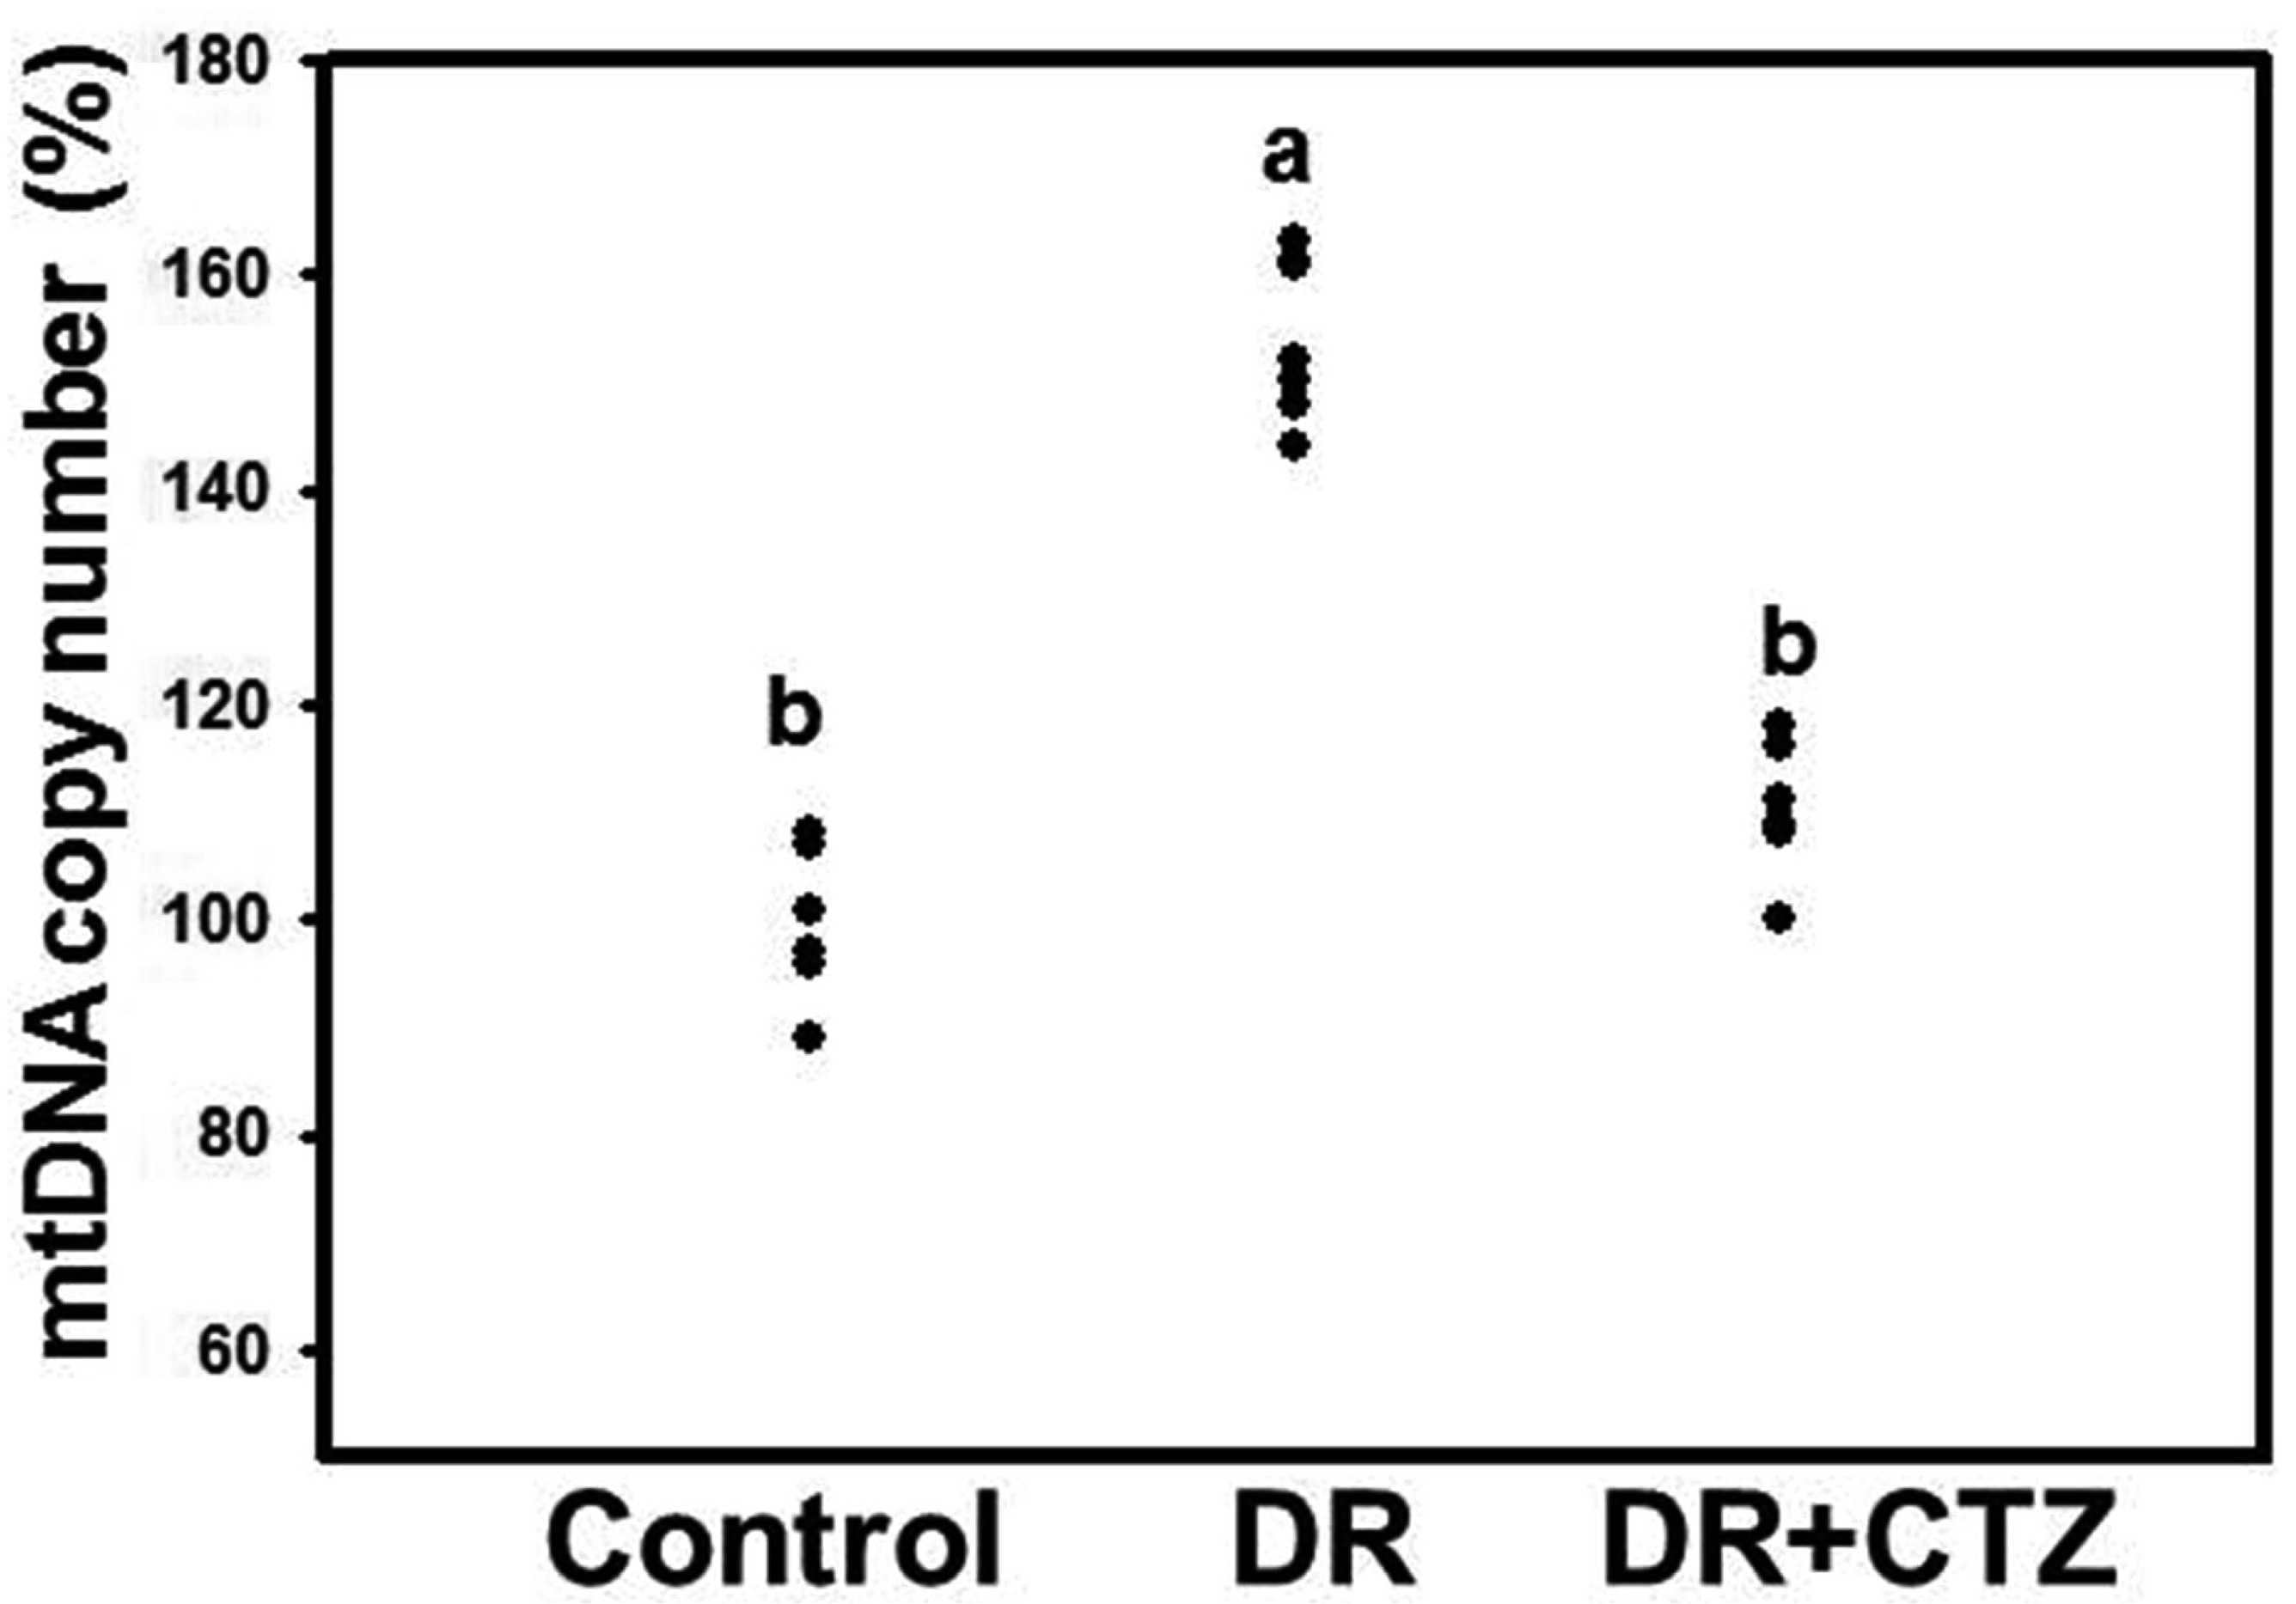
The mtDNA copy number was elevated in the diabetic group (Fig. 3). No significant decrease in the mtDNA copy number was observed after CTZ treatment for 12 weeks compared with the diabetic group (Supplementary Fig. 2). To compare the effect of CTZ on the mtDNA copy number for different treatment durations, we shortened the CTZ treatment to 6 weeks in a group of experimental animals. The mtDNA copy number increased in the kidney specimen from the diabetic group under 6-week induction, but CTZ treatment decreased it significantly (Fig. 3).

CTZ alters the apoptosis status in STZ-induced diabetic rats

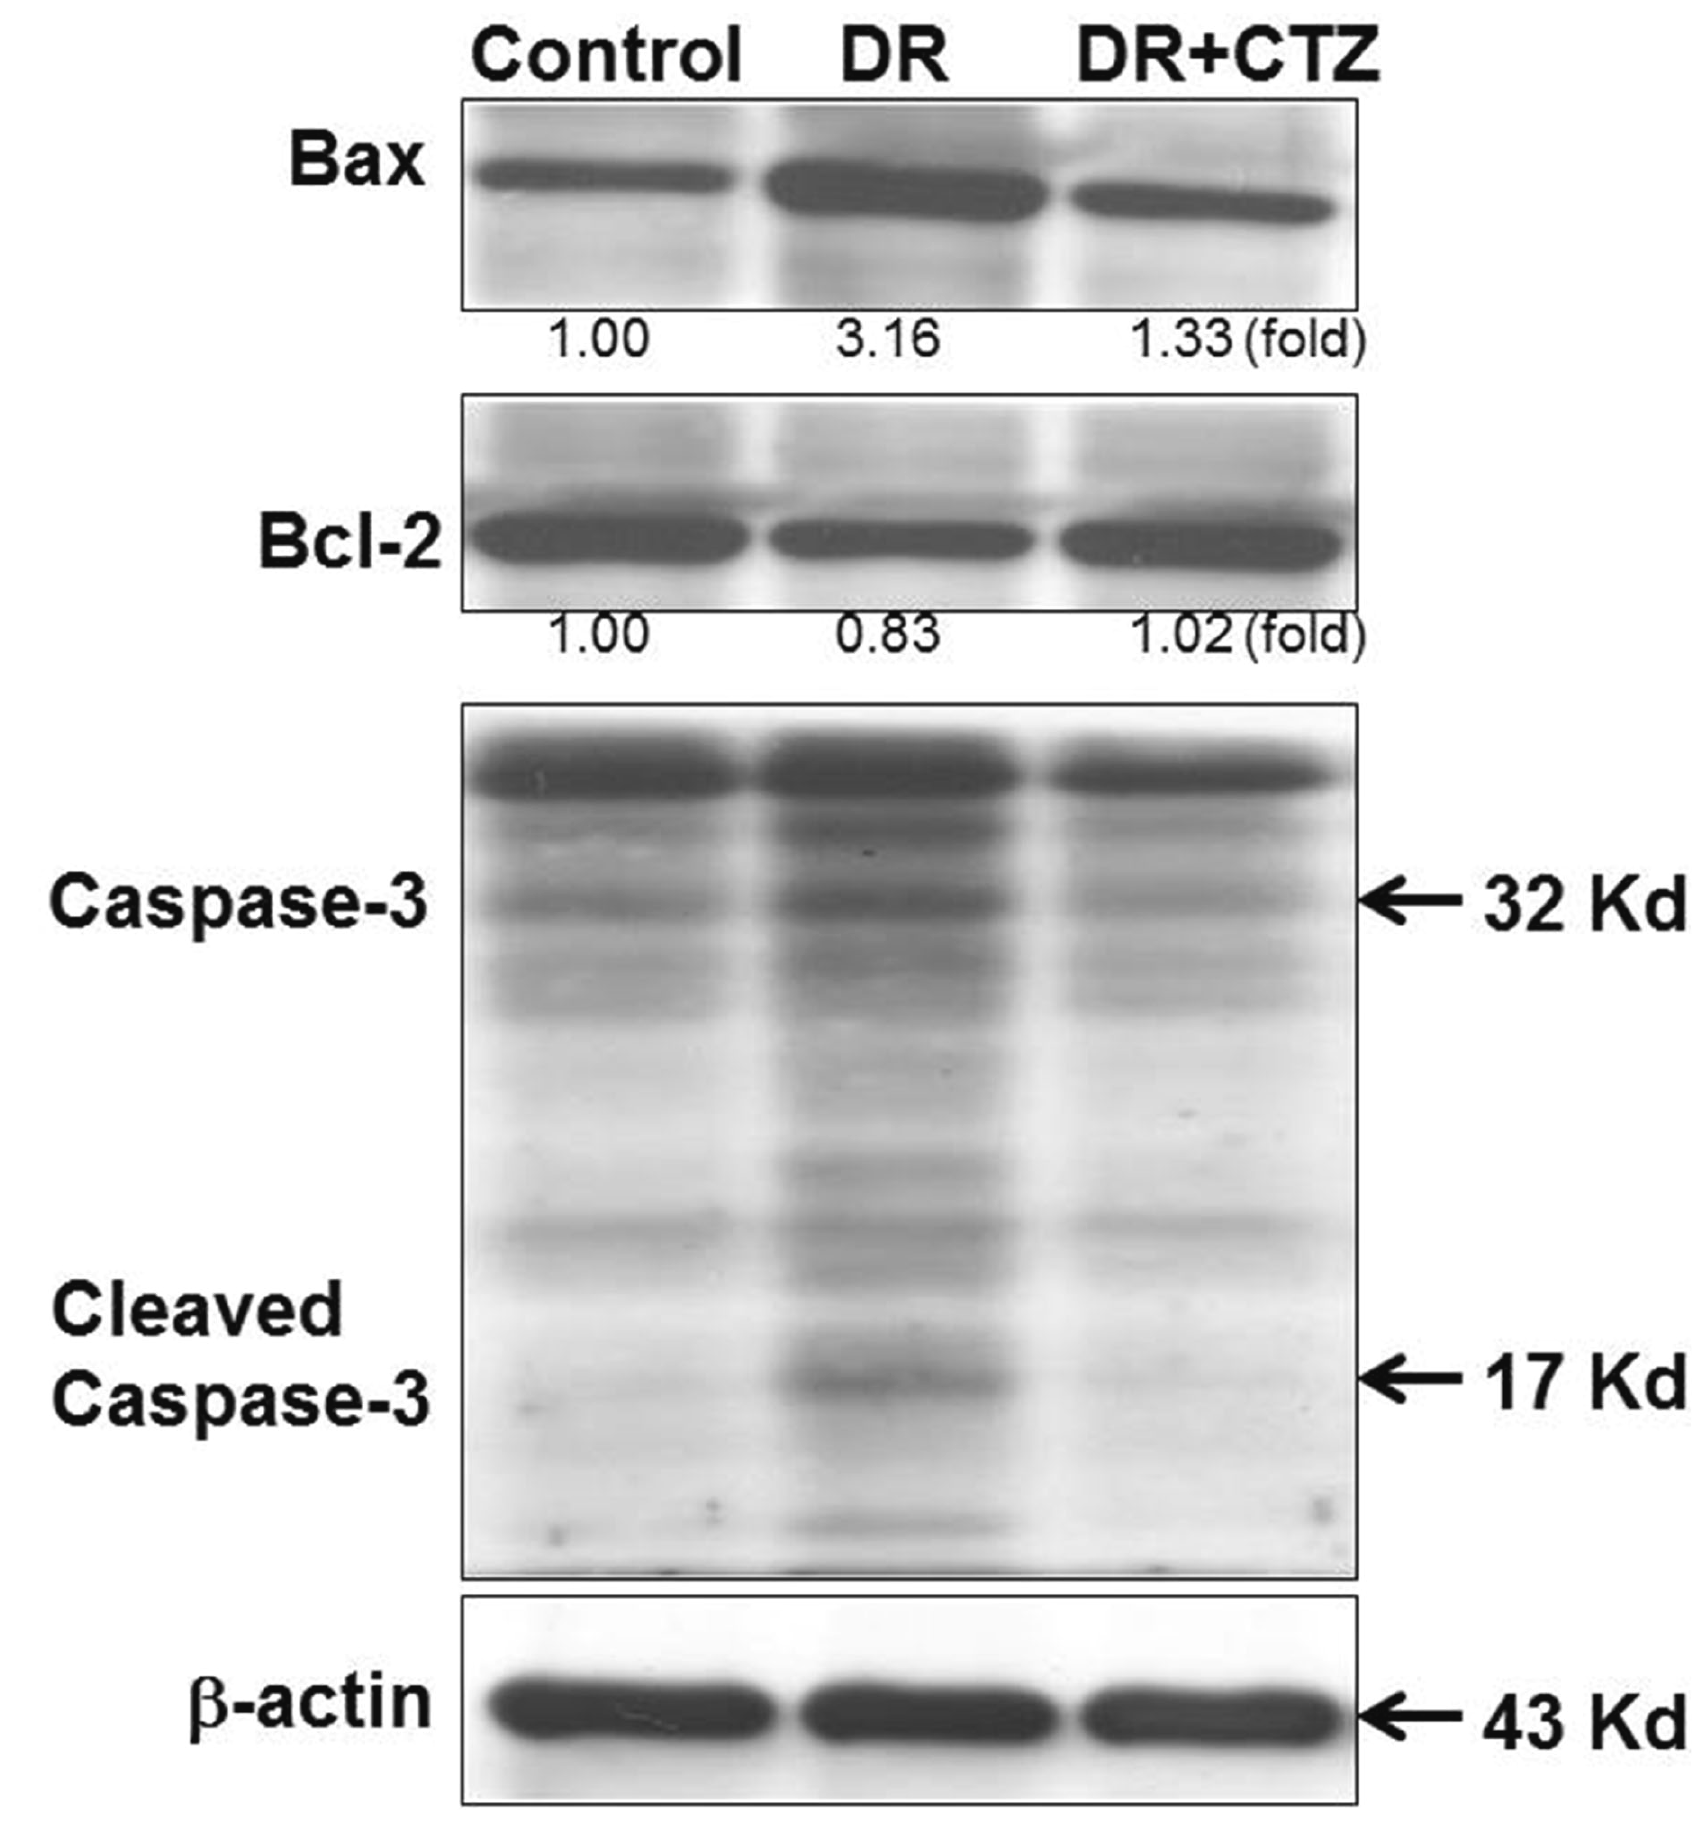
Expression of the Bcl-2 family is highly relative to apoptosis. Bax is a proapoptotic protein, but Bcl-2 is an antiapoptotic one. The regulation of these proteins can trigger apoptosis in cells. In diabetic rats, the expression of Bax increased and that of Bcl-2 decreased significantly (Fig. 4), along with caspase-3 cleavage, leading to apoptosis. In the group treated with 5 mg/kg of CTZ, the expression of apoptosis-related proteins demonstrated an opposite result. CTZ reduced Bax expression, increased Bcl-2 expression, and reduced caspase-3 cleavage.

CTZ reduces ROS in high glucose-treated RMCs

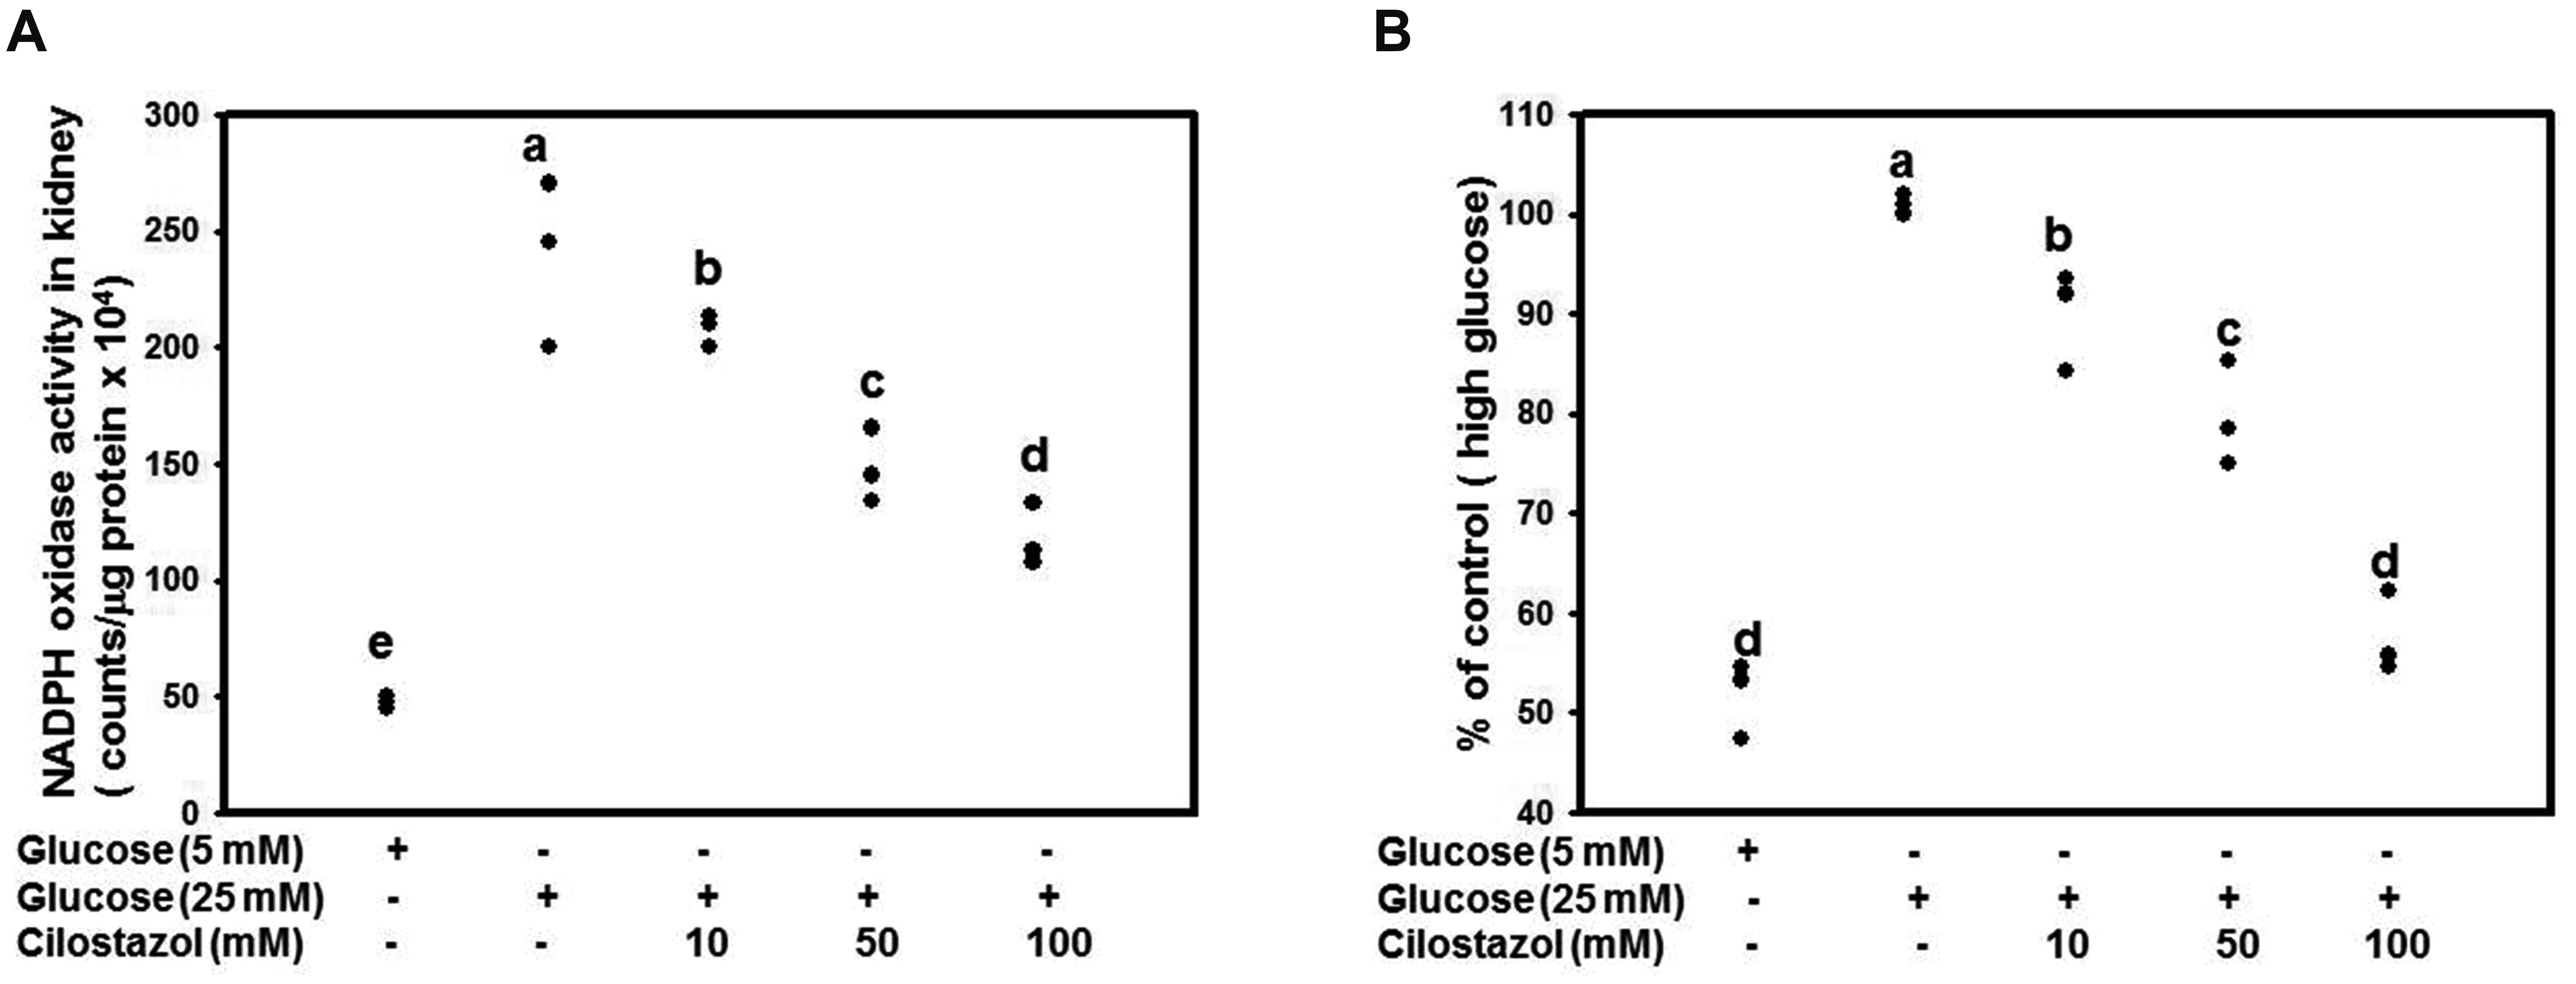
We found a significantly high oxidative stress status in the kidneys of diabetic rats while CTZ significantly improved the oxidative status in our previous study [9]. In the present animal model, the mitochondria of mesangial cell in DN appeared damage and malfunction. Base on the mesangial cell loss is correlated with worsening renal function in DN, we detected the ROS level of RMCs after treatment of glucose and CTZ. RMCs were treated with 5 or 25 mM of glucose along with CTZ for 4 days. Treatment with CTZ at 10, 50, or 100 mM dose-dependently increased NADPH oxidase activity (Fig. 5A). The ROS production level was determined through DCFDA examination, and the result revealed that CTZ can reduce ROS production significantly (Fig. 5B).

CTZ alters the apoptosis status in high glucose-treated RMC

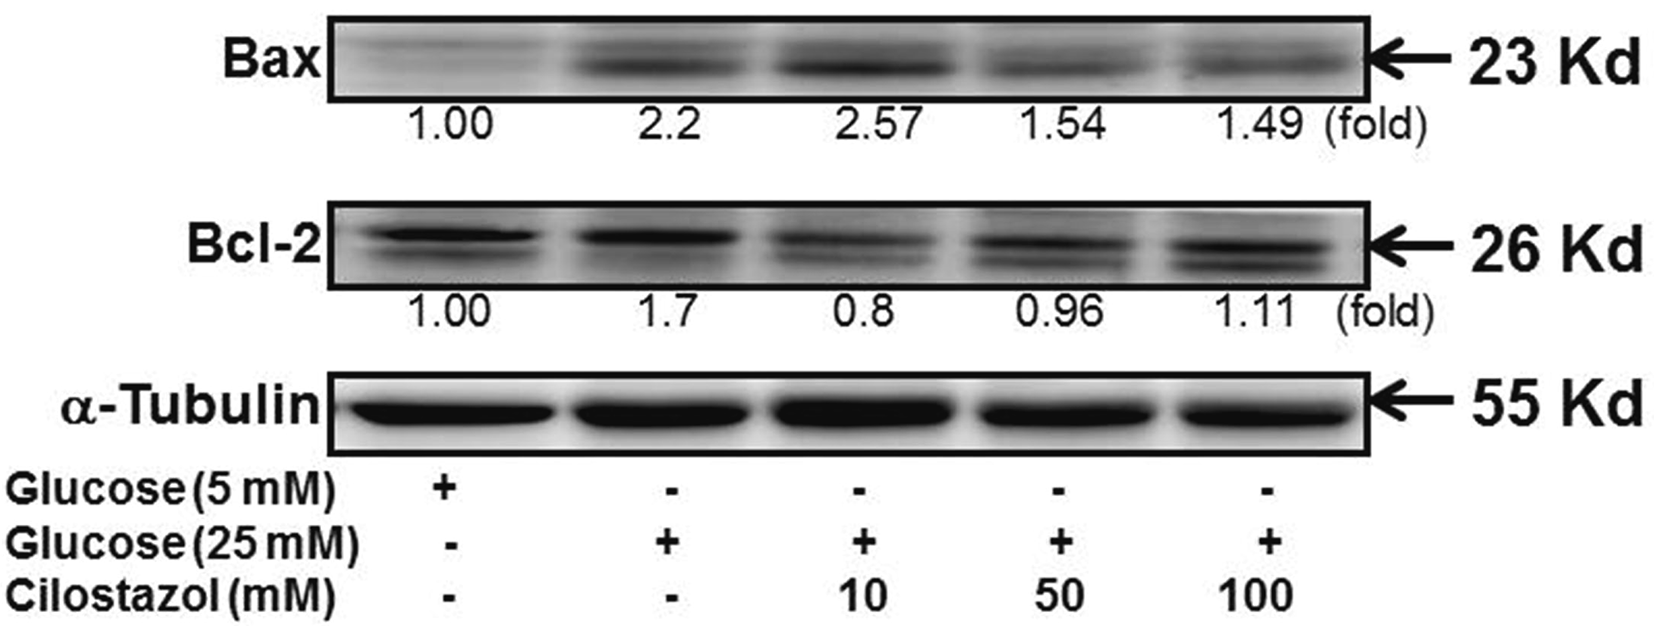
After the treatment of RMCs with high glucose, the increase in the Bax level was more predominant than that in the Bcl-2 level (Fig. 6). Treatment with different CTZ concentrations reduced the Bax level, indicating a reduction in apoptosis, even in the in vivo study.

CTZ reduces NF-κB, TGF-β, and TNF-α levels in high glucose-treated RMCs

CTZ administration affected STZ-induced diabetic rats by regulating TGF-β expression (Supplementary Fig. 3). The previous and current results revealed that CTZ ameliorates DN onset in the progression of renal diseases. To confirm the mechanisms of CTZ in in vitro system, in Fig. 7A, High glucose increased NF-κB, TGF-β, TNF-α, and IκB levels in RMCs. Nonetheless, CTZ reduced NF-κB, TGF-β, and TNF-α expression. CTZ treatment reduced the secreted TGF-β and TNF-α (Fig. 7B, C).

DISCUSSION

Pathological changes in early DN, including hypertrophy of the renal pelvis and renal tubular epithelium, basement membrane thickening, and ECM protein accumulation, are due to excessive renal cell growth [24]. Nonsignificant mesangial cell hyperplasia can cause functional changes in early diabetic nephrolithiasis, which slowly progresses to glomerulosclerosis. Studies have reported DN after 6 weeks of STZ administration in animals [25,26]. Our previous study revealed that CTZ has a therapeutic effect on STZ-induced DN. The mesangial matrix in the kidneys of diabetic rats enlarges and becomes hypertrophic because of expansion. After CTZ treatment, the mesangial matrix shrinks and becomes less hypertrophic [9]. The current study revealed that basal membrane thickening can be decelerated in the CTZ-treated group as well (Fig. 1). These findings suggest that CTZ can prevent the deterioration of patient conditions in DN. Our previous study showed that CTZ administration in diabetic rats regulates NF-κB and TGF-β expression, thus ameliorating DN onset [9]. In the current study, NF-κB and TGF-β levels were downregulated by CTZ in high-glucose-treated mesangial cells (Fig. 7). This revealed that CTZ regulates cytokines or transcriptional factors to decelerate DN progression. Mesangial cells are the main cellular constituents of the glomerular mesangium. During early DN, mesangial cells secrete several types of inflammatory cytokines or chemokines that participate in renal glomerular fibrosis [27]. Sun et al. [28] reported that high-glucose-treated mesangial cells increase ROS, inflammatory responses, and ECM expression. They revealed that artesunate, reduces ROS and inflammatory responses. Additionally, Yao et al. [29] indicated that Coreopsis tinctoria Nutt ameliorates high glucose-induced renal fibrosis and inflammation in mesangial cell. In STZ-induced DN, we have found that CTZ can significantly improved the oxidative status ROS in the kidneys of diabetic rats [9]. In current animal study, we found CTZ can reverse the mtDNA copy numbers and the apoptotic protein levels of Bax, Bcl-2, and Caspase-3 in kidney tissue of animal with DN. However, it cannot elucidate what kinds of cells affected by CTZ to ameliorate DN progression in the whole tissue lysate. According to the other study, mesangial cell loss correlated with renal dysfunction in DN progression [22]. Herein, we found that the mitochondria of mesangial cell in DN appeared damage and malfunction while CTZ improved the mitochondria morphology. Additionally, in RMCs, CTZ reduced the high-glucose-induced ROS and decelerated cell apoptosis as well as the results in animal study. CTZ directly increasing intracellular cAMP results in inhibition of NAD(P)H oxidase-dependent ROS formation [30]. Elimination of excessive ROS reduces the expression of genes involved in inflammation such as TGF-β and TNF-α [9,10]. Although CTZ was not indicated to directly regulate mitochondria function, apoptosis, and cytokines in hyperglycemic condition, CTZ increasing cAMP can reduce ROS level to improve the function of mesangial cell in DN progression.
Increased ROS production in the body due to diabetes is highly related to multiple organ complications [8,30-34]. The increase in metabolic substances due to hyperglycemia affects the mitochondria and electron transport chain, resulting in excessive ROS production [8]. Mitochondria are tubular because of the balance between fission and fusion [35]. Increasing evidence indicates that mitochondrial morphology is crucial in maintaining cellular function [36]. By analyzing mitochondrial structure and morphology [37-41], studies have demonstrated that mitochondrial deformation such as swelling, accumulation, and small size are common in the kidneys of patients and animals with hyperglycemia [42-44]. Evidence of mitochondrial alternation due to CTZ treatment is rare. However, in the present study, the mitochondria was swollen, the inner and outer membranes were damaged, the cristae were blurred, and the boundary of the intermembrane space was lost in the diabetic group, whereas the mitochondrial morphology improved in the CTZ-treated group (Fig. 3).
Studies have also explored the association of mtDNA mutations with diabetes [45]. Mitochondrial dysfunction and damaged oxidative phosphorylation are major causes of impaired insulin secretion. mtDNA is susceptible to oxidative damage because of its proximity to the site of ROS generation, lack of histone protection, and the incapability of mitochondrial polymerase to repair oxidative damage [46]. The accumulation of mtDNA mutations in somatic cells can cause mitochondrial dysfunction, leading to cell energy loss [47]. In addition to changes in mitochondria, the mtDNA copy number was determined in the present study. A significant increase in the mtDNA copy number occurred in the diabetic group. The copy number decreased in the group receiving 6 -weeks of CTZ treatment (Fig. 4). However, prolonging CTZ treatment to 12 weeks did not exert any prominent effects on diabetes (Supplementary Fig. 2). According to a previous study, the mtDNA copy number may increase in response to mitochondrial DNA damage because normal mitochondrial function must be maintained [48] to generate sufficient energy for the cell. This effect occurs in early-stage DN and mesangial matrix hypertrophy. The mitochondrial genome can code 13 essential peptides for cellular respiration and maintenance of normal mitochondrial function [12], but over 90% of mitochondria proteins coded from chromosomal DNA. Treatment with CTZ in this stage can improve the mitochondria function but not increasing mtDNA copy number. It is presumed that CTZ reduces ROS level thus relieve the mitochondria DNA damage, therefore, the mtDNA copy number decreases. Besides, the regulation of CTZ may also occur outside of mitochondria. In early DN, reducing ROS level can down-regulate the expression of NFκB to ameliorate the chronic inflammation. CTZ reducing ROS may play multiple roles to decelerate the DN progression. Nevertheless, as the STZ induction time prolongs, the production of large amounts of ROS severely damages mitochondria, and the compensatory role is not sustained; thereafter, mtDNA copy numbers decrease. This decrease reduces the synthesis of the respiratory chain complex and adenosine triphosphate production and gradually causes cell apoptosis, as shown in Fig. 5. Kang et al. [49] first proposed that high glucose promotes mesangial cell apoptosis through an oxidant-dependent mechanism. Glucose-induced mesangial cell apoptosis is characterized by an upregulation of the Bax/Bcl-2 ratio. These results were also revealed in our present study. Moreover, treatment with CTZ effectively overcame the apoptosis status in the RMCs and in vivo systems (Fig. 7). It also reduced the ROS level (Fig. 6). Our previous study indicated that CTZ improves the oxidative status in rats with DN; this finding is consistent with the results of the present study. The ability of CTZ to reduce ROS may be a critical mechanism in ameliorating DN. Studies have reported that a PDE5 inhibitor can reduce ROS levels by regulating the oxidative stress associated with proteins such as the ASK1/p38/JNK signaling pathway [50]. Further examination of the relationship between CTZ and these pathways is warranted.
Our previous study demonstrated that CTZ treatment has antioxidative abilities and decelerates the onset of renal diseases. CTZ delays DN progression, restores mitochondrial morphology and mtDNA copy number changes, and delays cell apoptosis. In mesangial cells, CTZ improves oxidative stress, prevents apoptosis, and reduces DN-related cytokines. This evidence supports the possibility of adjuvant treatment for DN.

SUPPLEMENTARY MATERIALS

Supplementary data including three figures can be found with this article online at http://pdf.medrang.co.kr/paper/pdf/Kjpp/Kjpp2020-24-05-04-s001.pdf.

ACKNOWLEDGEMENTS

This work was supported by Chung Shan Medical University and Changhua Christian Hospital under Grant CSMUCCH-101-002; and partially from Chung Shan Medical University Hospital under Grant CSH-2012-C-027. This manuscript was edited by Wallace Academic Editing.

Notes

Author contributions: C.W.C. and Y.S.L. performed the experiments and summarized the results. Y.J.L. analyzed the results of pathological histology of kidney. Y.H.C. did the measurement of mtDNA copy number. C.P.W., W.C.L. and H.J.L. participated the experiments, provided the supervision, and wrote the manuscript. All authors read and approved the final manuscript.

CONFLICTS OF INTEREST

The authors declare no conflicts of interest.

REFERENCES

1. Grubb E, Van der Vaart J, Norris K, Smoyer KE, Rolland C. 2016; Albuminuria and serum creatinine in predicting renal function decline in patients with diabetic nephropathy: a systematic literature review. Value Health. 19:PA520. DOI: 10.1016/j.jval.2016.09.1007.
crossref
2. Papadopoulou-Marketou N, Chrousos GP, Kanaka-Gantenbein C. 2017; Diabetic nephropathy in type 1 diabetes: a review of early natural history, pathogenesis, and diagnosis. Diabetes Metab Res Rev. 33:e2841. DOI: 10.1002/dmrr.2841. PMID: 27457509.
crossref
3. Kitada M, Ogura Y, Suzuki T, Sen S, Lee SM, Kanasaki K, Kume S, Koya D. 2016; A very-low-protein diet ameliorates advanced diabetic nephropathy through autophagy induction by suppression of the mTORC1 pathway in Wistar fatty rats, an animal model of type 2 diabetes and obesity. Diabetologia. 59:1307–1317. DOI: 10.1007/s00125-016-3925-4. PMID: 27020449.
crossref
4. Marshall CB. 2016; Rethinking glomerular basement membrane thickening in diabetic nephropathy: adaptive or pathogenic? Am J Physiol Renal Physiol. 311:F831–F843. DOI: 10.1152/ajprenal.00313.2016. PMID: 27582102. PMCID: PMC6121820.
crossref
5. Wang Z, do Carmo JM, Hall JE. 2016; ER stress and mitochondrial ROS contribute to the development of hypertensive‐diabetic nephropathy. FASEB J. 30(Suppl 1):740.17.
6. Vokurková M, Rauchová H, Řezáčová L, Vaněčková I, Zicha J. 2015; NADPH oxidase activity and reactive oxygen species production in brain and kidney of adult male hypertensive Ren-2 transgenic rats. Physiol Res. 64:849–856. DOI: 10.33549/physiolres.933254. PMID: 26713567.
crossref
7. Jha JC, Thallas-Bonke V, Banal C, Gray SP, Chow BS, Ramm G, Quaggin SE, Cooper ME, Schmidt HH, Jandeleit-Dahm KA. 2016; Podocyte-specific Nox4 deletion affords renoprotection in a mouse model of diabetic nephropathy. Diabetologia. 59:379–389. DOI: 10.1007/s00125-015-3796-0. PMID: 26508318. PMCID: PMC6450410.
crossref
8. Gnudi L, Coward RJM, Long DA. 2016; Diabetic nephropathy: perspective on novel molecular mechanisms. Trends Endocrinol Metab. 27:820–830. DOI: 10.1016/j.tem.2016.07.002. PMID: 27470431.
crossref
9. Lee WC, Chen HC, Wang CY, Lin PY, Ou TT, Chen CC, Wen MC, Wang J, Lee HJ. 2010; Cilostazol ameliorates nephropathy in type 1 diabetic rats involving improvement in oxidative stress and regulation of TGF-Beta and NF-kappaB. Biosci Biotechnol Biochem. 74:1355–1361. DOI: 10.1271/bbb.90938. PMID: 20622454.
10. Zhai YP, Lu Q, Liu YW, Cheng Q, Wei YQ, Zhang F, Li CL, Yin XX. 2013; Over-production of nitric oxide by oxidative stress-induced activation of the TGF-β1/PI3K/Akt pathway in mesangial cells cultured in high glucose. Acta Pharmacol Sin. 34:507–514. DOI: 10.1038/aps.2012.207. PMID: 23524565. PMCID: PMC4002794.
crossref
11. Nishikawa T, Brownlee M, Araki E. 2015; Mitochondrial reactive oxygen species in the pathogenesis of early diabetic nephropathy. J Diabetes Investig. 6:137–139. DOI: 10.1111/jdi.12258. PMID: 25802720. PMCID: PMC4364847.
crossref
12. Mengel-From J, Thinggaard M, Dalgård C, Kyvik KO, Christensen K, Christiansen L. 2014; Mitochondrial DNA copy number in peripheral blood cells declines with age and is associated with general health among elderly. Hum Genet. 133:1149–1159. DOI: 10.1007/s00439-014-1458-9. PMID: 24902542. PMCID: PMC4127366.
crossref
13. Shan Z, Chen S, Sun T, Luo C, Guo Y, Yu X, Yang W, Hu FB, Liu L. 2016; U-shaped association between plasma manganese levels and type 2 diabetes. Environ Health Perspect. 124:1876–1881. DOI: 10.1289/EHP176. PMID: 27258818. PMCID: PMC5132633.
crossref
14. Lee HC, Wei YH. 2005; Mitochondrial biogenesis and mitochondrial DNA maintenance of mammalian cells under oxidative stress. Int J Biochem Cell Biol. 37:822–834. DOI: 10.1016/j.biocel.2004.09.010. PMID: 15694841.
crossref
15. Yoon CY, Park JT, Kee YK, Han SG, Han IM, Kwon YE, Park KS, Lee MJ, Han SH, Kang SW, Yoo TH. 2016; Low mitochondrial DNA copy number is associated with adverse clinical outcomes in peritoneal dialysis patients. Medicine (Baltimore). 95:e2717. DOI: 10.1097/MD.0000000000002717. PMID: 26886611. PMCID: PMC4998611.
crossref
16. Al-Kafaji G, Golbahar J. 2013; High glucose-induced oxidative stress increases the copy number of mitochondrial DNA in human mesangial cells. Biomed Res Int. 2013:754946. DOI: 10.1155/2013/754946. PMID: 23984405. PMCID: PMC3745925.
crossref
17. Jeon YH, Heo YS, Kim CM, Hyun YL, Lee TG, Ro S, Cho JM. 2005; Phosphodiesterase: overview of protein structures, potential therapeutic applications and recent progress in drug development. Cell Mol Life Sci. 62:1198–1220. DOI: 10.1007/s00018-005-4533-5. PMID: 15798894.
crossref
18. Soderling SH, Beavo JA. 2000; Regulation of cAMP and cGMP signaling: new phosphodiesterases and new functions. Curr Opin Cell Biol. 12:174–179. DOI: 10.1016/S0955-0674(99)00073-3. PMID: 10712916.
crossref
19. Cheng J, Grande JP. 2007; Cyclic nucleotide phosphodiesterase (PDE) inhibitors: novel therapeutic agents for progressive renal disease. Exp Biol Med (Maywood). 232:38–51. PMID: 17202584.
20. Cheng J, Thompson MA, Walker HJ, Gray CE, Diaz Encarnacion MM, Warner GM, Grande JP. 2004; Differential regulation of mesangial cell mitogenesis by cAMP phosphodiesterase isozymes 3 and 4. Am J Physiol Renal Physiol. 287:F940–F953. DOI: 10.1152/ajprenal.00079.2004. PMID: 15280158.
crossref
21. Matsumoto T, Kobayashi T, Wakabayashi K, Kamata K. 2005; Cilostazol improves endothelium-derived hyperpolarizing factor-type relaxation in mesenteric arteries from diabetic rats. Am J Physiol Heart Circ Physiol. 289:H1933–H1940. DOI: 10.1152/ajpheart.00303.2005. PMID: 15908466.
crossref
22. Tsai YC, Kuo PL, Hung WW, Wu LY, Wu PH, Chang WA, Kuo MC, Hsu YL. 2018; Angpt2 induces mesangial cell apoptosis through the microRNA-33-5p-SOCS5 loop in diabetic nephropathy. Mol Ther Nucleic Acids. 13:543–555. DOI: 10.1016/j.omtn.2018.10.003. PMID: 30414568. PMCID: PMC6226567.
crossref
23. Chae YM, Park KK, Magae J, Lee IS, Kim CH, Kim HC, Hong S, Lee JG, Choi IJ, Kim HS, Min KS, Lee IK, Chang YC. 2004; Sp1-decoy oligodeoxynucleotide inhibits high glucose-induced mesangial cell proliferation. Biochem Biophys Res Commun. 319:550–555. DOI: 10.1016/j.bbrc.2004.05.025. PMID: 15178441.
crossref
24. Wolf G, Ziyadeh FN. 1999; Molecular mechanisms of diabetic renal hypertrophy. Kidney Int. 56:393–405. DOI: 10.1046/j.1523-1755.1999.00590.x. PMID: 10432377.
crossref
25. Young BA, Johnson RJ, Alpers CE, Eng E, Gordon K, Floege J, Couser WG, Seidel K. 1995; Cellular events in the evolution of experimental diabetic nephropathy. Kidney Int. 47:935–944. DOI: 10.1038/ki.1995.139. PMID: 7752595.
crossref
26. Rahman MH, Jha MK, Suk K. 2016; Evolving insights into the pathophysiology of diabetic neuropathy: implications of malfunctioning glia and discovery of novel therapeutic targets. Curr Pharm Des. 22:738–757. DOI: 10.2174/1381612822666151204001234. PMID: 26635266.
27. Zhao JH. 2019; Mesangial cells and renal fibrosis. Adv Exp Med Biol. 1165:165–194. DOI: 10.1007/978-981-13-8871-2_9. PMID: 31399966.
crossref
28. Sun Z, Ma Y, Chen F, Wang S, Chen B, Shi J. 2018; Artesunate ameliorates high glucose-induced rat glomerular mesangial cell injury by suppressing the TLR4/NF-κB/NLRP3 inflammasome pathway. Chem Biol Interact. 293:11–19. DOI: 10.1016/j.cbi.2018.07.011. PMID: 30031708.
crossref
29. Yao L, Li J, Li L, Li X, Zhang R, Zhang Y, Mao X. 2019; Coreopsis tinctoria Nutt ameliorates high glucose-induced renal fibrosis and inflammation via the TGF-β1/SMADS/AMPK/NF-κB pathways. BMC Complement Altern Med. 19:14. DOI: 10.1186/s12906-018-2410-7. PMID: 30630477. PMCID: PMC6327481.
crossref
30. Su SC, Hung YJ, Huang CL, Shieh YS, Chien CY, Chiang CF, Liu JS, Lu CH, Hsieh CH, Lin CM, Lee CH. 2019; Cilostazol inhibits hyperglucose-induced vascular smooth muscle cell dysfunction by modulating the RAGE/ERK/NF-κB signaling pathways. J Biomed Sci. 26:68. DOI: 10.1186/s12929-019-0550-9. PMID: 31492153. PMCID: PMC6731603.
crossref
31. Aghadavod E, Khodadadi S, Baradaran A, Nasri P, Bahmani M, Rafieian-Kopaei M. 2016; Role of oxidative stress and inflammatory factors in diabetic kidney disease. Iran J Kidney Dis. 10:337–343. PMID: 27903991.
32. Rani V, Deep G, Singh RK, Palle K, Yadav UC. 2016; Oxidative stress and metabolic disorders: pathogenesis and therapeutic strategies. Life Sci. 148:183–193. DOI: 10.1016/j.lfs.2016.02.002. PMID: 26851532.
crossref
33. de Cavanagh EM, Toblli JE, Ferder L, Piotrkowski B, Stella I, Inserra F. 2006; Renal mitochondrial dysfunction in spontaneously hypertensive rats is attenuated by losartan but not by amlodipine. Am J Physiol Regul Integr Comp Physiol. 290:R1616–R1625. DOI: 10.1152/ajpregu.00615.2005. PMID: 16410402.
crossref
34. Domingueti CP, Dusse LM, Carvalho M, de Sousa LP, Gomes KB, Fernandes AP. 2016; Diabetes mellitus: the linkage between oxidative stress, inflammation, hypercoagulability and vascular complications. J Diabetes Complications. 30:738–745. DOI: 10.1016/j.jdiacomp.2015.12.018. PMID: 26781070.
crossref
35. Sesaki H, Jensen RE. 1999; Division versus fusion: Dnm1p and Fzo1p antagonistically regulate mitochondrial shape. J Cell Biol. 147:699–706. DOI: 10.1083/jcb.147.4.699. PMID: 10562274. PMCID: PMC2156171.
crossref
36. Chen H, Chan DC. 2015; Emerging functions of mammalian mitochondrial fusion and fission. Hum Mol Genet. 14 Spec No. 2:R283–R289. DOI: 10.1093/hmg/ddi270. PMID: 16244327.
crossref
37. Yoon Y. 2004; Sharpening the scissors: mitochondrial fission with aid. Cell Biochem Biophys. 41:193–206. DOI: 10.1385/CBB:41:2:193.
crossref
38. Yoon Y. 2005; Regulation of mitochondrial dynamics: another process modulated by Ca2+ signals? Sci STKE. 2005:pe18. DOI: 10.1126/stke.2802005pe18. PMID: 15840838.
39. Riva A, Tandler B, Loffredo F, Vazquez E, Hoppel C. 2005; Structural differences in two biochemically defined populations of cardiac mitochondria. Am J Physiol Heart Circ Physiol. 289:H868–H872. DOI: 10.1152/ajpheart.00866.2004. PMID: 15821034.
crossref
40. Skulachev VP. 2001; Mitochondrial filaments and clusters as intracellular power-transmitting cables. Trends Biochem Sci. 26:23–29. DOI: 10.1016/S0968-0004(00)01735-7. PMID: 11165513.
crossref
41. Westermann B. 2002; Merging mitochondria matters: cellular role and molecular machinery of mitochondrial fusion. EMBO Rep. 3:527–531. DOI: 10.1093/embo-reports/kvf113. PMID: 12052774. PMCID: PMC1084147.
42. Vanhorebeek I, De Vos R, Mesotten D, Wouters PJ, De Wolf-Peeters C, Van den Berghe G. 2005; Protection of hepatocyte mitochondrial ultrastructure and function by strict blood glucose control with insulin in critically ill patients. Lancet. 365:53–59. DOI: 10.1016/S0140-6736(04)17665-4. PMID: 15639679.
crossref
43. Kelley DE, He J, Menshikova EV, Ritov VB. 2002; Dysfunction of mitochondria in human skeletal muscle in type 2 diabetes. Diabetes. 51:2944–2950. DOI: 10.2337/diabetes.51.10.2944. PMID: 12351431.
crossref
44. Senefeld J, Hunter SK. 2016; Molecular underpinnings of diabetic polyneuropathy. J Appl Physiol. 121:360. DOI: 10.1152/japplphysiol.00380.2016. PMID: 27451278.
crossref
45. Thanabalasingham G, Owen KR. 2011; Diagnosis and management of maturity onset diabetes of the young (MODY). BMJ. 343:d6044. DOI: 10.1136/bmj.d6044. PMID: 22012810.
crossref
46. Gutiérrez G, Mendoza C, Montaño LF, López-Marure R. 2007; Ceramide induces early and late apoptosis in human papilloma virus+ cervical cancer cells by inhibiting reactive oxygen species decay, diminishing the intracellular concentration of glutathione and increasing nuclear factor-kappaB translocation. Anticancer Drugs. 18:149–159. DOI: 10.1097/CAD.0b013e3280115111. PMID: 17159601.
47. Larsen NB, Rasmussen M, Rasmussen LJ. 2005; Nuclear and mitochondrial DNA repair: similar pathways? Mitochondrion. 5:89–108. DOI: 10.1016/j.mito.2005.02.002. PMID: 16050976.
crossref
48. Kim MM, Clinger JD, Masayesva BG, Ha PK, Zahurak ML, Westra WH, Califano JA. 2004; Mitochondrial DNA quantity increases with histopathologic grade in premalignant and malignant head and neck lesions. Clin Cancer Res. 10:8512–8515. DOI: 10.1158/1078-0432.CCR-04-0734. PMID: 15623632.
crossref
49. Kang BP, Frencher S, Reddy V, Kessler A, Malhotra A, Meggs LG. 2003; High glucose promotes mesangial cell apoptosis by oxidant-dependent mechanism. Am J Physiol Renal Physiol. 284:F455–F466. DOI: 10.1152/ajprenal.00137.2002. PMID: 12419773.
50. Wu Y, Qian Z, Fu S, Yue Y, Li Y, Sun R, Huang B, Yang D. 2018; IcarisideII improves left ventricular remodeling in spontaneously hypertensive rats by inhibiting the ASK1-JNK/p38 signaling pathway. Eur J Pharmacol. 819:68–79. DOI: 10.1016/j.ejphar.2017.11.035. PMID: 29175071.
crossref

Fig. 1

Electron micrographs of representative kidney sections from the experimental groups.

(A) Panel A’, control group; Panel B’, STZ-induced diabetic group; and Panel C’, STZ + 5 mg/kg/day of CTZ group treating for 12 weeks (6 rats per group); (B) quantification of thickness of glomerular basement membrane (GBM). All the figures are 20,000× magnification. Mean values within each column with different labels (a, b) are significantly different (p < 0.05). CTZ, cilostazol; STZ, streptozotocin; P, podocyte; G, GBM; M, mesangium; R, red blood cell; DR, diabetic rats.
KJPP-24-403-f1.tif
Fig. 2

Mitochondrion examination under electron micrographs of kidney sections.

(A) control group, (B) STZ-induced diabetic group, (C) STZ + 5 mg/kg/day of CTZ group (6 rats per group). All the photoes were taken at 50,000× magnification. CTZ, cilostazol; STZ, streptozotocin.
KJPP-24-403-f2.tif
Fig. 3

Effects of CTZ on the mtDNA copy number in diabetic nephropathy.

mtDNA obtained from rat kidneys were detected in RT-PCR of C, control; DR, diabetic rats; CTZ, cilostazol treated for 6 weeks (6 rats per group). The results were expressed as the mean ± standard deviation of three determinations. Mean values within each column with different labels (a, b) are significantly different (p < 0.05).
KJPP-24-403-f3.tif
Fig. 4

CTZ improves the expression of mitochondrial apoptotic proteins in diabetic nephropathy.

Immunoblot examination of Bax, Bcl-2, and caspase-3 in rat kidneys of C, control; DR, diabetic rats; CTZ, cilostazol treated for 12 weeks.
KJPP-24-403-f4.tif
Fig. 5

CTZ reduces the ROS in RMC caused by high glucose.

RMC was treated with 25 mM glucose along with various concentrations of CTZ for 24 h. The NADPH oxidase activity (A) and DCFDA assay (B) was conducted to detect the level of ROS. Mean values within each column with different labels (a–e) are significantly different (p < 0.05). The results were expressed as the mean ± standard deviation of three determinations. All data are normalized to the group of high glucose. CTZ, cilostazol; ROS, reactive oxygen species; RMC, rat mesangial cell; NADPH, nicotinamide adenine dinucleotide phosphate.
KJPP-24-403-f5.tif
Fig. 6

CTZ improves the expression of mitochondrial apoptotic proteins in high glucose treated RMC.

Immunoblot examination of Bax and Bcl-2 in RMC was performed after treating with high glucose and CTZ for 24 h. All quantitative determination were normalized to the group of 5 mM glucose. CTZ, cilostazol; RMC, rat mesangial cell.
KJPP-24-403-f6.tif
Fig. 7

CTZ decreases the level of NF-κB, TGF-β and TNF-α.

RMC cell was exposed to high glucose and variable concentration of CTZ. (A) The protein level of cellular TNF-α, TGF-β, IkB and NF-κB p65 were analyzed by immunoblot, the quantitative determination were normalized to the group of 5 mM glucose. The level of secreted (B) TGF-β and (C) TNF-α were determined by ELISA; the results were expressed as the mean ± standard deviation of three determinations and all data were normalized to the group of high glucose represented as 100%. Mean values within each column with different labels (a–d) are significantly different (p < 0.05). CTZ, cilostazol; RMC, rat mesangial cell.
KJPP-24-403-f7.tif
Table 1
The sequences of the primers and probes used in detecting mtDNA
Primer/probe Sequence (5’-3’)
Mitochondrial D-loop
Forward GGTTCTTACTTCAGGGCCATCA
Reverse GATTAGACCCGTTACCATCGAGAT
Probe 6FAM-TTGGTTTATCGTCCATACGTTCCCCTTA-TAMRA
β-actin
Forward GGGATGTTTGCTCCAACCAA
Reverse GCGCTTTTGACTCAAGGATTTAA
Probe VIC-CGGTCGCCTTCACCGTTCCAGTT-TAMRA

The words in bold are represented as probe.

TOOLS
Similar articles