

 PDF
PDF Citation
 Print
Print


INTRODUCTION
Many researchers have investigated the effects of temperature on the firing patterns and electrical activity of neurons in various animals including squid, snails, lobsters, frogs, Aplysia, locusts, and crayfish [1-6]. We previously explored the mechanisms of neuronal reactions governing beating, bursting, and chaotic responses to changes in temperature using abdominal ganglia of Aplysia as a model [7-9]. We performed quantitative analysis of temperature-dependent changes in beating and bursting signals by calculating the maximum and minimum values for 14 action potential (AP) parameters, as well as the interburst interval (IBI) [7]. To probe the mechanisms of temperature-dependent changes in spikes we simulated various spiking patterns, including beating-chaos and bursting-chaos, using a modified Chay-Lee model with temperature-dependent scaling factors [9]. We then performed computational simulations of bursting using a modified Plant model composed of equations with temperature-dependent scaling factors to mathematically clarify the temperature-dependent changes of bursting patterns in burst-firing neurons. The results revealed that the modified Plant model could mimic a variety of real experimental AP parameters with < 50% error, suggesting that this approach is suitable for explaining the bursting patterns observed in Aplysia R15 cells [8].
Interestingly, in our current experiments, bursting signals different from those acquired using R15 cells were obtained from non-specific cells in abdominal ganglia of Aplysia juliana. We observed a group of abnormal type 1 bursting signals composed of two different spikes with different interspike intervals (ISIs). In addition, we observed type 2 abnormal bursting composed of various multiplets. The changes in bursting patterns were reproducible when the temperature was swept repeatedly, and these changes appeared to be temperature-dependent. Next, we quantitatively analyzed the abnormal bursting parameters exhibiting temperature dependence. Although we could not construct a model to express the activities of type 1 abnormal bursting due to limitations with currently available techniques, we constructed a model to determine the mechanism of type 2 abnormal bursting after dividing the activities of type 2 abnormal bursting cells into two separate groups. To examine the temperature dependence of type 2 abnormal bursting, a modified Plant model was used to simulate the changes in abnormal bursting patterns associated with changes in temperature. While the Chay-Lee model mathematically explains how beating, bursting, and chaotic bursting action potentials occur in excitable cells, the Plant model mathematically explains normal bursting signals generated in Aplysia's R15 cell.
In the present study, we did not employ the Chay and Lee model because we could not observe the bursting-chaos phenomenon using our experimental setup, although the results were similar to previous data showing temperature-dependent changes in spike patterns [9]. Finally, we analyzed the components in the modified Plant model that successfully simulated the activity, and then explored the mechanism involved in temperature dependence of abnormal bursting in neurons.
Go to : 
METHODS
Animals and preparation of ganglia tissue
Aplysia juliana were obtained from the sea of Jeju-do in South Korea and were characterized by the presence of brown spots as well as by a characteristic odor [10]. They were stored in a 500 L seawater tank in the laboratory. Preparation of abdominal ganglia tissue for recording was performed as previously described [10,11] and was approved by the Institutional Animal Care and Use Committees at Jeju National University. Briefly, before dissection of abdominal ganglia, a volume of 0.38 M MgCl2 equivalent to half the bodyweight was injected into Aplysia as an anesthetic. Abdominal ganglia were removed by dissection and incubated at 34°C for 40 min in a solution comprising a 1:1 ratio of artificial seawater (ASW; 460 mM NaCl, 55 mM MgCl2, 11 mM CaCl2, 10 mM KCl, 10 mM HEPES, pH 7.6) and isotonic Leibovitz’s L-15 media (No. L-4386; Sigma-Aldrich Korea, Seoul, Korea) containing 1% protease (type IX; Sigma). The incubated abdominal ganglia were washed with ASW and placed in a VS-1203PIN incubator (Hanback Co., Daejeon, Korea) at 18°C. For the post-incubation process, specimens were pinned down and fixed on Sylgard plates (Dow Corning, Midland, MI, USA) in Petri dishes (50 × 9 mm) filled with ASW:L-15 (1:1).
Data acquisition
In each experiment, an abdominal ganglion was soaked in a Petri dish at room temperature, and the temperature was changed in each cycle. The temperature was measured with a PT100 temperature sensor connected to TRM-006, a digital thermometer (Toho, Kanagawa, Japan). The temperature was increased or decreased by a HMN3940 temperature control system (Acetec Co., Incheon, Korea). A BJ100-2J pump (Boading Longer Precision Pump Co., Hebei, China) was used to maintain the flow inside the petri dish. The flow rate was adjusted to 0.14 ml/min. Bursting activities were measured with glass intracellular electrodes filled with 3 M KCl and recorded with an NI PCI-6221 DAQ card (National Instruments, Austin, TX, USA) using LabVIEW software (National Instruments). The recording frequency was 3 kHz and 180,000 pairs of data per min were recorded. Simultaneously, signals were observed with a 54622A digital oscilloscope (Agilent, Colorado Springs, Colorado Springs, CO, USA). The overall status of datasets is presented in Table 1. The data were processed with Origin 6.0 (Microcal Software, Inc., Northampton, MA, USA) and a C++ program made by the authors.
Table 1
Overall descriptions of experiments
![]()
Overall description of experiments A to E
Previously we reported how the normal bursting pattern of R15 neurons in Aplysia juliana changes with periodic temperature stimulation [8]. In the present study, we sought to examine the bursting pattern of unspecified neurons in the abdominal ganglion of Aplysia juliana with periodic stimulation of temperature change. For this purpose, we got the recording data from Experiments A to E. The bursting observed in Experiments A to D showed type 1 abnormal bursting patterns and the bursting of Experiment E exhibited type 2 abnormal bursting.
Table 1 describes the details of each experiment and presents two parts of the data obtained from five different experiments (Experiments A to E); data recorded at room temperature and data recorded during a period of temperature change. The data obtained from each experiment at room temperature revealed a stable AP before the temperature sweep. At room temperature, the average temperature ranges were from 15.2°C to 21.4°C, the average amplitude was from 42.7 mV to 70.9 mV, the maximum amplitude was from 55.9 mV to 76.7 mV, and the duration was from 14 min to 244 min.
Amax (mV) is defined as the difference between the maximum and minimum value of the membrane potential recorded for 1 min. Further information on computational analysis was published previously [7-9]. For temperature sweep data acquisition, the average temperature change was between 15.2°C and 27.8°C, the average recording duration was 1,024 min, the average number of temperature change cycles was 9, the average number of spikes was 20,269, and the average total recording time was 1,783 min. Microsoft visual C++, Microcal Origin 6.0, and Mathematica 10.2 were used for data analysis, and results are presented as mean ± standard error (SE).
Specifications for experiment E (analysis of type 2 abnormal bursting)
During experiment E, 6,885 regular beatings were recorded at room temperature (~15°C) for 244 min, as shown in the 1st row in Table 2. In the pre-cycle (from room temperature to the maximum temperature, then to the minimum temperature), 2,159 spikes were recorded. While periodically applying a sweep of temperature change to neurons in every 2 h cycle, the pattern of action potential firing, which depends on the temperature, changed regularly; each cycle is composed of an increase in temperature from about 13°C (temperature value in the silent state, each element in the 2nd column in Table 2) to about 29°C (maximum temperature value, each element in the 7th column in Table 2) followed by a decrease to about 13°C (temperature value in the silent state, each element in the 12th column in Table 2). Briefly, the temperature was increased from about 13°C to about 29°C, then decreased to about 13°C. This cycle was continuously repeated for 44 cycles for 86 h.
Table 2
Specifications of experiment E
![]()
In the first three cycles, signals changed slightly after each cycle, and patterns did not show complete temperature dependence. After the 4th cycle, characteristic signals occurred repetitively at specific temperatures in each cycle. Therefore, although the total number of cycles was 44, we selected data from 34 of the 44 cycles and divided it into two halves (groups). To determine the temperature dependence and overall pattern change during the temperature change, we selected 34 cycles displaying stable activities (the 4th to the 37th cycle); cycles from the 4th to the 20th were assigned to the first group, and cycles from the 21th to the 37th were assigned to the second group. There were differences between signals from the first and second groups. In the first group signals appeared to be a mixture of two different patterns, and this was barely observed in the second group. Since these mixed signals became scarcer as the cycles proceeded, changes in patterns became more similar during each cycle. As summarized in Table 2, for experiment E the average minimum temperature was 12.9°C ± 0.1°C. The first spike appeared at an average temperature of 17.2°C ± 0.3°C after an average of 16.4 ± 1.0 min during the silent phase. An average of 62.6 ± 2.3 maximum numbers of spikes per min appeared at an average temperature of 23.7°C ± 3°C during the rising phase. An average of 29.0°C ± 0.1°C was the maximum temperature during the temperature change cycle. An average of 30.8 ± 1.1 maximum number of spikes per min appeared at an average of 24.7°C ± 1.8°C in the lowering phase. Below an average of 19.9°C ± 0.2°C, no further spiking appeared. In a last silent phase of the cycle, the average duration was 24.3 ± 0.5 min and the average minimum temperature was 12.9°C ± 0.1°C.
Modified Plant model for simulation of type 2 abnormal bursting
To simulate the temperature-dependent bursting patterns of neurons in Aplysia, we modified the Plant model [12,13] with temperature-dependent scaling factors [7,8,14]. The Plant model was used previously to analyze fast and slow processes during parabolic bursting [15]. In our present study, the components of the modified Plant model include a fast sodium current INa, a fast potassium current IK, a slow inward calcium current ICa, calcium-activated potassium current IK(Ca), and leak current, ICl.
(1)
-Cm=ρ(T)(INa+ICa+IK+IK(Ca))+ICl=ρ(T){_gNa·m3∞(V)·h(V-VNa)+_gCa·χ(V-VCa)+(_gK·n4+_gK(Ca)(V-VK))}+_gCl(V-VCl)where
(3)
m∞(V)=aam1-c1V(t)-c2Em1-c1V(t)-c210-1aam1-c1V(t)-c2Em1-c1V(t)-c210-1+4Em2-c1V(t)-c2m3,h∞(V)=bbEh1-c1V(t)-c220bbEh1-c1V(t)-c220+1Eh2-c1V(t)-c210+1,χ∞(V)=1Ea{b-V(t)}+1,n∞(V)=ccc5-c1V(t)-c2Ec5-c1V(t)-c2c8-1ccc5-c1V(t)-c2Ec5-c1V(t)-c2c8-1+ddEc6-c1V(t)-c2c7,and
(4)
τh(V)=_τhbbEh1-c1V(t)-c220+1Eh2-c1V(t)-c210+1,τn(V)=_τnccc5-c1V(t)-c2Ec5-c1V(t)-c2c8-1+ddEc6-c1V(t)-c2c7.where V represents the membrane potential, and VNa, VCa, VK, and VCl are the reversal potentials for the Na+, Ca2+, K+, and Cl– currents, respectively. _gNa, _gCa, _gK, and _gCl are the maximal conductances for the respective currents, and _gK(Ca) is the maximal conductance for the calcium-activated potassium current. The voltage-dependent activation and inactivation variables are expressed as m and h, respectively. The activation variable for the potassium channels is n. The slow activating conductance for the calcium current is expressed as χ.
Ca, which denotes the intracellular free calcium concentration, is treated as a parameter. The maximal relaxation time constants of h and n are represented by _τh and _τn, respectively, and ρ–1 is an estimation of the time-constant of the Ca equation. The temperature-dependent scaling factor ρ(T) is defined as ρ(T)≡1.3T-T010°C, and is also defined as φ(T)≡3T-T010°C [7,8]. The steady-state values of activation (inactivation) variables –m∞, χ∞, and n∞(h∞) are functions of voltage. τh, τχ, and τn are relaxation time constants. Constant values for defining equations for steady-state values of activation (inactivation) variables and relaxation constants are represented by aa, bb, cc, dd, c1, c2, m1, m2, m3, h1, h2, c5, c6, c7, c8, etc.
Glossary for equations
A, action potential amplitude
Aave, averaged action potential amplitude
Amax, maximum action potential amplitude
Ca, slow change in intracellular free calcium concentration
ICa, slow inward calcium current
IK, fast potassium current
IK(Ca), calcium-activated potassium current
ICl, leak current
INa, fast sodium current
T0, reference temperature (= 21.6°C)
V, membrane potential
VCa, reversal potential for calcium current
VK, reversal potential for potassium current
VCl, reversal potential for leak current
VNa, reversal potential for sodium current
Vmin, membrane potential at the negative peak
Cm, membrane capacitance
_gCa, maximal conductance for calcium ion current
_gK, maximal conductance for potassium ion current
_gK(Ca), maximal conductance for calcium activated potassium ion current
_gCl, maximal conductance for leak current
_gNa, maximal conductance for sodium ion current
h, voltage-dependent inactivation variable for sodium channel
m, voltage-dependent activation variable for sodium channel
n, activation variable for potassium channel
Kp, dissociation constant
Kc, constant values involved in the calcium ion concentration
aa, bb, cc, dd, a, b, c1, c2, m1, m2, m3, h1, h2, c5, c6, c7, c8, constant values involved in defining an equation for steady-state values of activation (inactivation) variables and relaxation constants
_τh, maximal relaxation time constant of h
_τn, maximal relaxation time constant of n
τh, τχ, τn, relaxation constant of h, χ, and n respectively
χ, slowly activating conductance for calcium current
ρ–1, estimation for the time-constant of the Ca-equation
ρ(T), temperature-dependent scaling factor; ρ(T)≡1.3T-T010°C
φ(T), temperature-dependent scaling factor; φ(T)≡3T-T010°C
Go to :
RESULTS
General characteristics of type 1 abnormal bursting in experiments A to D
First of all, in the present study, not only parabolic bursting observed in R15 cells in Aplysia but also bursting that exhibits regular bursting activity such as square-wave bursting and elliptic bursting will be referred to as a normal bursting. Otherwise, all other irregular bursting signals that can be measured in abdominal ganglion cells of Aplysia will be referred to as abnormal bursting and we classified the abnormal bursting patterns to type 1 and type 2. Briefly, type 1 abnormal single bursting is defined as a bursting composed of electrical firings having a relatively a long ISI followed by regular electrical signals with a short ISI in the active phase of bursting. Type 2 abnormal single bursting is similar to a normal bursting when macroscopically looking at the spiking pattern of the active phase of bursting, but it consists of a wide variety of multiplets such as a doublet, triplet, and so on.
Fig. 1 shows representative patterns of type 1 abnormal bursting composed of two kinds of spike components with a long ISI followed by short ISI regular firings at different specific temperatures, which were obtained from experiments A to D. The experimental details of experiments A to D are given in Table 1. Fig. 1A and D shows similar firing patterns for different temperatures during recording. In Fig. 1A, the bursting duration is shorter in the low-frequency spike component of the burst with a long ISI, and longer in the high-frequency spike component with a short ISI, compared with each bursting component of the single burst shown in Fig. 1D. In Fig. 1C, the ISI is irregular in the low-frequency spike component, and the amplitudes of the high-frequency spike component are smaller than those of the other bursting patterns in Fig. 1. Additionally, the burst durations in Fig. 1B are shorter than those of the other bursting events in Fig. 1. As mentioned above, data from experiments A to D are similar. However, since the number of spikes and the number of temperature change cycles in experiment D was greater than those in Experiment A, and other parameters were more stable (Table 1), we further analyzed the results of experiment D.
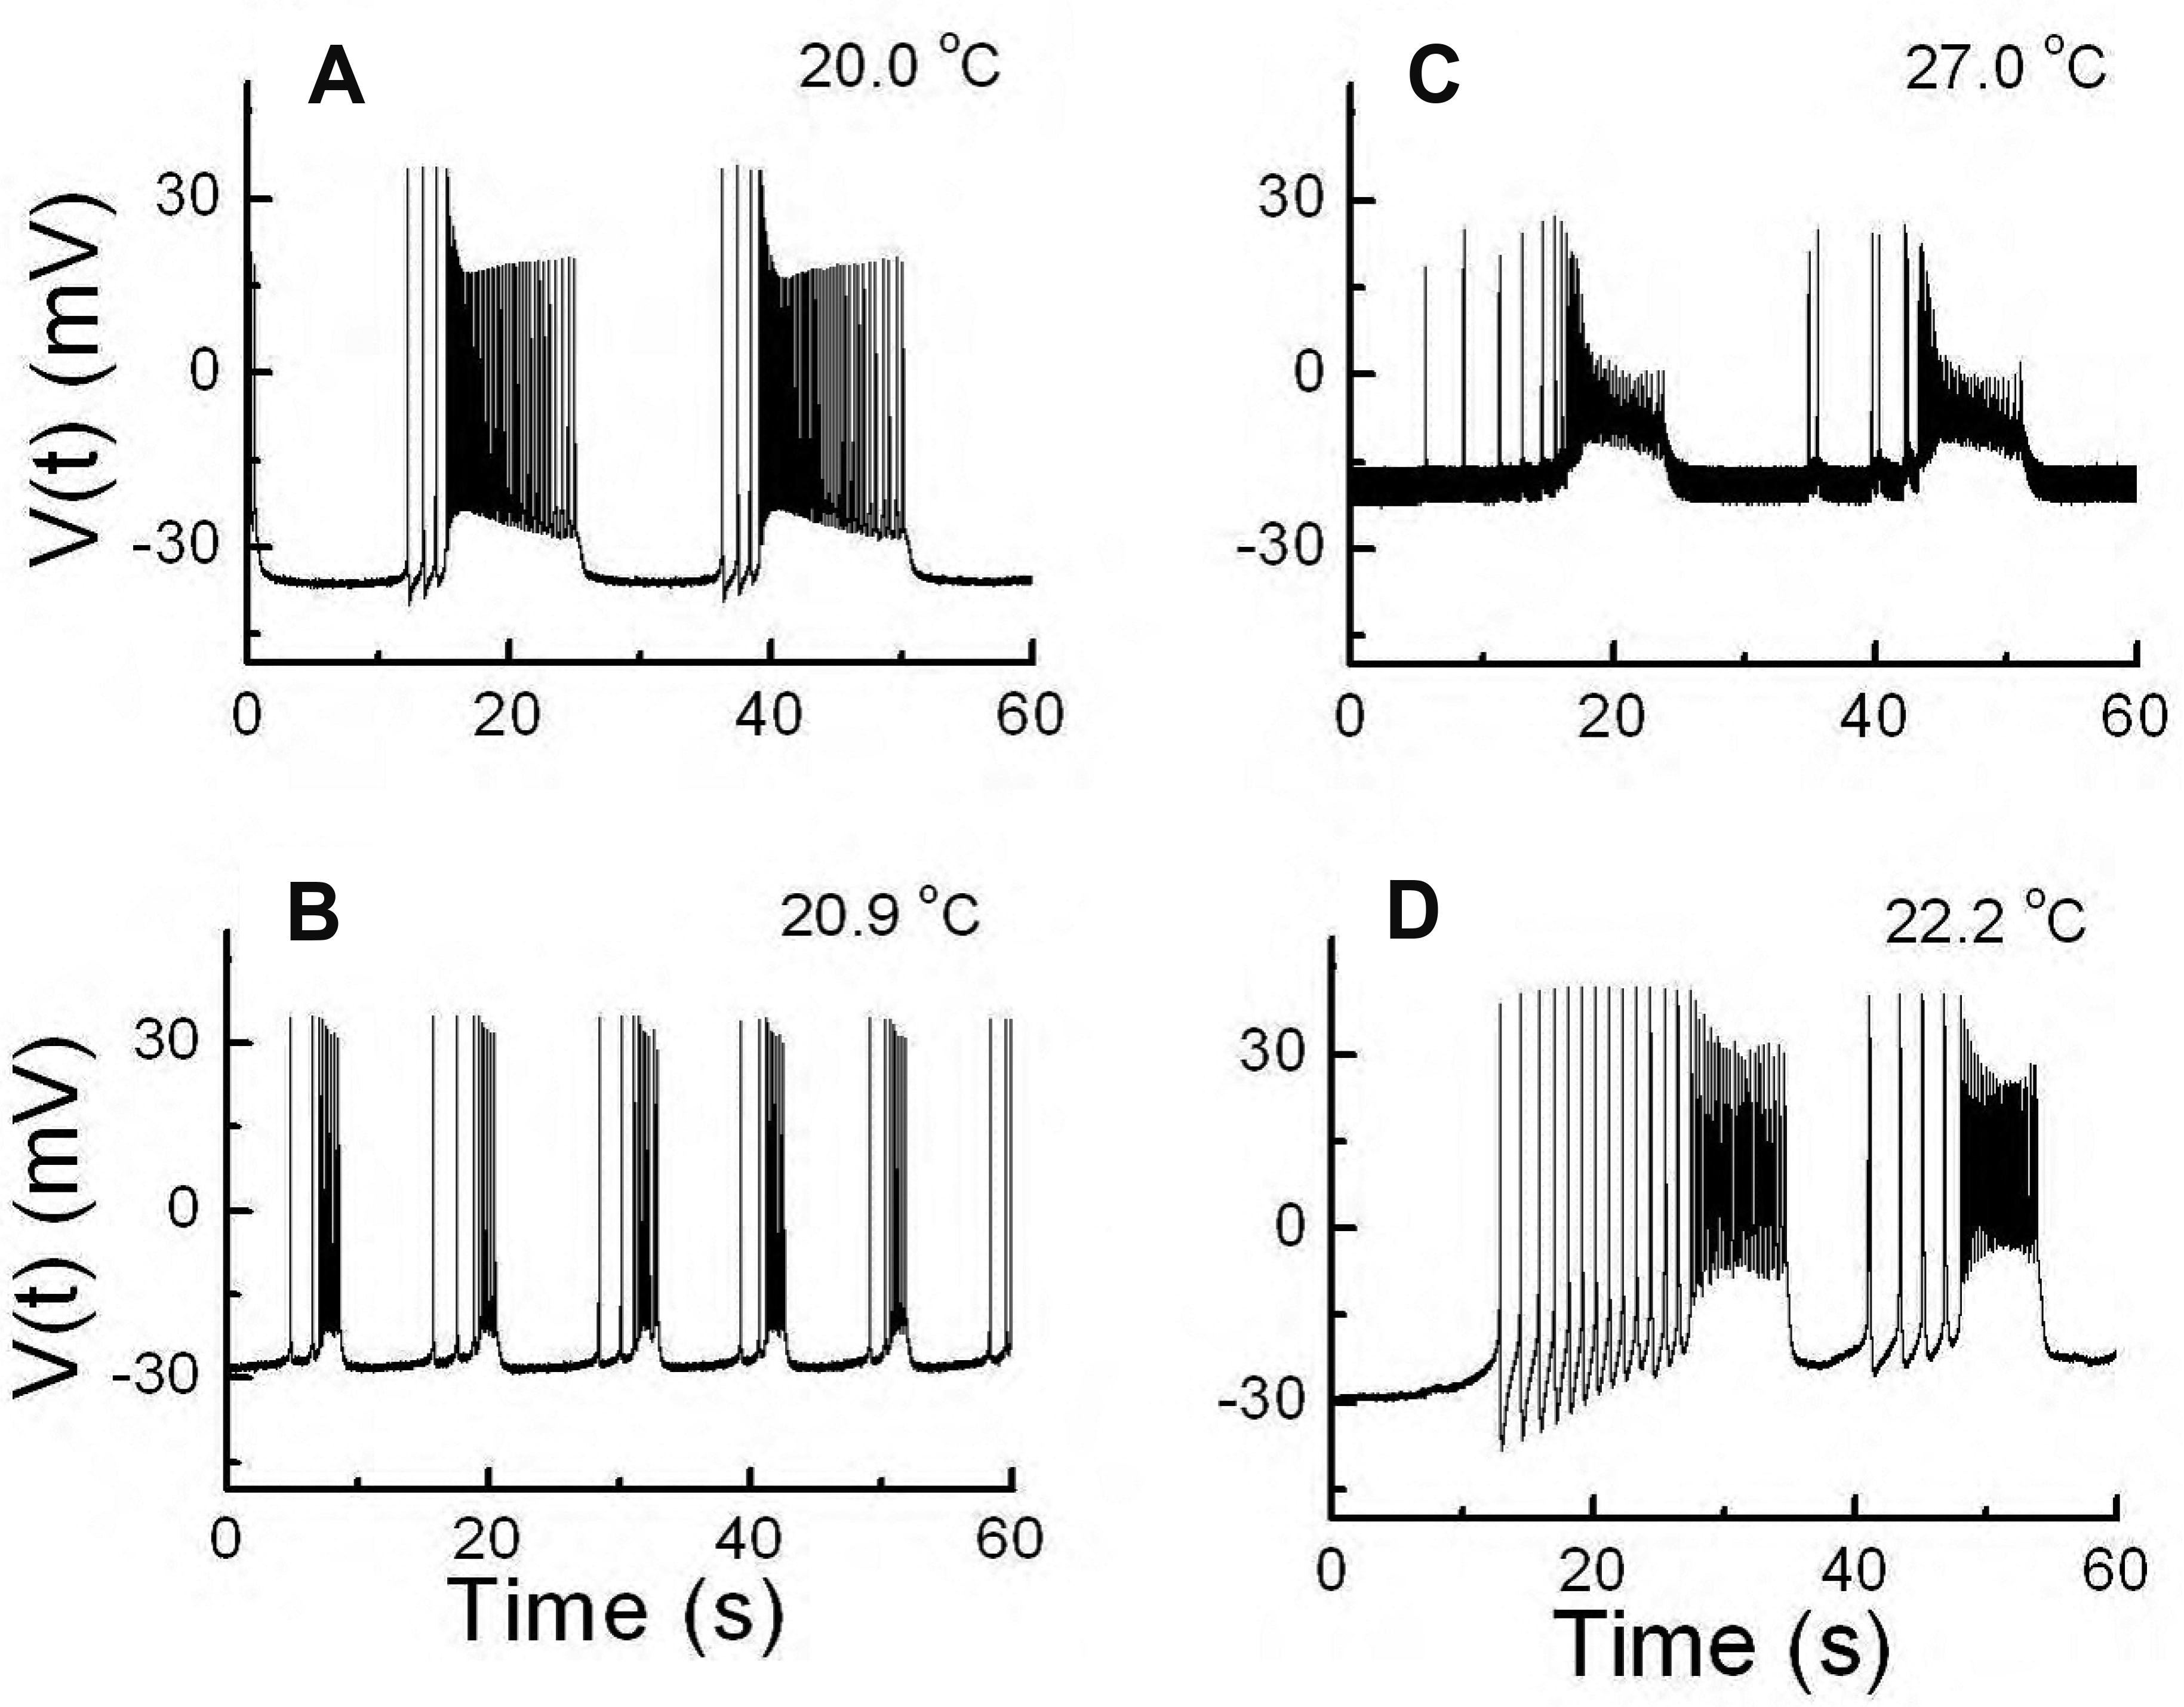
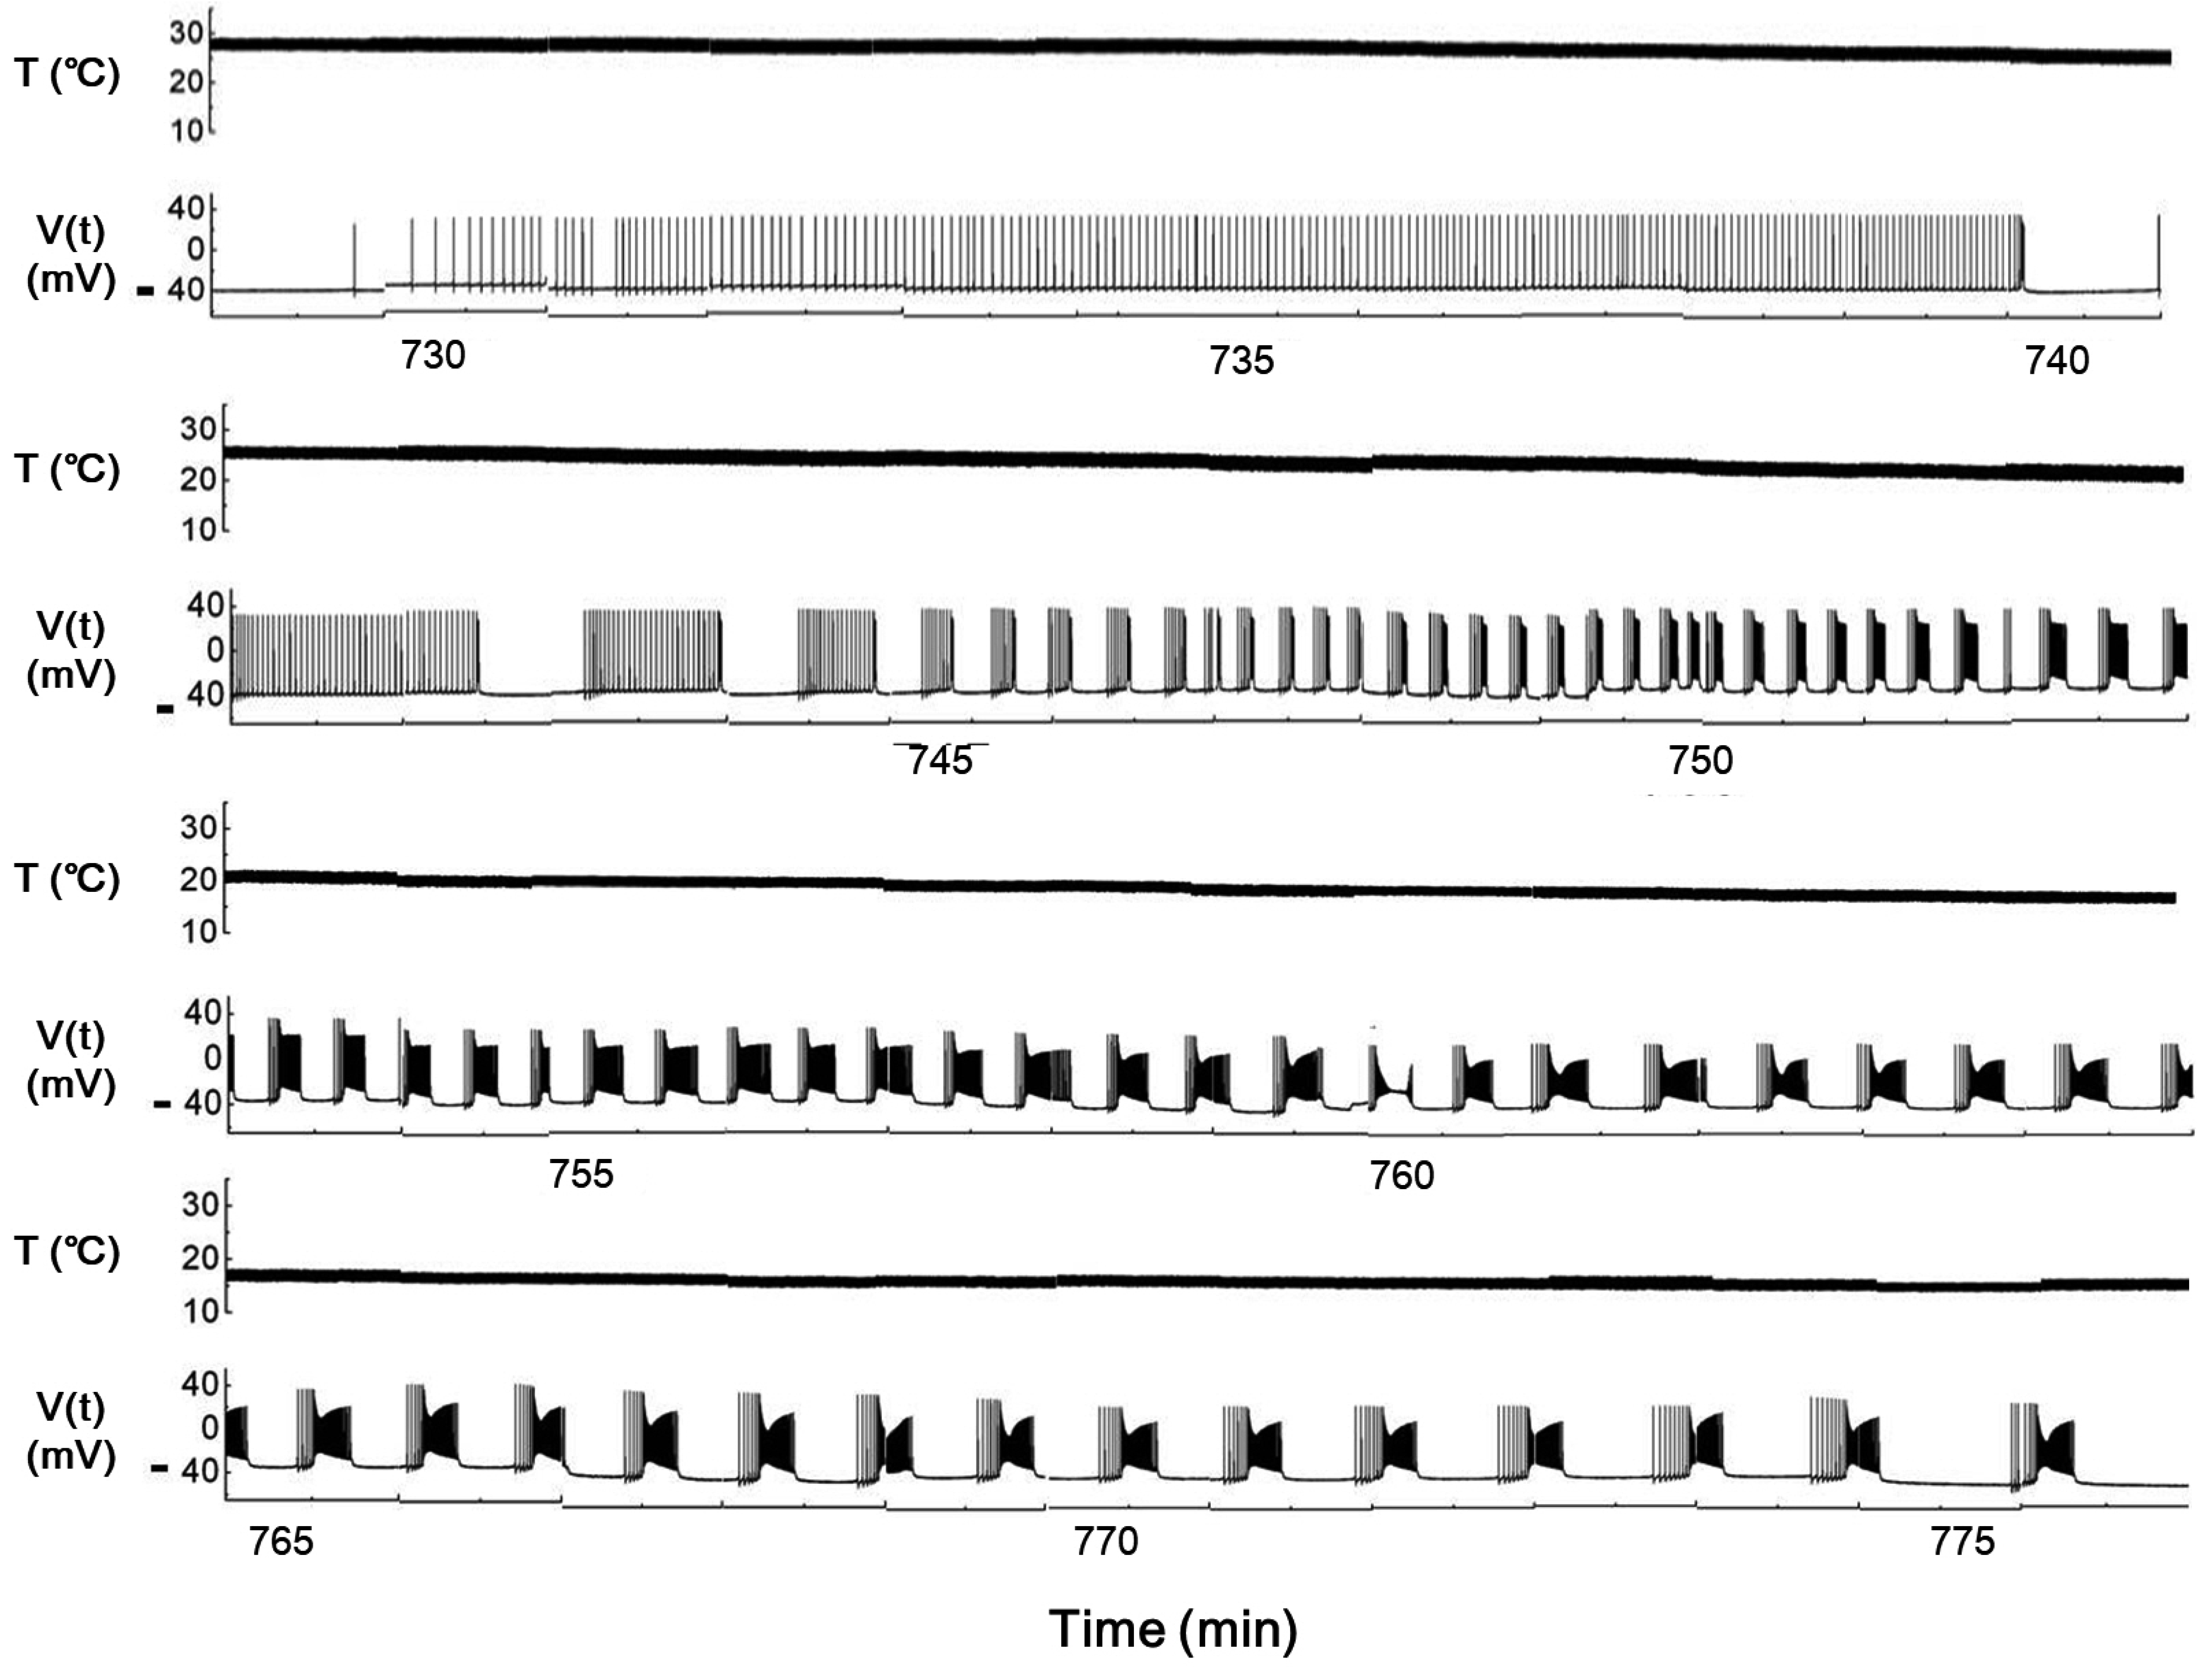
During experiment D, data obtained from 696 min to 1,044 min were processed manually using Microcal Origin 6.0. Fig. 2 presents the overall change in spiking pattern following a temperature sweep from the highest temperature to the lowest temperature (data recorded from 729 min to 776 min in experiment D). At high temperatures beating was dominant (Fig. 2, 1st row). As the temperature decreased, there were low-frequency beatings with long durations followed by high-frequency beatings with short durations (Fig. 2, 2nd row). As the temperature was further decreased, the duration of low-frequency bursting became shorter, and the duration of high-frequency bursting became longer (Fig. 2, 3rd row). At the lowest temperature, the duration of low-frequency bursting was longer than at high temperature, and the patterns of high-frequency bursting were distorted (Fig. 2, 4th row).
Temperature-dependent changes in bursting parameters in type 1 abnormal bursting
Fig. 3 shows the temperature dependence of various bursting parameters in type 1 abnormal bursting. Fig. 3A–D illustrate the characteristics of bursting parameters in the rising and lowering phase. The IBI decreased as the temperature increased in both rising and lowering phases, and it was higher in the rising phase than in the lowering phase (Fig. 3A). The number of bursts per min increased and then decreased as temperature increased, and it was higher in the lowering phase until it reached the maximum value around 22°C (Fig. 3B). The duration of whole bursts decreased in the rising phase as temperature increased, but in the lowering phase it also decreased as temperature increased, but increased dramatically above 24°C (Fig. 3C). The frequency showed similar changes in pattern to the number of bursts per min as temperature increased (Fig. 3D).
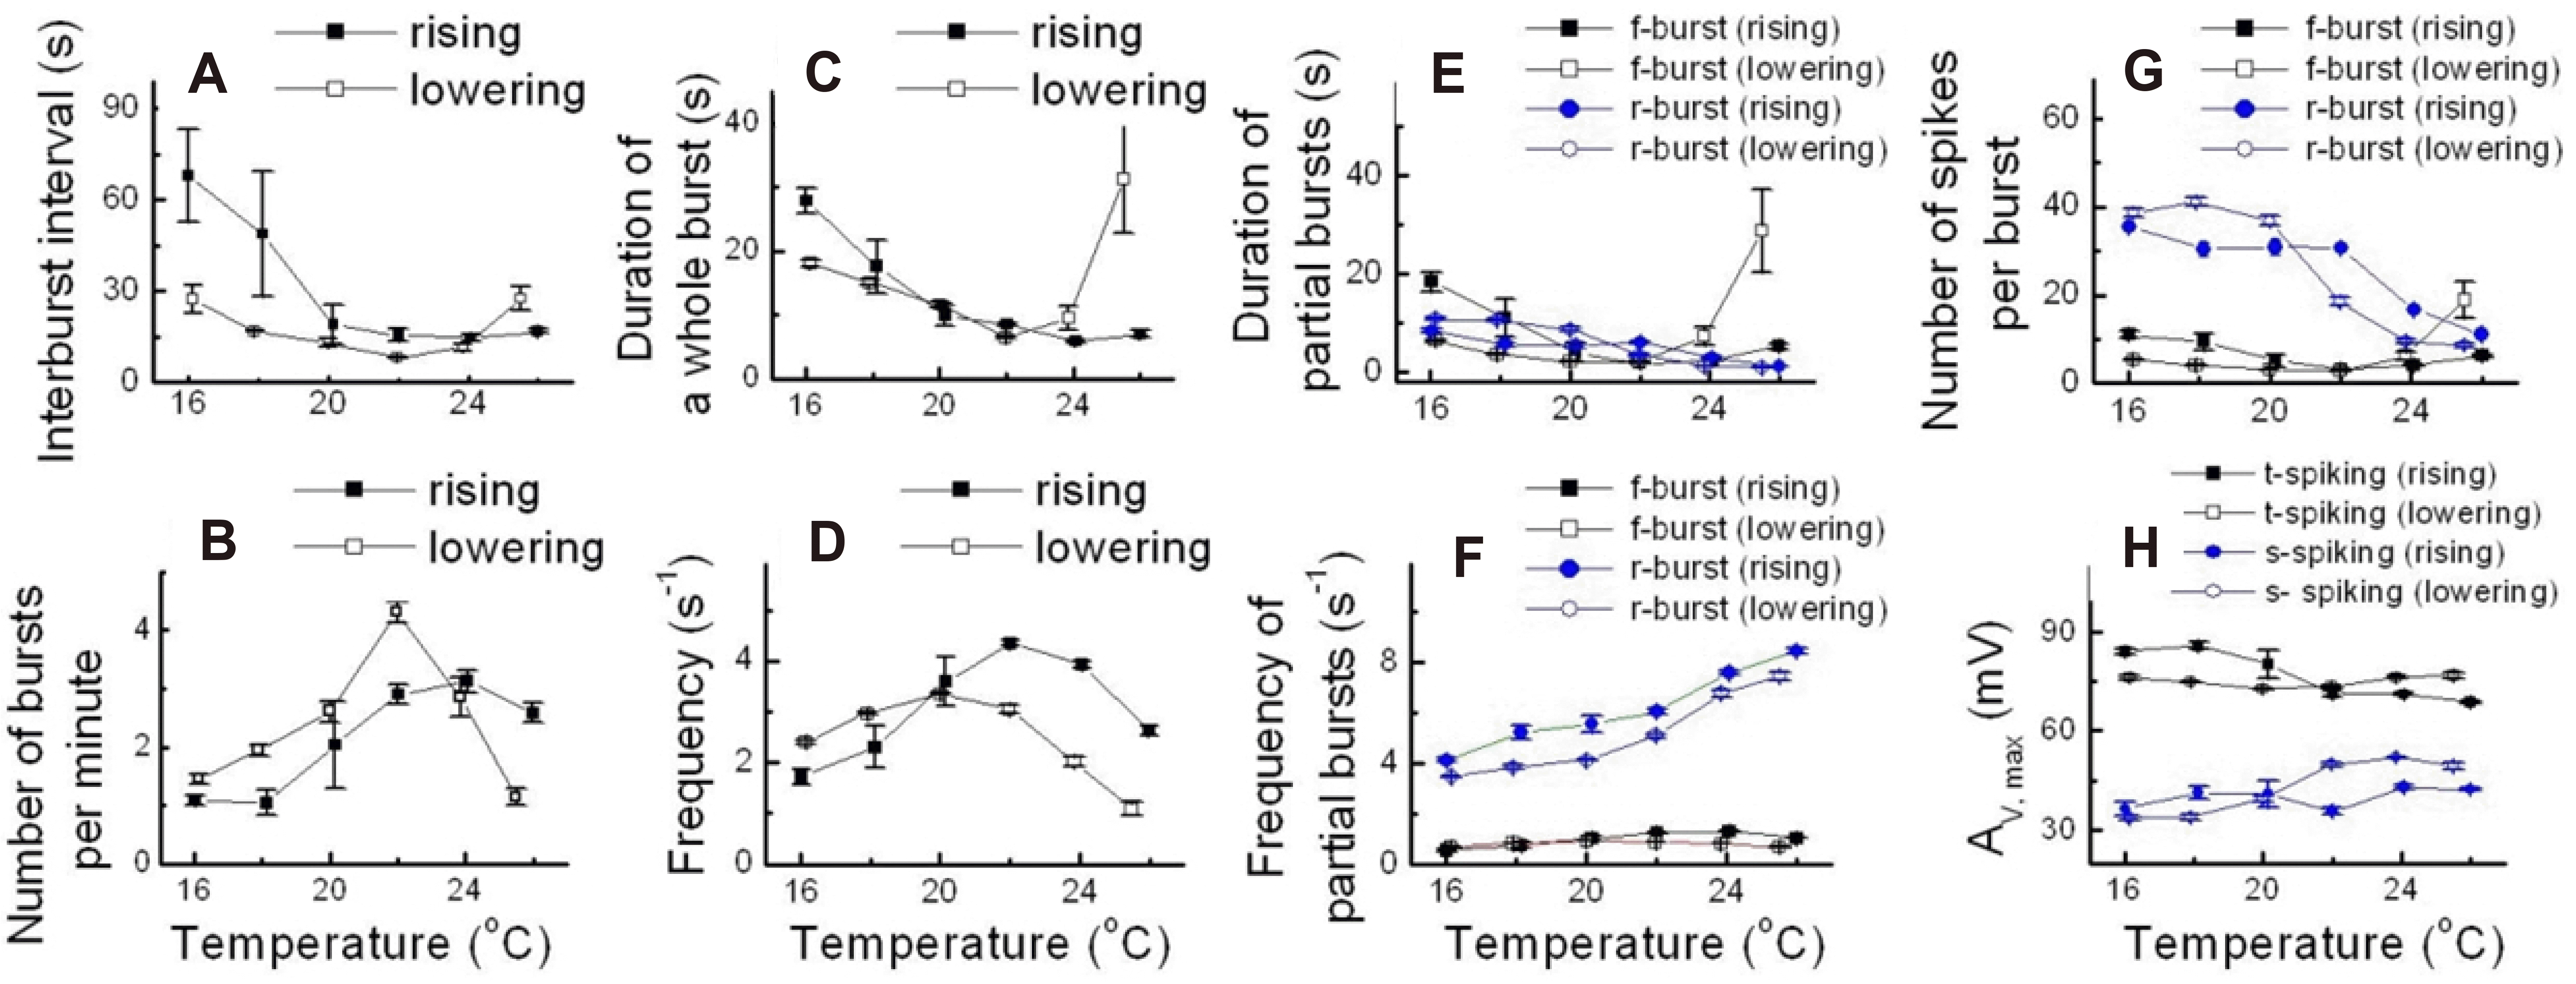 | Fig. 3Temperature-dependent change of various parameters in type 1 abnormal burst.Data were obtained from experiment D. (A) Interburst interval. (B) Number of bursts per minute. (C) Duration of a whole burst. (D) Frequency. (E) Duration of partial bursts. (F) Frequency of partial bursts. (G) Number of spikes per burst. (H) Av,max, maximum action potential amplitude.
|
Fig. 3E–H show the analysis of a low-frequency burst (f-burst) and a high-frequency burst (r-burst). The duration of a partial burst decreased in the r-burst of the rising and lowering phase and in the f-burst of the rising phase as the temperature increased. By contrast, in the f-burst of the lowering phase the duration of a partial burst increased as the temperature increased, and it was markedly increased over 24°C (Fig. 3E). We assume that the increase in the duration of the whole burst in the lowering phase over 24°C (Fig. 3C) was due to the increase in duration of the f-burst in the lowering phase (Fig. 3E). Fig. 3F shows that the frequency of the partial burst in the r-burst increased as the temperature increased, but remained unchanged in the f-burst as the temperature changed (Fig. 3F). In general, the number of spikes per burst decreased in both phases of the r-burst and the rising phase of the f-burst as the temperature increased, while in the lowering phase of the f-burst as the temperature increased, but increased from 22°C (Fig. 3G). Interestingly, the frequency and number of spikes were much higher in the r-burst than in the f-burst, indicating a higher frequency burst in both phases in the r-burst compared to the f-burst (Fig. 3F, G).
Next, we analyzed the spike of the low-frequency burst (t-spiking) and the spike of the high-frequency burst (s-spiking) in the partial burst. The maximum amplitude in t-spiking decreased in the rising phase, whereas it increased in the lowering phase of t-spiking, and in both phases of the s-spiking as the temperature increased (Fig. 3H). In contrast to the frequency and number of spikes, the maximum amplitude was much higher in the spikes of low-frequency bursts than in those of high-frequency bursts.
General characteristics of type 2 abnormal bursting in experiment E
To calculate changes in various parameters upon changes in temperature, data from 34 temperature change cycles were split into two halves (groups); the first half was from the 4th cycle to the 20th cycle, and the second half was from the 21st cycle to the 37th cycle (Specifications for experiment E [analysis of type 2 abnormal bursting] in METHODS). Fig. 4A and B show the representative spiking patterns obtained in the 10th cycle of the first group, and in the 34th cycle of second group, during temperature change from the minimum (13°C) to the maximum (29°C), followed by the minimum (13°C). Table 2 shows data obtained from each temperature change cycle during experiment E. Cells exhibited complicated patterns of action potential firings following an increase in temperature, which were more complicated than those following a decrease in temperature. In addition, the patterns of activity generated by increasing the temperature were quite different from those obtained by decreasing the temperature. When the temperature was increased to 29°C from 13°C, we observed a variety of abnormal bursting signals indicating vigorous activity with a short IBI, specifically multiplets mixed with singlets, doublets, and so on. When the temperature was decreased from 29°C to 13°C, abnormal bursting signals yielded more simplified patterns with a longer IBI compared with those observed when the temperature was increased. The patterns of activity generated by an increase or a decrease in temperature were more consistent than the results of each cycle (Table 2). We defined these abnormal bursting signals composed of multiplets as type 2 abnormal bursts. A typical example of a type 2 abnormal single burst is the single burst generated at 21.6°C, labeled with a yellow box in Fig. 4A, consisting of one singlet, one quartet, one pentet, two doublets, and three triplets (Fig. 4A, inset, (a), (b), (c), (d), and (e), respectively in the enlarged view of type 2 abnormal single burst). As the experiment progressed, the peak values of the average amplitude per cycle gradually decreased. The duration of tranquility that persisted after the onset of temperature increase (i.e., the duration which is needed to generate the first spike after starting a temperature sweep) gradually lengthened from the early cycles (Fig. 4A) to the late cycles (Fig. 4B) in experiment E. The duration of tranquility observed following a decrease in temperature was comparable to that during an increase in temperature in each cycle (Fig. 4A, B).
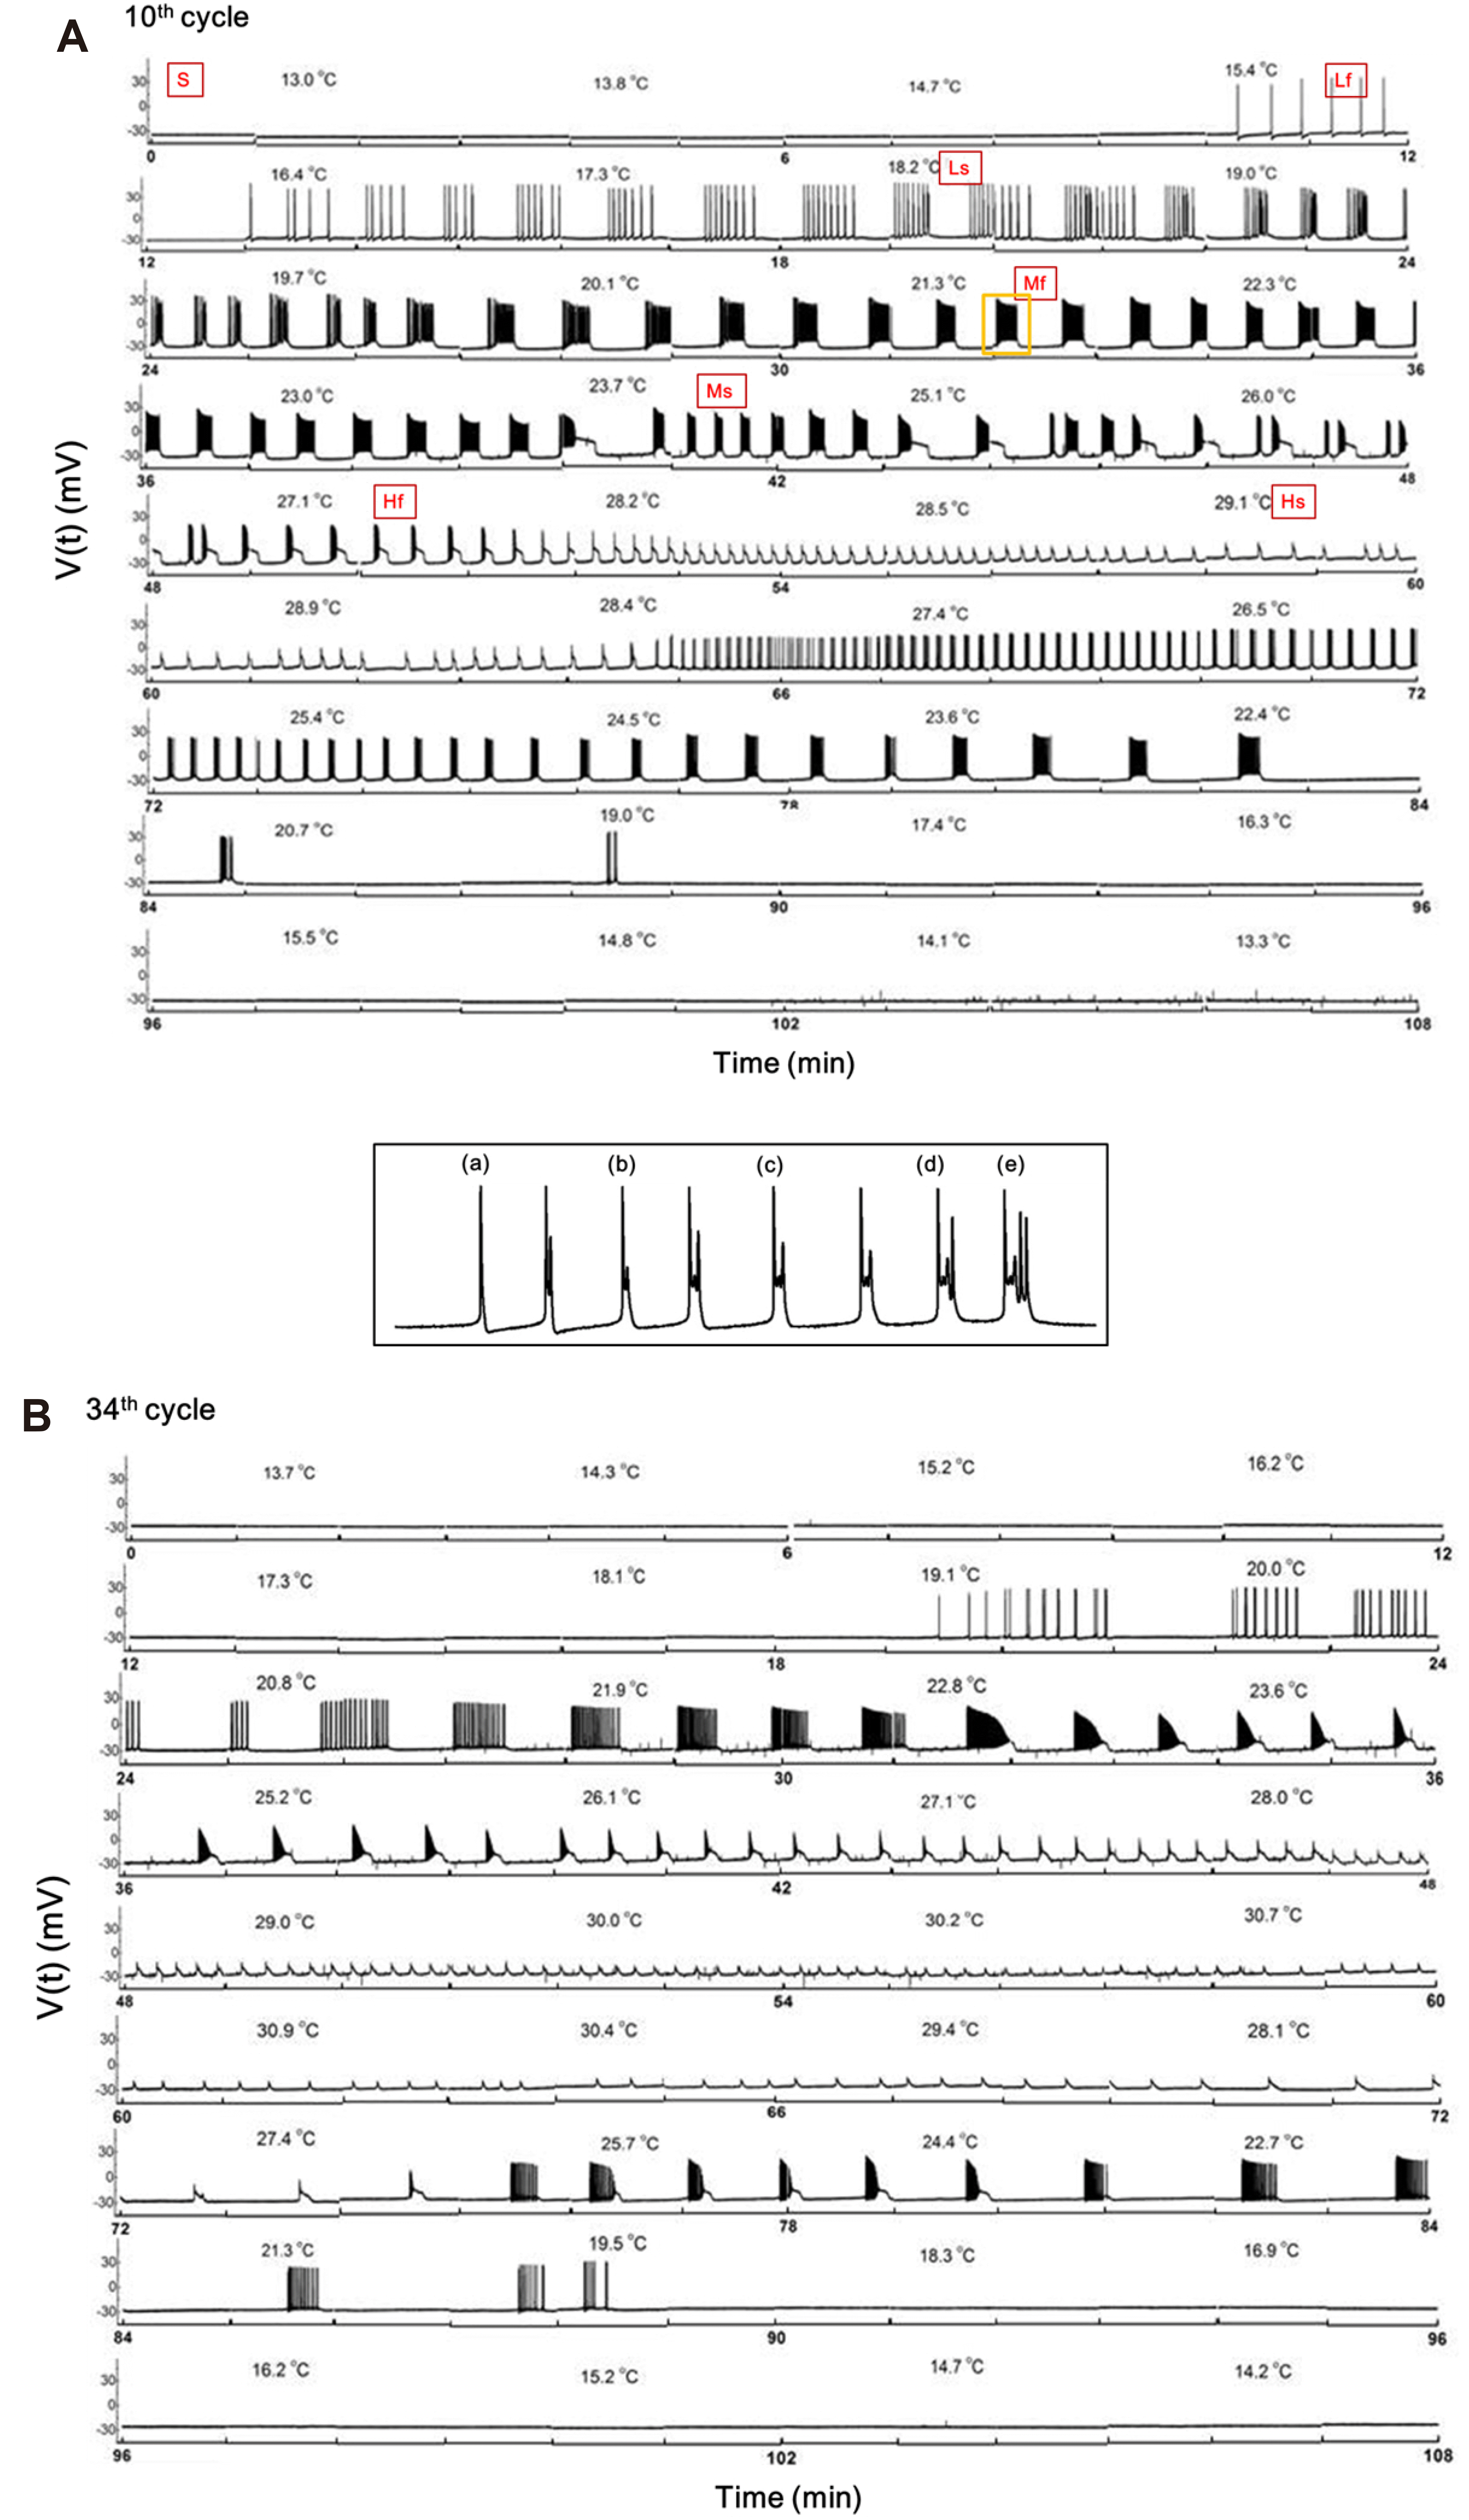 | Fig. 4A representative type 2 abnormal burst from each experiment E.(A, B) Overall type 2 abnormal bursting pattern in response to temperature change obtained from the 10th cycle (A) and 34th cycle (B) during experiment E. Differences in the pattern between in the rising phases and lowering phase of temperature can be observed during the 10th cycle, but the 34th cycle shows a more simplified pattern than the 10th cycle. Inset in (A), an example of a typical type 2 abnormal single burst composed of (a) a singlet, (b) a doublet, (c) a triplet, (d) a quartet, and (e) a pentet.
|
Temperature-dependent changes in type 2 abnormal bursting patterns
As shown in Fig. 5A, the IBI was higher in the lowering phase than in the rising phase in the first and second half. Between 20°C and 25°C, the IBI was higher in the rising phase in the second half than in the rising phase in the first half (Fig. 5A). In Fig. 5B, Vmin is between –24 mV and –28 mV, except values at the lowest and highest temperatures. Vmin was slightly increased during the lowering phase in the first half, and in both phases in the second half, as the temperature increased (Fig. 5B). The maximum amplitude decreased in both phases of total cycles as the temperature increased. However, the maximum amplitudes in the first half were higher than in the second half. The values for the rising and lowering phases of the first and second groups were similar (Fig. 5C). The average amplitudes decreased in both phases of the first and second groups as temperature increased, and the average amplitudes were higher in the lowering phase than in the rising phase in first and second halves (Fig. 5D). The overall number of spikes per cycle generally decreased as the cycles progressed, but it fluctuated more in the first half than the second half (Fig. 5E), although the exact reason was not identified. Before the 30th cycle, the temperature at which the last spike occurred in the lowering phase (LST) was greater than the temperature at which the first spike occurred in the rising phase (FST), and after the 30th cycle the LST and FST were similar (Fig. 5F).
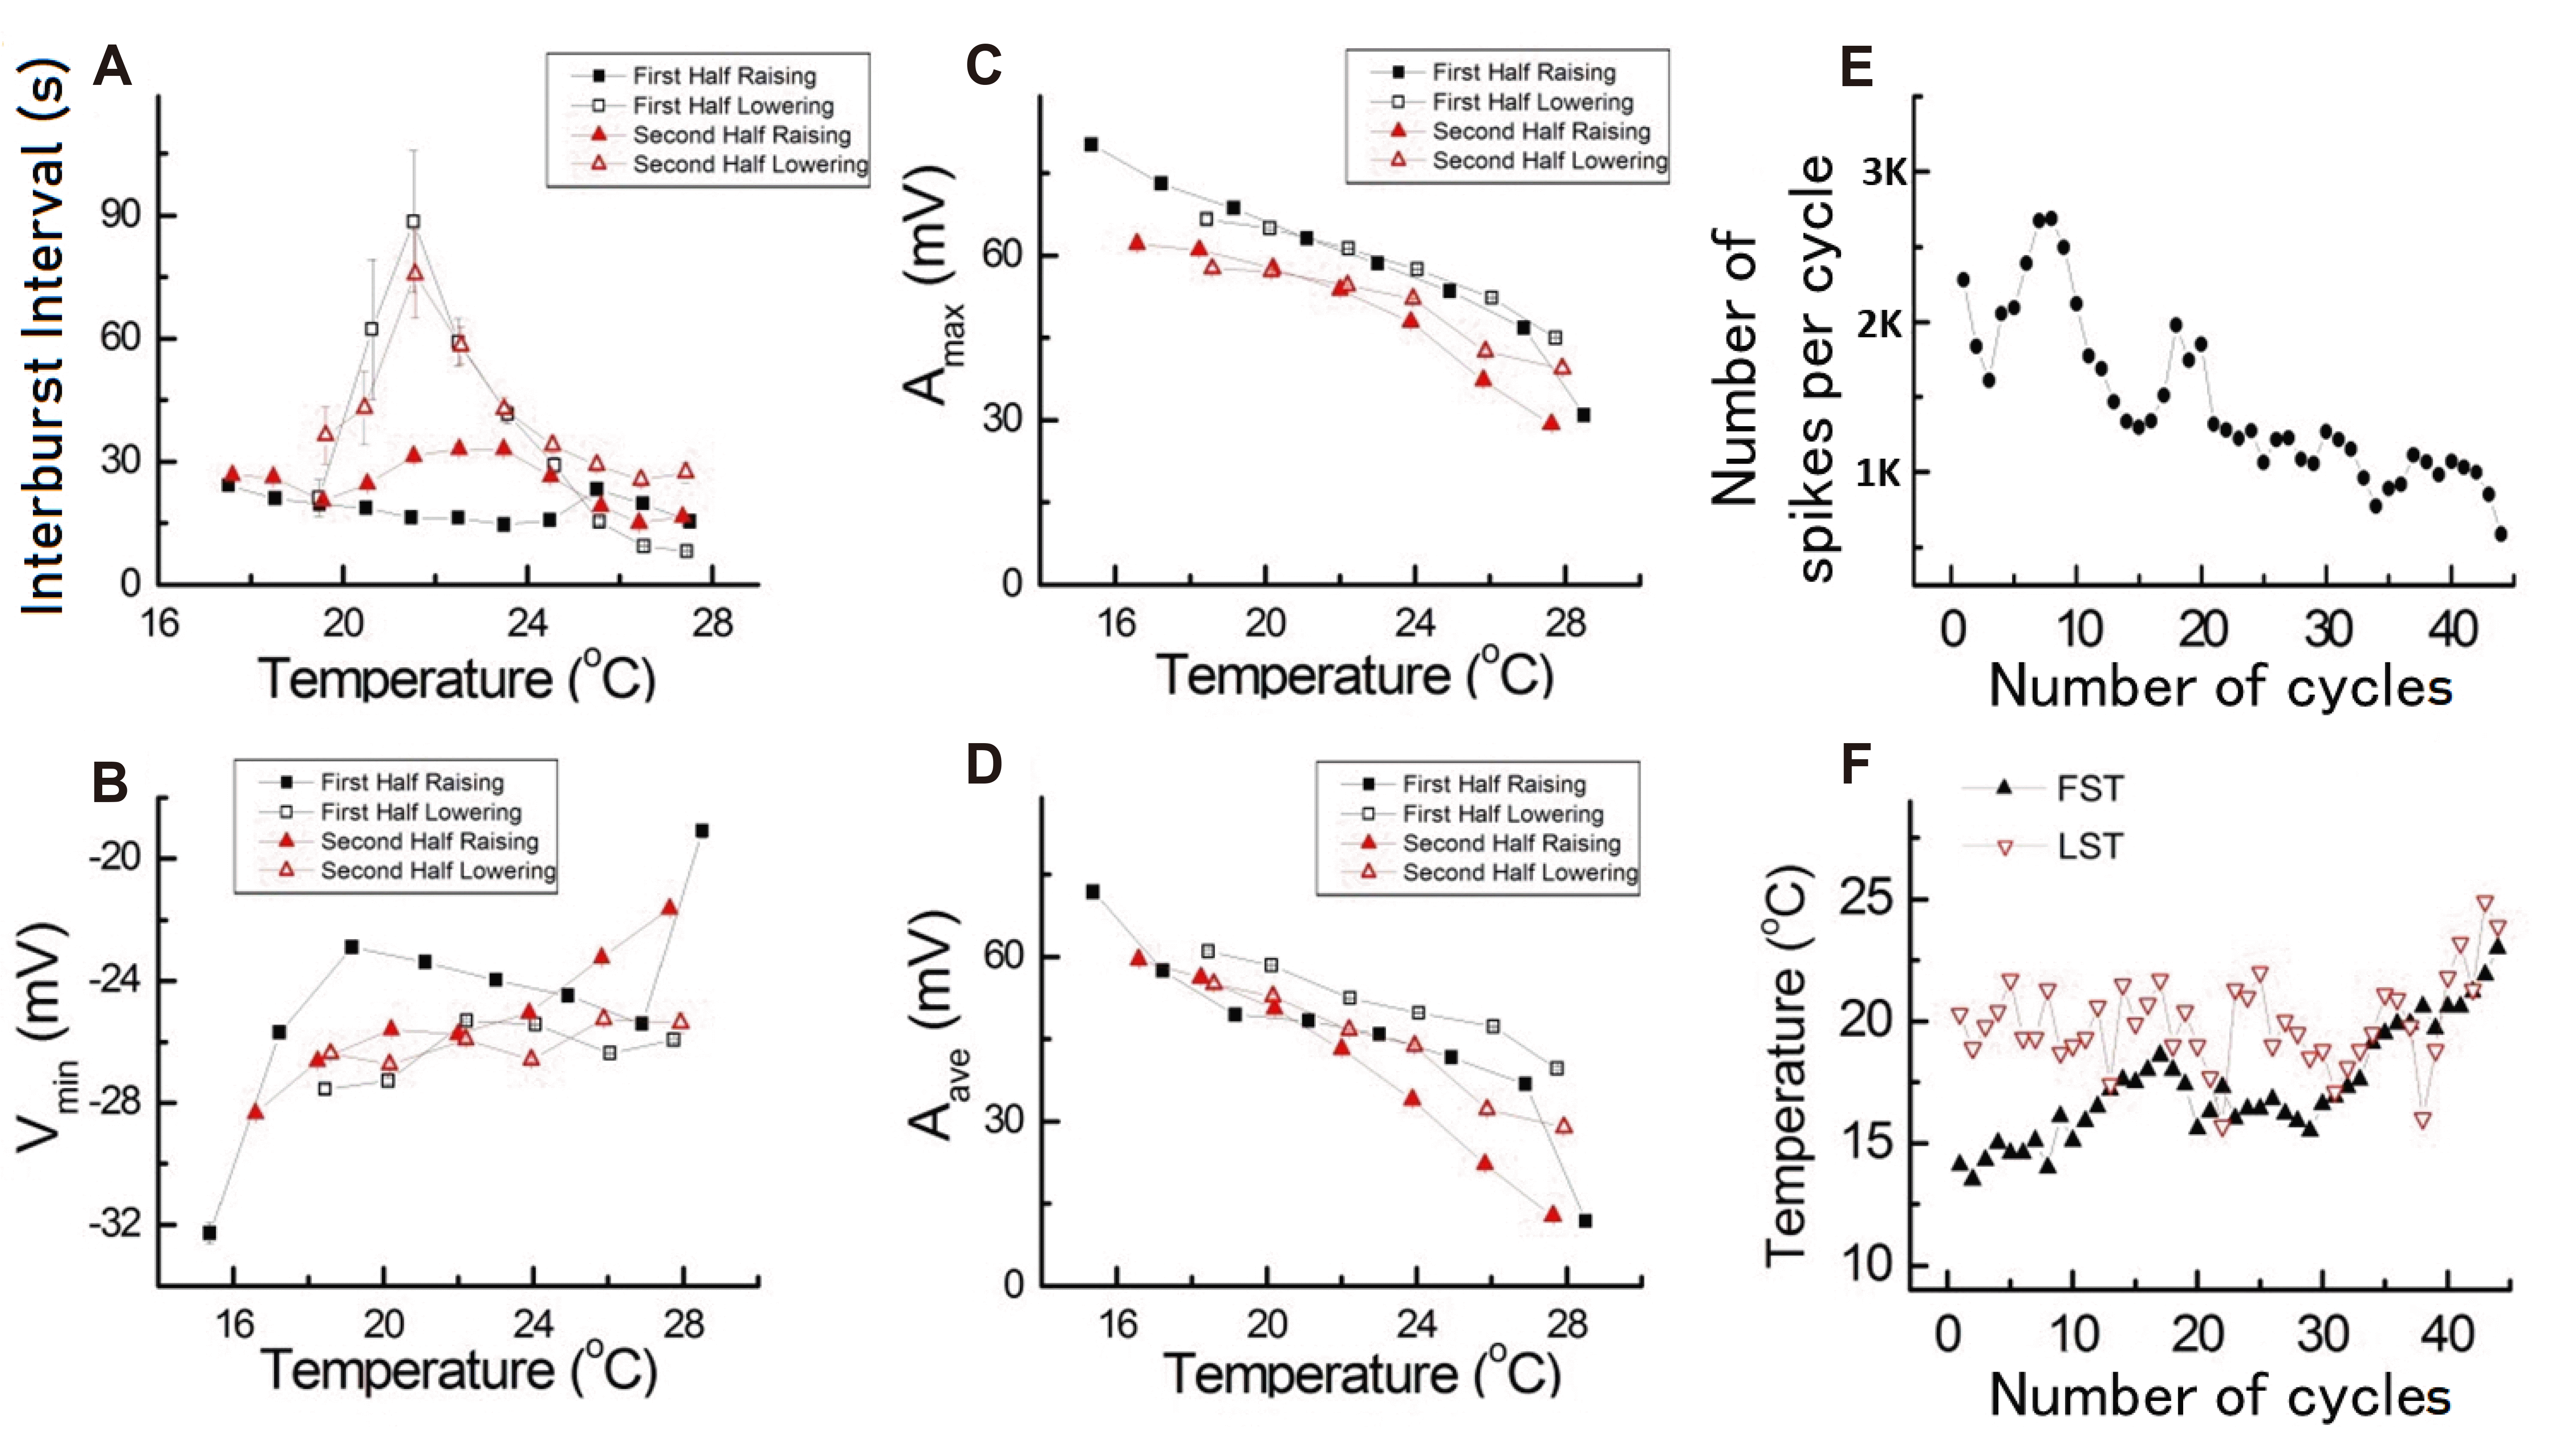 | Fig. 5Temperature-dependent changes in parameters of the type 2 abnormal burst during different phases of temperature change.(A) Interburst interval. (B) Vmin, membrane potential at the negative peak. (C) Amax, maximum action potential amplitude. (D) Aave, average of action potential amplitude. (E) Number of spikes per cycle. (F) Temperature in each cycle. FST, temperature to generate the first spike in the rising phase; LST, temperature to show the last spike in the descending phase. Note that bursting in the first half of the experiment E differs from the bursting observed in the second half.
|
Simulation of temperature-dependent type 2 abnormal bursting
To compare the simulation and experimental results, experimental data suitable for the simulation were selected (Fig. 4A). Table 3 describes the 34 variables associated with simulation of the modified Plant model; values of variables used for simulation were measured during the rising phase at 12.8°C (S), 15.6°C (Lf), 18.2°C (Ls), 21.6°C (Mf), 24.2°C (Ms), 27.6°C (Hf), and 29.1°C (Hs), and are presented in the first five graphs at the top of Fig. 4A. Among the 34 variables in Table 3, all except the first six variables (italics, Table 3) are fixed. Data from R15 cells adapted from our previous work [8] are shown in the column on the right.
Table 3
Values of variables for simulation based on the modified Plant equation
![]()
In Fig. 6, the seven blue line graphs show data for experimental E, labeled S, Lf, Ls, Mf, Ms, Hf, and Hs in Fig. 4A. The red line graphs show simulation data based on the modified Plant model using parameter values shown in Table 3 at each temperature. The topmost graph (S) corresponds to values of variables shown in the first column in Table 3. The left graph (Lf) in the second row corresponds to values of variables shown in the second column in Table 3. All other graphs correspond to consecutive columns in Table 3. Overall tendencies were simulated based on the experimental results. Fig. 7 depicts an enlarged view of the four complicated graphs (Ls, Mf, Ms, and Hf) for medium to high temperatures in Fig. 6. In the Ls graph in Fig. 7, the number of simulated spikes is slightly larger than the number in the experimental results, but the simulated results yielded a shorter IBI. In the Mf graph in Fig. 7, the simulated and experimental results are similar. In the Ms graph in Fig. 7, the simulated results show a larger IBI but fewer spikes compared to the experimental results. In the Hf graph in Fig. 7, the simulated results show a shorter duration and spikes have a smaller amplitude than those in the experimental results. The overall simulation results were highly reproducible compared with the experimental results.
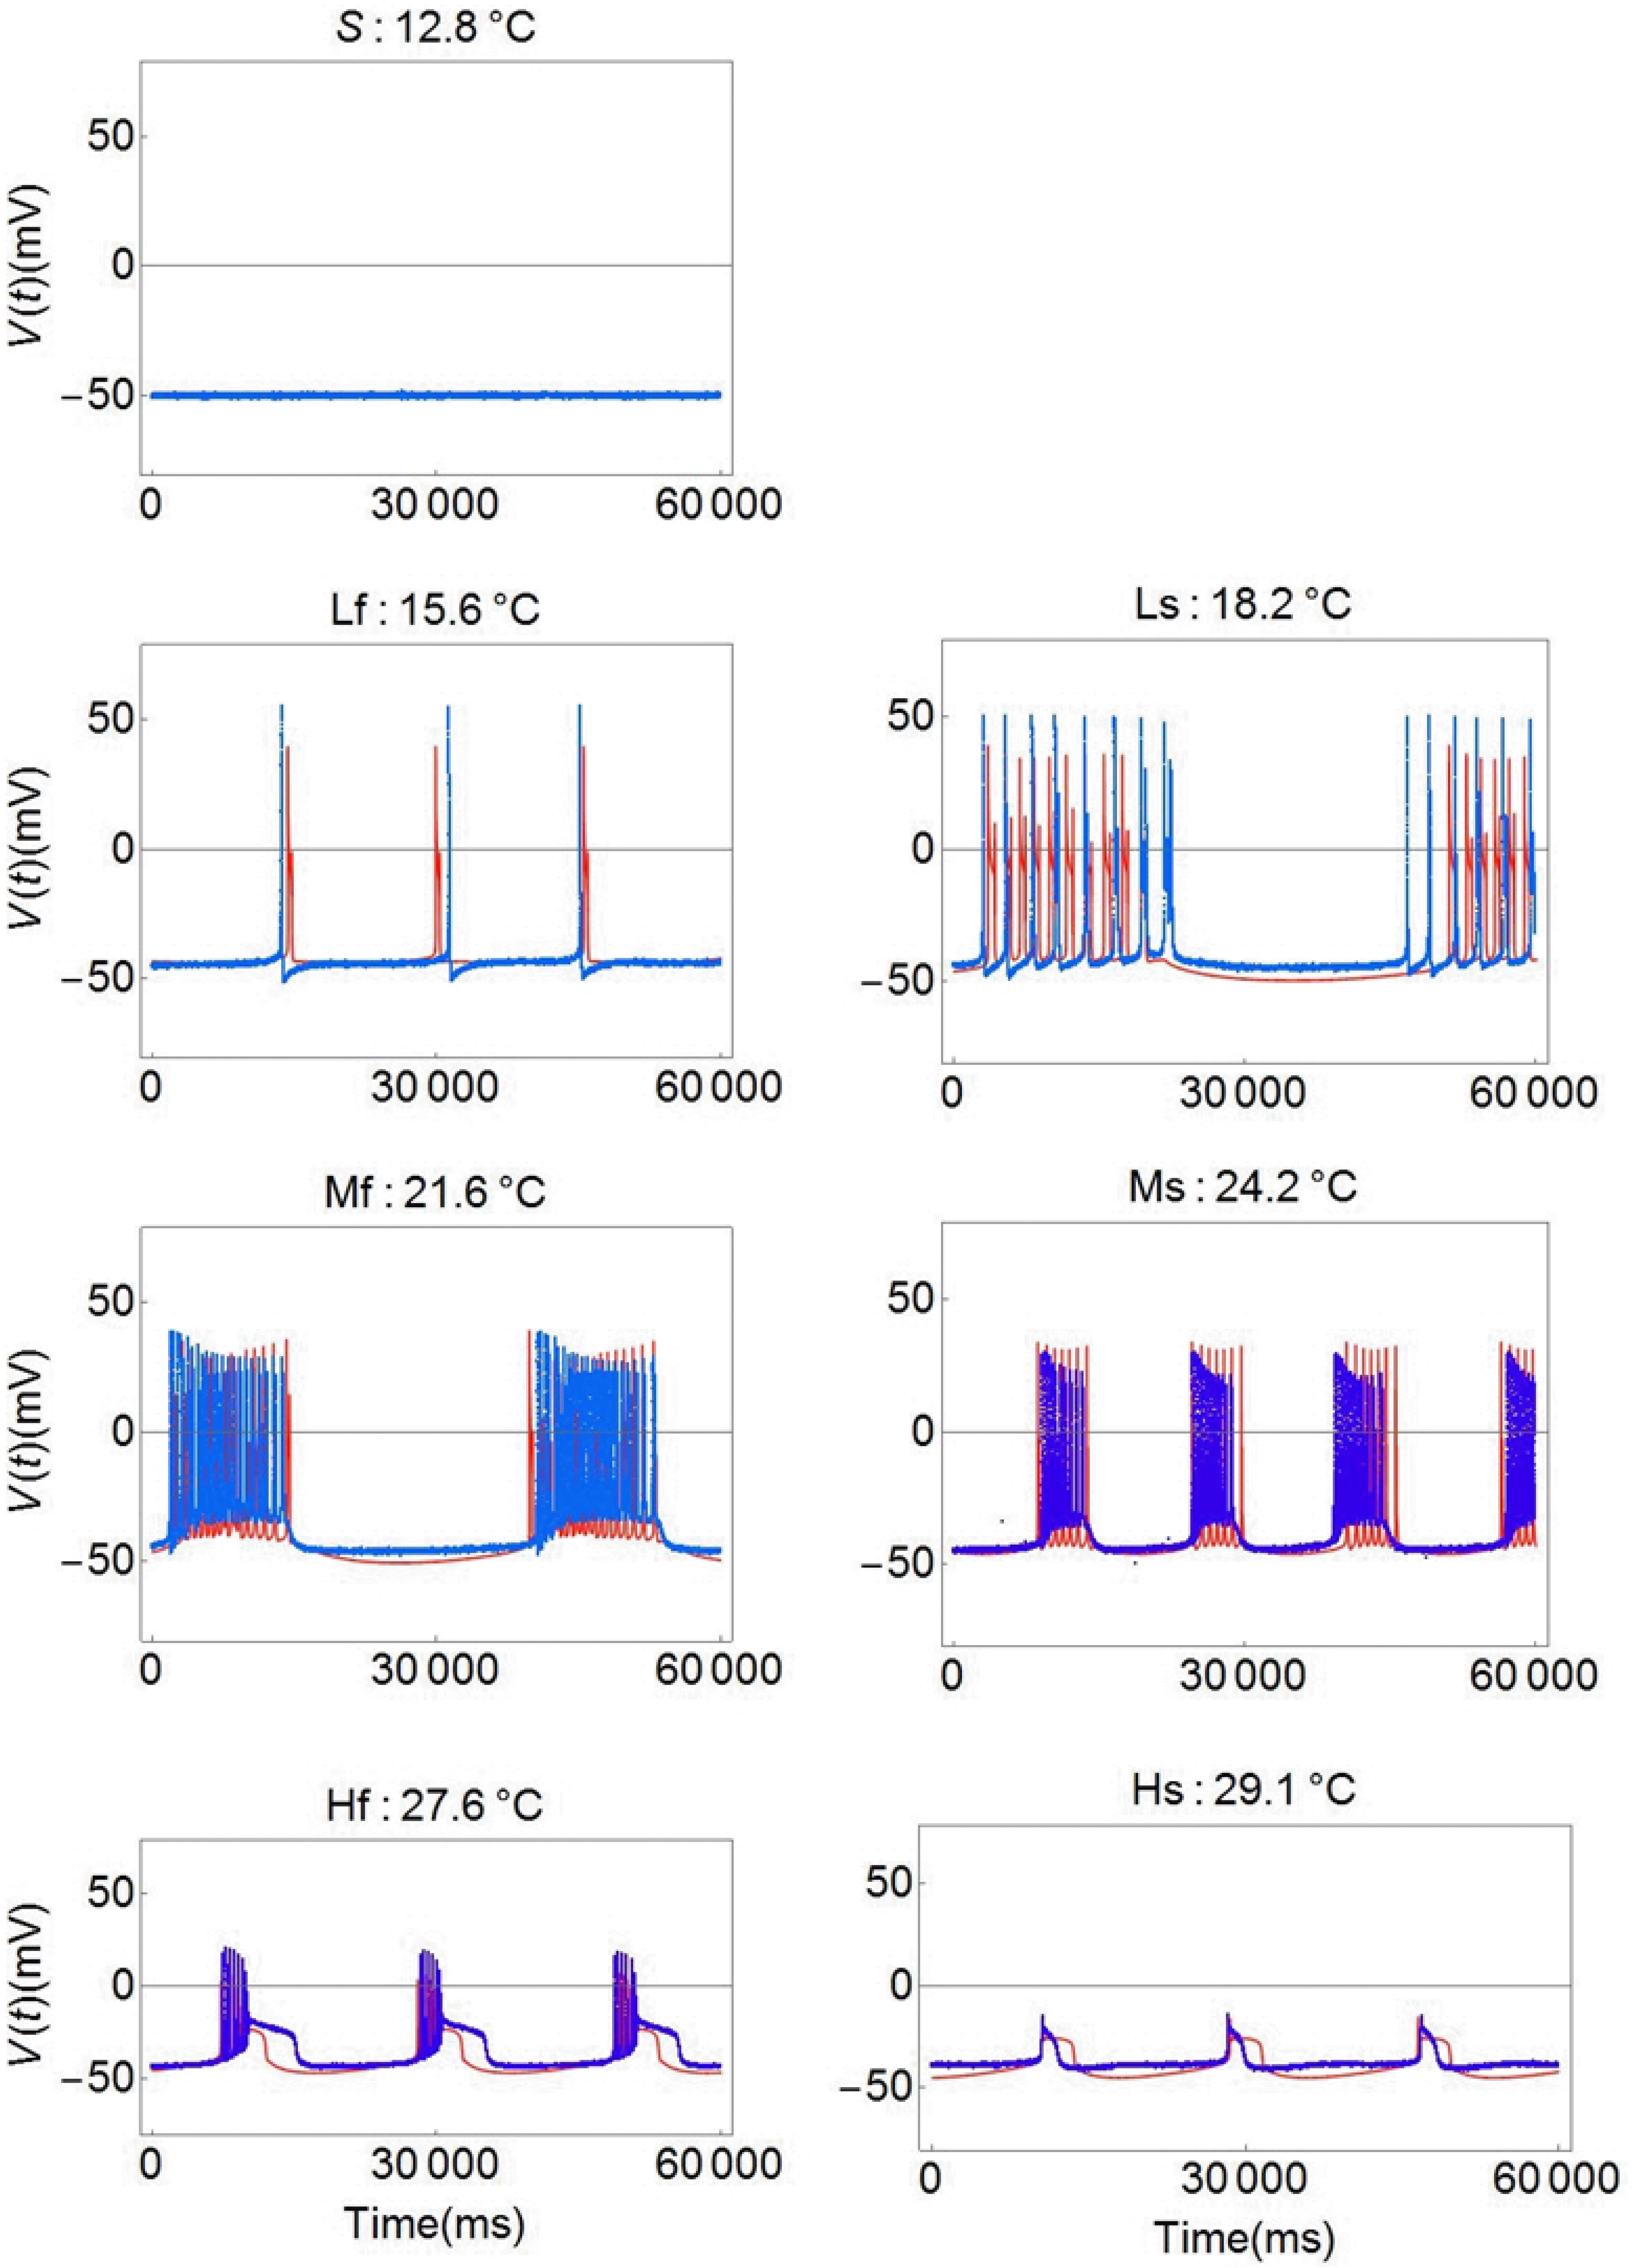 | Fig. 6Comparison of the experimental results and the simulation results.The seven blue line graphs show the data of experimental E marked as S, Lf, Ls, Mf, Ms, Hf, Hs in Fig. 4A. The red line graphs are the simulation data generated by the modified Plant model. Note that the simulated results are reproducible and similar to the experimental results. V(t), membrane potential.
|
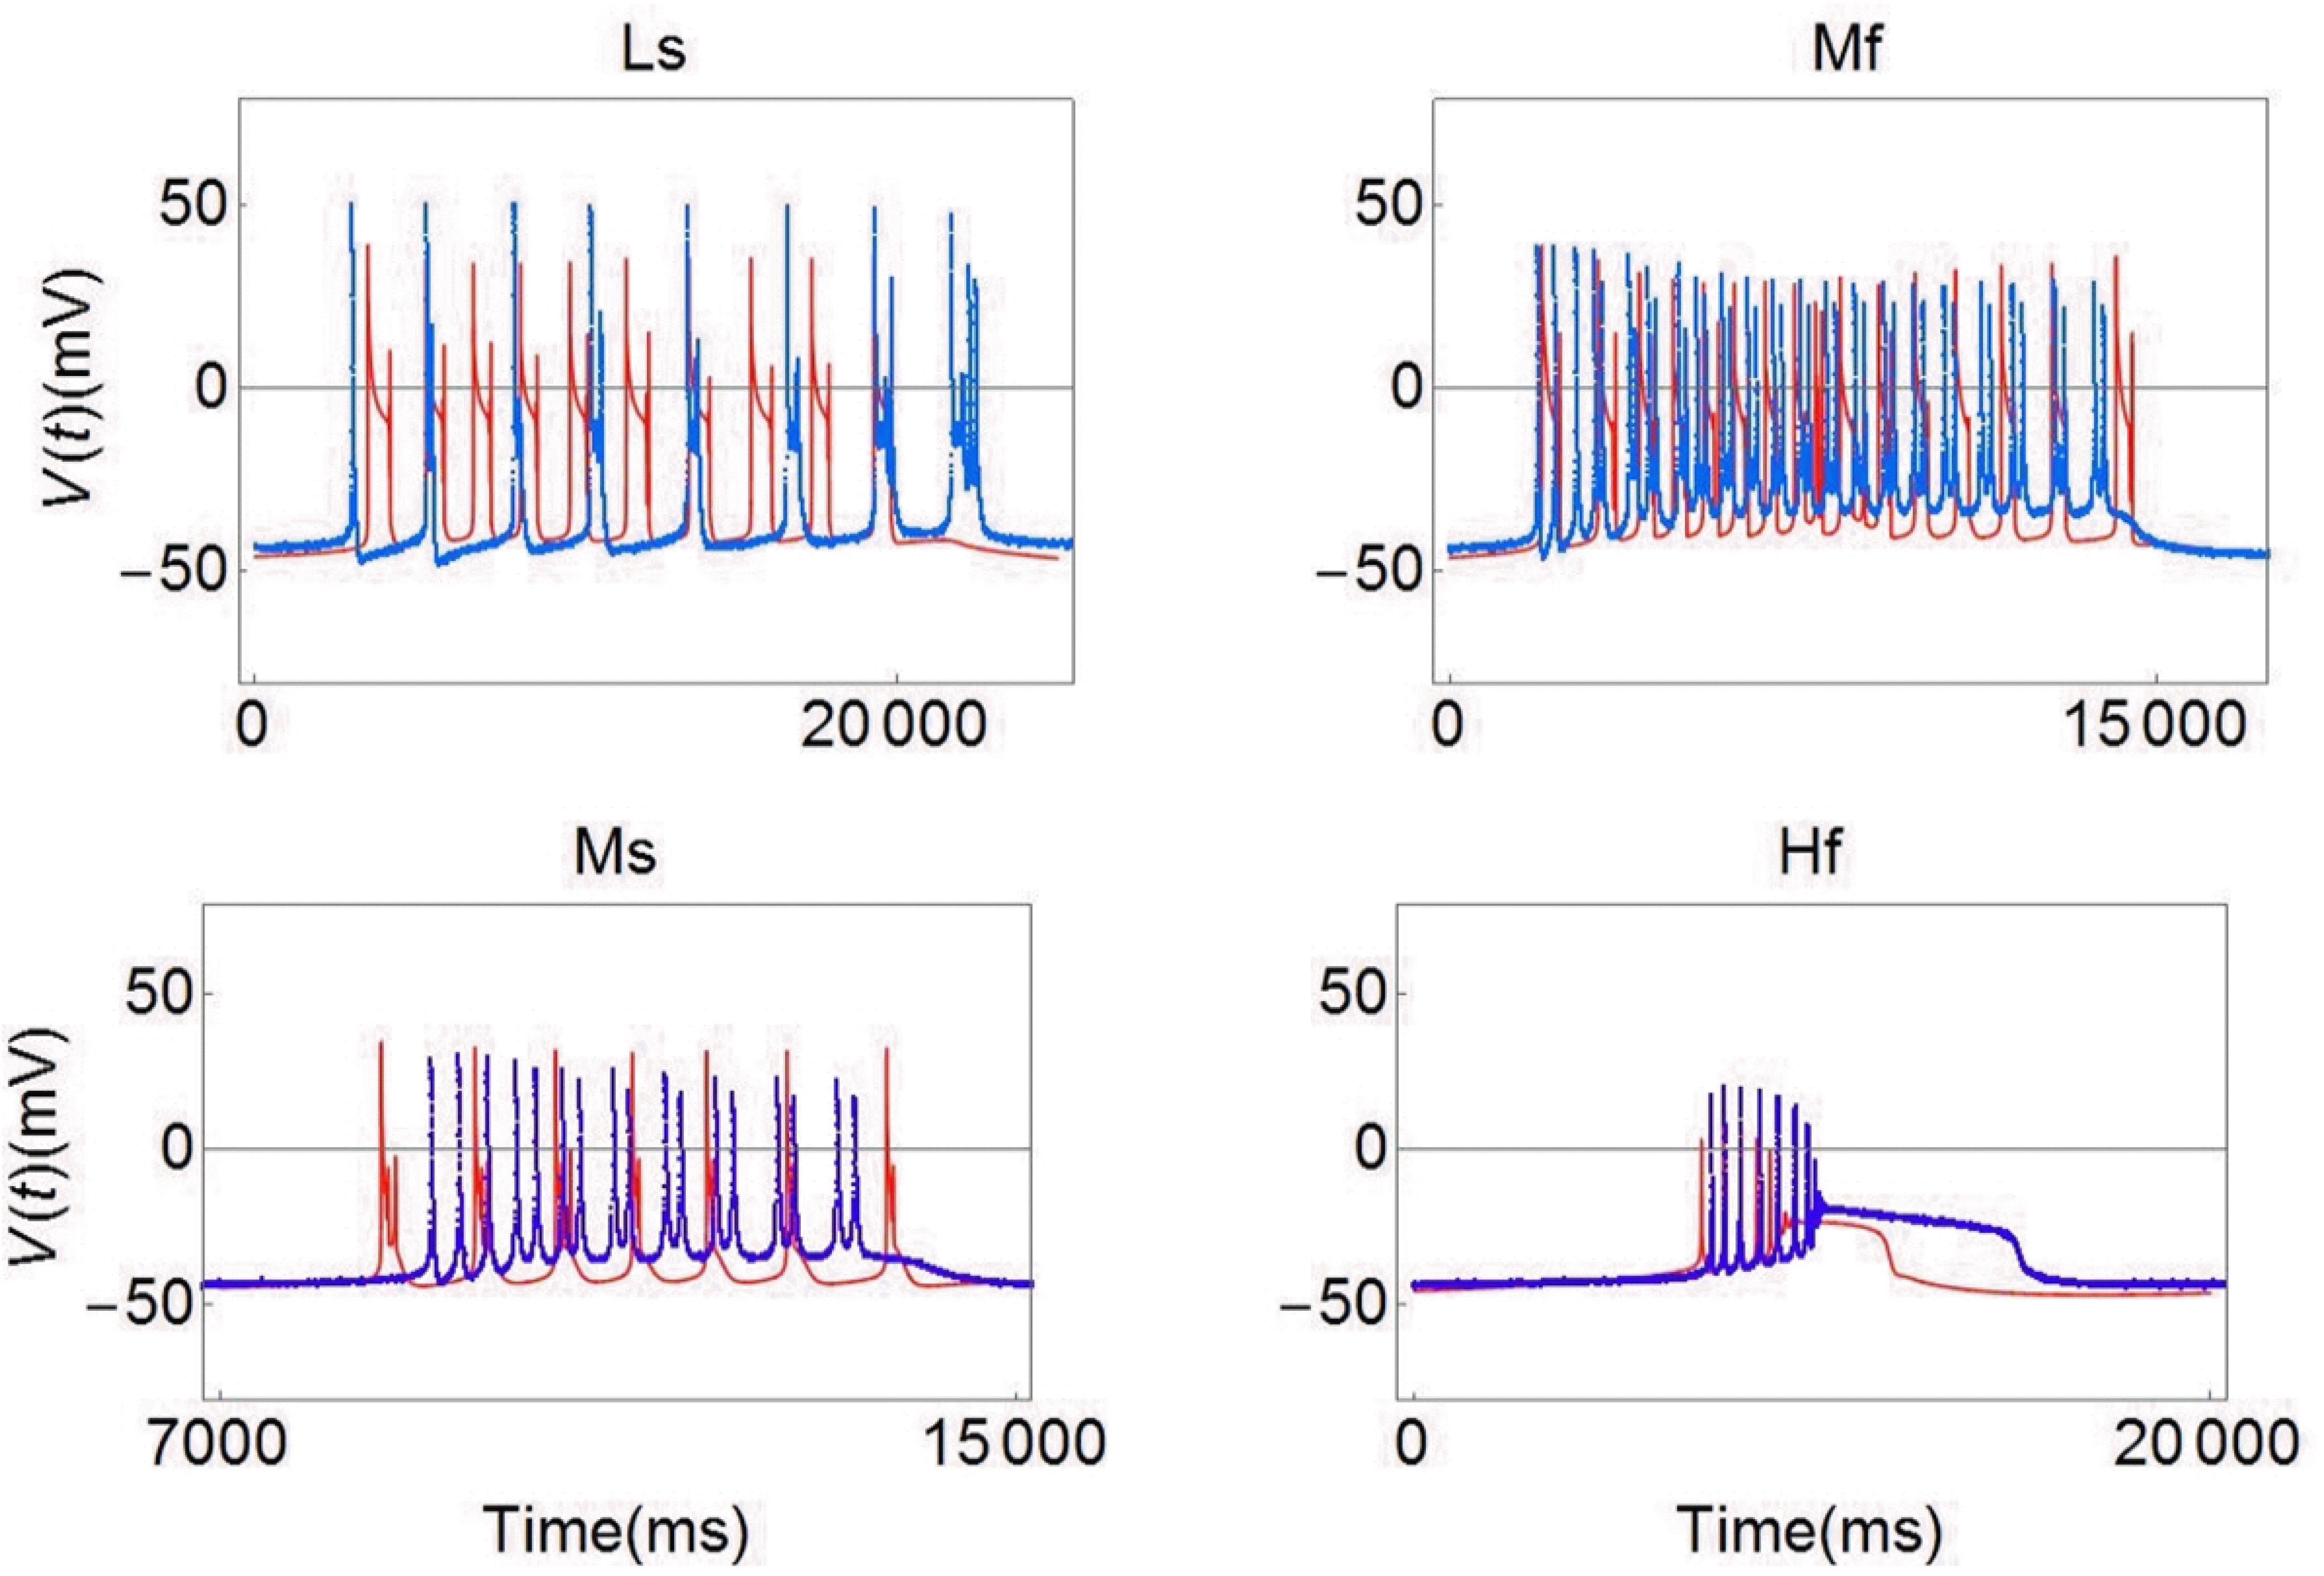 | Fig. 7An enlarged view of the bursting patterns selected from the experimental results and the simulated results shown in Fig. 6.The blue line graphs show the data of experimental E and the red line graphs are the simulation data generated by the modified Plant model. V(t), membrane potential.
|
Go to :
DISCUSSION
Abnormal bursting during long-term recording
The data obtained from experiment E (Table 2) are striking. The first notable observation was perfect beating at room temperature, contrasting with a wide variety of temperature-dependent firing patterns after four cycles of temperature stimulation. The second notable observation was highly reproducible data for 44 cycles recorded every 2 h without supplying additional oxygen. These data differ from other data recorded in the lab because they were acquired over a significantly longer duration, although the reason for the long duration remains unknown. Some cells located at the right rostral side of the dorsal ganglion were exposed, as revealed by anatomical microscopy analysis. Therefore, in the current study electrodes were directly pinned to neurons without protease treatment. We assumed that cells were not damaged by proteases since it was possible to record signals for a long time. In this experiment, cells exhibited regular beating activity at room temperature, and activity was altered by temperature changes. Finally, we observed two types of abnormal bursting patterns, revealing temperature-dependent changes during long-term recording. In general, a type 1 abnormal single burst was composed of two kinds of spikes with a long ISI followed by short ISI regular firings. By contrast, a type 2 abnormal single burst was composed of repetitive series of multiplets mixed with singlets, doublets, triplets, etc.
Mechanism underlying the temperature dependence of abnormal busting
As shown by the experiment with R15 cells, the mechanism could be clarified by fixing every parameter identically throughout the temperature change [8]. To determine the mechanism of the change in pattern following temperature change, we simulated the action potential activity using the modified Plant equation. By simulating type 2 abnormal bursting, we explored the mechanisms of complicated signal patterns. In this case, we were unable to fix six different parameters throughout the temperature change. Thus, although we could not clarify exactly the mechanism of abnormal bursting, we can assume that the mechanisms of action potential firings in response to temperature change are related to n and h gate operations. This is because variables associated with n and h gate operations cannot be fixed throughout the temperature change. Thus, we conclude that the mechanisms of temperature dependence in these neurons are related to temperature-dependent scaling factors, and variability in the functions of activation/inactivation in a potassium and/or sodium channel. In relation to the function of ion channels in temperature-dependent abnormal bursting, although it is not easy to uncover the molecular mechanisms of channels involved in temperature-dependent abnormal bursting in neurons in this paper, we can suggest several hypotheses on the basis of previous reports published by other researchers. First, the bursting patterns obtained from neurons in the abdominal ganglion of Aplysia juliana are similar to those obtained from the Dbx1+ inspiratory neurons within the pre-Bötzinger complex (pre-BötC) of the mammalian brainstem showing network-wide synchronous bursting [16]. This bursting rhythm has been found to be relevant to the calcium-activated nonspecific cationic current [17], persistent sodium current [18], and sodium-potassium pump [19] as a single self-coupled neuron model. In the future, if a new model to combine a Plant model and a single self-coupled neuron model could be established, we expect that the mechanism of temperature-dependent bursting can be explained in relation to the ion channel current. Second, when considering that Aplysia naturally lives in sea water at 10°C–20°C, heat shock can be induced at 29°C. Heat shock induced by elevated temperature may cause the clearance of extracellular K+ through increased insertion of more Na+/K+ ATPase pumps into the cell membrane [20,21] and finally alters membrane excitability [22]. Moreover, heat shock has been known to prolong the conductance of Na+, Ca+2, or other non-selective cation channel or to reduce the K+ conductance. These alterations of ion channels increase the afterdepolarizations following an action potential leading to lowering the threshold for subsequent action potential firing [23]. Finally increased membrane excitability by elevated temperature-induced heat shock may lead to high frequency bursts of action potentials. Taken together, temperature may change intrinsic membrane excitability through alterations in the properties of ion channels and active transporters. However, it requires more studies in the future.
Potential applications
Although neurons in Aplysia are different from those in humans, the structures of ion channels involved in temperature dependence may be similar. Our results suggest that n and h gate operations are associated with temperature dependence. This indicates that pharmacological antagonists or agonists for n and h gates may act as modulators of temperature dependence [24]. In this regard, these targets should be further investigated to assist the development of pharmacological therapeutics for hypothermia and new types of antipyretics to reduce injury to neural tissues.
Go to :
 XML Download