

 PDF
PDF Citation
 Print
Print


INTRODUCTION
The development of acquired resistance to anticancer drugs is a major obstacle to the curative use of these drugs. Multiple mechanisms have been suggested in the development of multidrug resistance (mdr), and the P-glycoprotein (Pgp) encoded by the multidrug resistance type 1 (MDR1) genes has been identified as a major mechanism in the development of anticancer drug resistance [1,2]. MDR1 contributes to in multidrug resistance in humans, and mdr1a and mdr1b cause multidrug resistance to rodents. P-glycoprotein overexpression is generally believed to reduce cellular drug accumulation because of the enhanced drug efflux of various structurally and functionally unrelated anticancer drugs, these include anthracycline (e.g., doxorubicin), vinca alkaloids and antibiotics [3]. Therefore, enhanced human MDR1 gene expression is believed to be contributed to the treatment failure of some human cancers. Furthermore, it has been postulated that the mdr1 gene is a marker of tumor progression and aggressiveness.
Ras plays an important role in cellular proliferation and differentiation [4], and point mutations in the Ras gene occur frequently in mammalian cells, leading to the transformation and advanced tumor progression [5]. The relationship between oncogenic Ras expression and drug resistance in some human tumors has been investigated. Although several studies concerning MDR expression have been performed in oncogenic Ras transformed cells, the role of Ras in MDR expression is still unknown. Several studies have reported that active Ras causes MDR1 expression and leads to anticancer drug resistance [6-8]. However, others have found that Ras activation was not able to up-regulate the MDR1 gene [9], and that oncogenic Ras overexpression resulted in the downregulation of MDR1 expression and a subsequent reduction in surface-localized Pgp [10,11].
Reactive oxygen species (ROS) is a downstream effector of Ras, and can influence a number of intracellular pathways. ROS also act as a second messenger in the cells and control various Ras-associated intracellular effects [12-14]. Recently, it has been suggested that Pgp expression may be regulated by a redox-sensitive signal pathway, because the rat mdr1b gene promoter contains redox-sensitive transcriptional factors, including activated protein-1 (AP-1) or nuclear factor κB (NF-κB) [15,16]. Moreover, intracellular ROS production can modulate rat mdr1b gene expression [17,18]. Therefore, the question as to whether or not the oncogenic Ras effects mdr1b expression, and whether or not ROS, as a downstream effector of Ras, is involved in mdr1b expression, was addressed. Here, we report that the stable expression of oncogenic H-Ras significantly decreases mdr1b expression in NIH3T3 cells, and that treating V12-Ras expressing cells with either antioxidant N-acetylcysteine (NAC) or the NADPH oxidase inhibitor diphenylene iodonium (DPI) lead to an increase in mdr1b expression and the prevention of doxorubicin-induced apoptosis. Using the ERK inhibitors, PD98059 and U0126, evidence is provided showing that ERK activity is, at least in part, involved in the ROS-mediating down-regulation of mdr1b expression in V12-Ras-NIH3T3 cells.
Go to : 
METHODS
Cell culture and reagents
The NIH3T3 mouse embryo fibroblast lines were obtained from American Type Culture Collection (ATCC; Manassas, VA, USA) and were maintained in Dulbecco’s modified Eagle’s medium supplemented with 10% fetal bovine serum, 2 mM L-glutamine, 100 units/ml of penicillin, and 100 µg/ml of streptomycin (Life Technologies, Inc., Carlsbad, CA, USA). Cells were cultured at 37°C in a humidified chamber containing 5% CO2. Doxorubicin, NAC, DPI and propidium iodide were purchased from Sigma (St. Louis, MO, USA), anti-Ras polyclonal antibody from BD Transduction Laboratories (San Diego, CA, USA), and PD98059, U0126 and SB203580 were obtained from Calbiochem (La Jolla, CA, USA).
Plasmid constructs and oligonucleotides
Wild type H-Ras cDNA was cloned by RT-PCR from human Jurkat cells. The dominant positive H-Ras (RasV12) and dominant negative H-Ras (RasN17) were subjected to site-directed mutation using the wild type H-Ras cDNA template, according to the manufacturer’s instruction (Stratagene, La Jolla, CA, USA). After DNA sequence confirmation, the V12-Ras and N17-Ras cDNA were subcloned into a pcDNA3 mammalian expression vector (Invitrogen, San Diego, CA, USA), respectively. pGL3-Luc plasmid was purchased from Promega (San Diego, CA, USA), Gal4-ElK1 and pFR-Luc plasmids were purchased from Stratagene (La Jolla, CA, USA), and mdr1b-Luc plasmid was generously provided by M. Tien Kuo [19]. The c-jun N-terminal kinase (JNK) antisense (AS) oligonucleotides used in this study were synthesized at ISIS Pharmaceuticals, Inc. (Carlsbad, CA, USA). The sequences of the oligonucleotides used were as follows: Control (ISIS 17552), TCAGTAATAGCCCCACATGG; JNK1 AS (ISIS 15347), CTCTGTAGGCCCGCTTGG; and JNK2 AS (ISIS 15354), GTCCGGGCCAG-GCCAAAGTC. All oligonucleotides were 2’-O-methoxyethyl chimers containing five 2’-O-methoxyethyl-phosphodiester residues flanking a 2’-deoxynucleotide-phosphorothioate region [20].
Transfection and luciferase activity assay
NIH3T3 cells were transfected with reporter vectors (mdr1b-Luc, pGL3-Luc, Gal4-Elk1 or pFR-Luc) and pRL-CMV (renilla luciferase containing vector) using LipofectAMINE and LipofectAMINE PLUS solution, according to the manufacturer’s instruction (Life Technologies, Inc.). Dual luciferase activity in the cell extracts was determined according to manufacturer’s instructions (Promega). Briefly, each assay mixture contained 20 l cell lysate and firefly luciferase measuring buffer (LAR IIR; Promega). Firefly luciferase activity was then measured using a luminometer. The reaction mixture was then added to renilla luciferase measuring buffer (Stop & GloR; Promega). Renilla luciferase activity was used to normalize transfection efficiency. The level of luciferase activation is presented relative to the activity obtained from the transfection of mdr1b-Luc into the pcDNA3-NIH3T3 cells, whose value was placed at 1.0.
Western blotting
Cell extracts were prepared in RIPA buffer (50 mM Tris-HCl [pH 7.5], 150 mM NaCl, 1% Nonidet P-40, 0.5% sodium deoxycholate, 0.1% SDS, 1 mM DTT) containing protease inhibitors (Roche, Basel, Switzerland). Proteins were separated by SDS-PAGE and transferred onto a PVDF membrane (PALL life Sciences, Ann Arbor, MI, USA). Membranes were subsequently incubated with anti-Ras polyclonal antibody (BD Transduction Laboratories) at 4°C overnight, followed by peroxidase-conjugated secondary antibodies for 1 h at room temperature. The bands were visualized by an ECL chemiluminescent detection system (iNtRON Biotechnology, Seongnam, Korea).
Apoptosis assay
Cells were collected 24 h after being treated, fixed in 70% ethanol, and stained with propidium iodide (PI, 50 µg/ml) after RNA digestion. 10,000 PI-stained cells were analyzed for DNA content using a FACScan flow cytometer (Becton Dickinson, San Jose, CA, USA).
RT-PCR
The total RNA was isolated from pcDNA3-NIH3T3 and V12-Ras-NIH3T3 cells using TRIzol Reagent according to the manufacturer’s instruction. The total RNA (1 mg) of the total RNA was reverse transcribed using MMLV reverse transcriptase (Gibco BRL) in its own buffer and random primers at 37°C for 1 h. cDNA amplification was done by PCR through 35 cycles at 94°C for 30 sec, 55°C for 30 sec, and 72°C for 45 sec, followed by a final step at 72°C for 5 min. The following rat primers designed were used as previously reported [21]: mdr1b sense primer, 5’-GAAATAATGCTTATGAATCCCAAA-3’; mdr1b antisense primer, 5’-GGTTTCATGGTCGTC GTCTCTTGA-3’; GAPDH sense primer, TGTGAACGGATTTGGCCGTA-3’; GAPDH antisense primer, 5’-TCGC TCCTGGAAGATGGTGA-3’. After amplification, the PCR products were separated by 1.5% agarose gel electrophoresis and stained with ethidium bromide and the resulting bands were analyzed by densitometry.
Statistical analysis
All experiments were done with at least three times independently. Data were represented as mean ± standard deviation. Statistical comparisons were determined by Two-tailed Student’s t-test using GraphPad prism software (GraphPad software, Inc., La Jolla, CA, USA) and Excel (Microsoft, Redmond, WA, USA). p-values < 0.05 was considered statistically significant.
Go to :
RESULTS
Expression of oncogenic H-Ras inhibits rat mdr1b expression
In order to determine the role of oncogenic Ras in the mdr1b gene expression, the dominant positive form of RasV12 and an empty expression (pcDNA3) vector were stably transfected into NIH3T3 cells. Following selection by G418, several clones were isolated and one RasV12-NIH3T3, which expressed oncogenic H-Ras, and one pcDNA3-NIH3T3, which was used as a control, were selected for further test. Immunoblotting analysis revealed that RasV12-NIH3T3 cells exerted significant overexpression of oncogenic H-Ras as opposed to that of the pcDNA3-NIH3T3 cells (Fig. 1A). To investigate whether or not RasV12 might modulate mdr1b expression in NIH3T3 cells, the luciferase activities were determined by a luminometer in the RasV12 and pcDNA3 expressing cells, which were cotransfected with the mdr1b-Luc reporter plasmid or the pFR-Luc plasmid and the pRL-Luc plasmid containing the renilla luciferase gene. As shown in Fig. 1B, we found that RasV12 markedly inhibited the mdr1b-Luc activities in the NIH3T3 cells. Luciferase activity analysis revealed that the RasV12-NIH3T3 cells had 75% less mdr1b-Luc activity than the pcDNA3-NIH3T3 cells. However, RasV12 expression had no effect on pFR-Luc. This result suggests that RasV12 can downregulate mdr1b expression in NIH3T3 cells. To confirm the inhibitory effect of RasV12 on the mdr1b-luc activity, dominant negative Ras containing plasmid (RasN17) was transfected into RasV12-NIH3T3 cells and the luciferase activities were measured. As shown in Fig. 1C, the decrease in the mdr1b-Luc activity by RasV12 can be increased by RasN17 expression, indicating that the decrease in mdr1b-Luc activity results from RasV12 expression. To further investigate the role of RasV12 in the downregulation of mdr1b expression in NIH3T3 cells, mdr1b mRNA expression in the pcDNA3-NIH3T3 and RasV12-NIH3T3 cells was determined by RT-PCR analysis. As shown in Fig. 1B, the mdr1b mRNA expression level appeared to be quite low in the RasV12-NIH3T3 cells compares to that observed in the pcDNA3-NIH3T3 cells. Densitometric analysis exhibited that the level of mdr1b mRNA in pcDNA3-NIN3T3 cells was approximately 3-fold higher than that in RasV12-NIH3T3 cells.
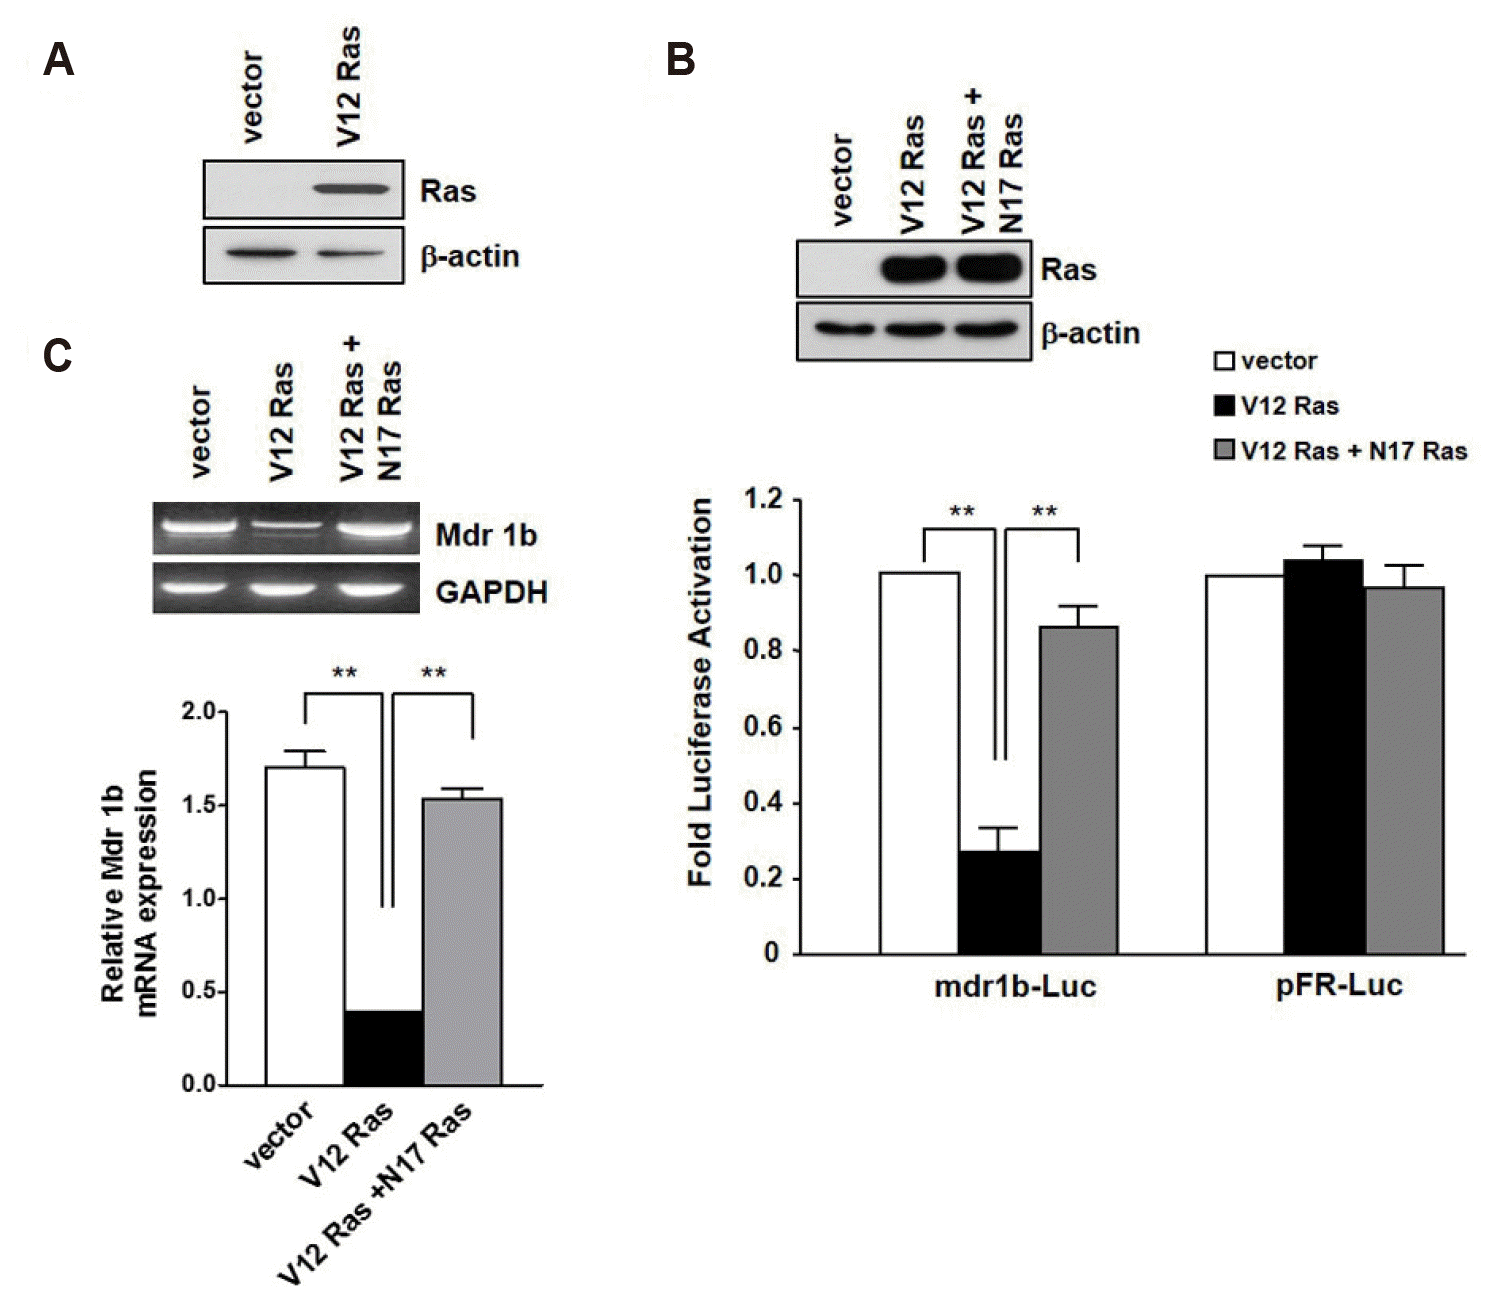 | Fig. 1Effect of oncogenic H-Ras overexpression on mdr1b expression.(A) The levels of overexpressed V12-Ras was analyzed by Western blotting. (B) The pcDNA3-NIH3T3 (vector) and V12-Ras-NIH3T3 (V12-Ras) cells were cotransfected with either mdr1b-Luc or pFR-Luc and pRL-Luc. The luciferase activities were measured 24 h after transfection, as described under “Methods”. Transfection with the pRL-Luc plasmid was used to normalize the transfection. The level of luciferase activation is presented relative to the activity obtained from the transfection of mdr1b-Luc into the pcDNA3-NIH3T3 cells, whose value was placed at 1.0. To block the Ras signaling pathway, N17-Ras-pcDNA3 (N17-Ras) was transiently transfection into V12-Ras-NIH3T3 cells, after which cells were transfected with mdr1b-Luc. Each data bar represents the mean of five observations from three independent experiments; the error bars indicate ± standard deviation. (C) RT-PCR analysis of mdr1b gene expression in pcDNA3-NIH3T3 (vector), V12-Ras-NIH3T3 (V12) and N17-Ras transfecting V12-Ras-NIH3T3 cells (V12+N17). The total RNA (2 µg) was reverse transcribed using reverse transcriptase. cDNA amplification was carried out using taq-polymerase over 30 cycles. The PCR products were separated on 1.5% agarose gels, stained with ethidium bromide. Bar graphs quantify the amount of mdr1b mRNA by Image J software. **p < 0.01.
|
We next investigated whether RasV12 expression would affect the doxorubicin-induced mdr1b-Luc activity. For this experiment, pcDNA3-NIH3T3 and RasV12-NIH3T3 cells were transfected with the mdr1b-Luc reporter plasmid, subsequently treated with doxorubicin, and luciferase activity was then determined. We found that, in the pcDNA3-NIH3T3 cells, treatment with 50, 100, and 250 nM of doxorubicin increased the mdr1b-Luc activity by 150-, 200-, and 300-fold compared to the untreated cells, respectively. However, in the V12-Ras-NIH3T3 cells, the corresponding enhancements of mdr1b-Luc activities were only 110-, 120-, and 150-fold versus the untreated cells (Fig. 2). These data indicate that RasV12 expression lead to down-regulation of the basal and doxorubicin-induced mdr-1b expression in NIH3T3 cells.
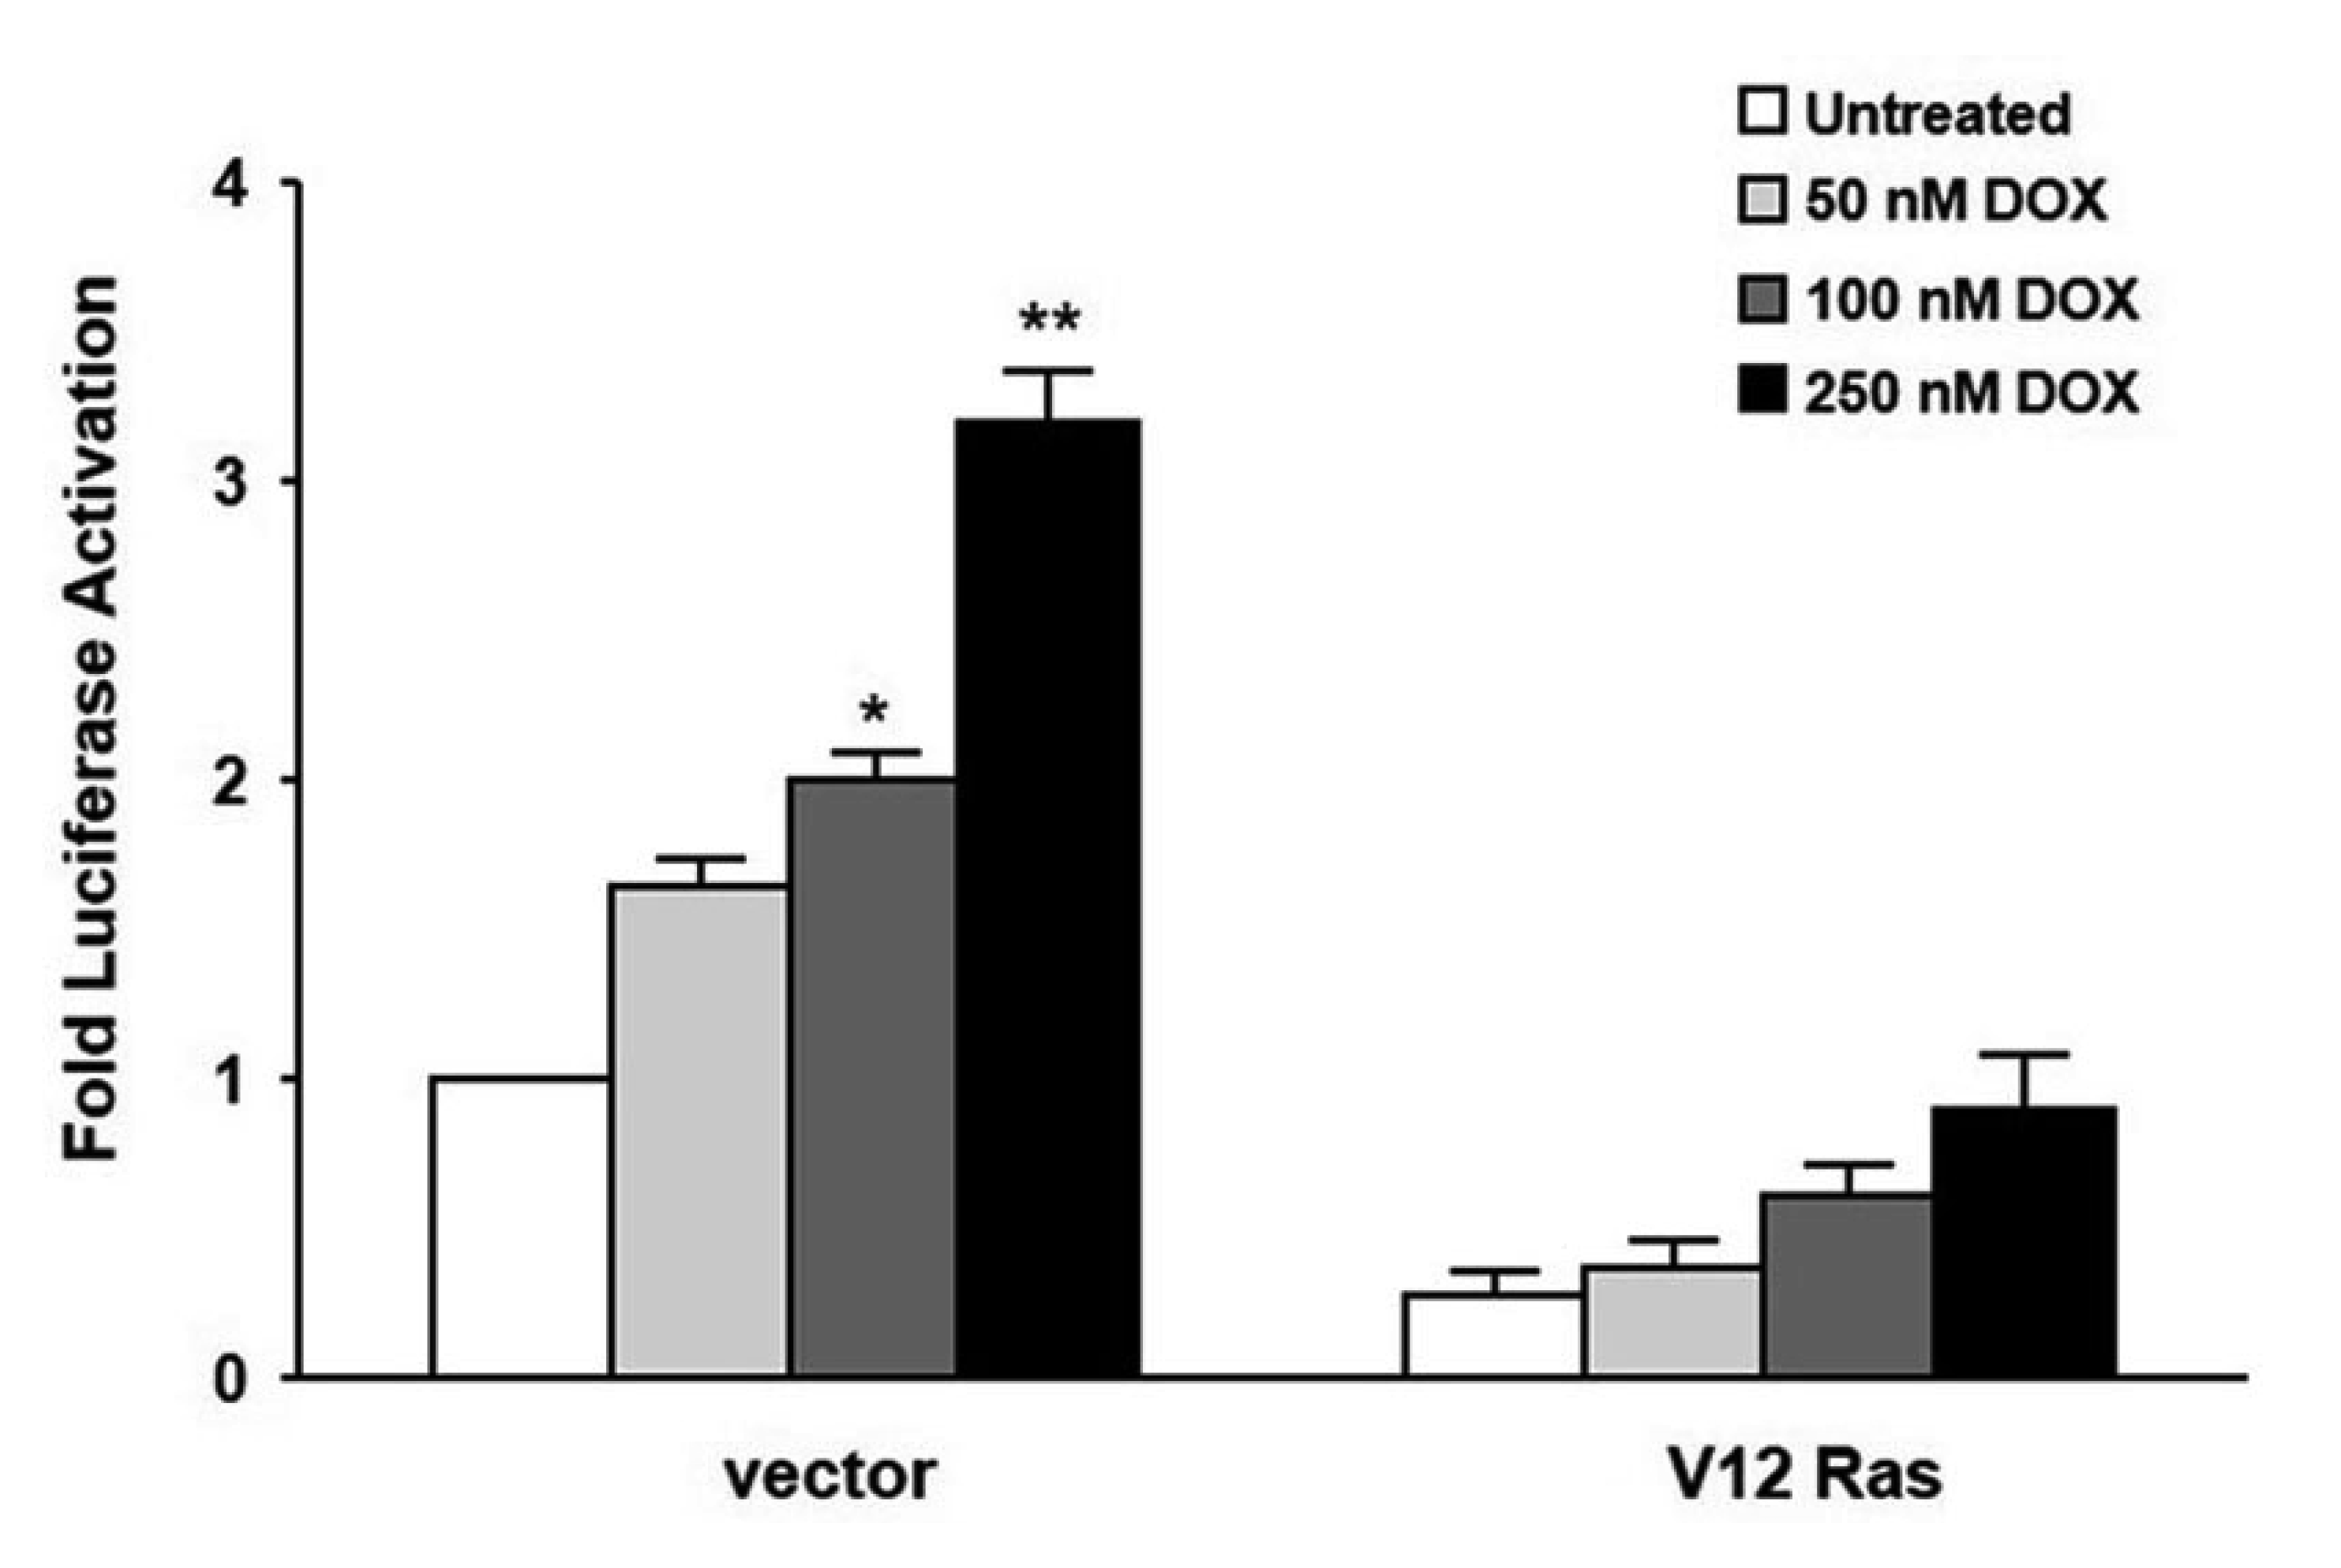 | Fig. 2pcDNA3-NIH3T3 (vector) and V12-Ras-NIH3T3 (V12-Ras) cells were cotransfected with either the mdr1b-Luc reporter plasmid or the pFR-Luc and pRL-Luc plasmid.Four hours after transfection, the cells were treated with different doxorubicin (DOX) concentrations for additional 24 h, and the luciferase activities were determined as described in Fig. 1B. Each data bar represents the mean of five observations from three independent experiments; the error bars indicate ± standard deviation. *p < 0.05 vs. untreated. **p < 0.01.
|
Intracellular ROS production by the expression of oncogenic Ras inhibits mdr1b expression
H-Ras expression has been reported to increased intracellular ROS generation in several cell lines [22-25]. For this reason, the level of intracellular ROS production was investigated using DCFHDA. Fig. 3 shows that RasV12 expression significantly increased the intracellular ROS production, which was blocked by RasN17 expression. In addition, treatment with either a thiol reducing agent NAC or NADPH oxidase inhibitor DPI dramatically reduced the level of intracellular ROS generation induced by RasV12 transfection. These results suggest that activating NADPH oxidase activity by RasV12 expression is involved in the intracellular ROS generation.
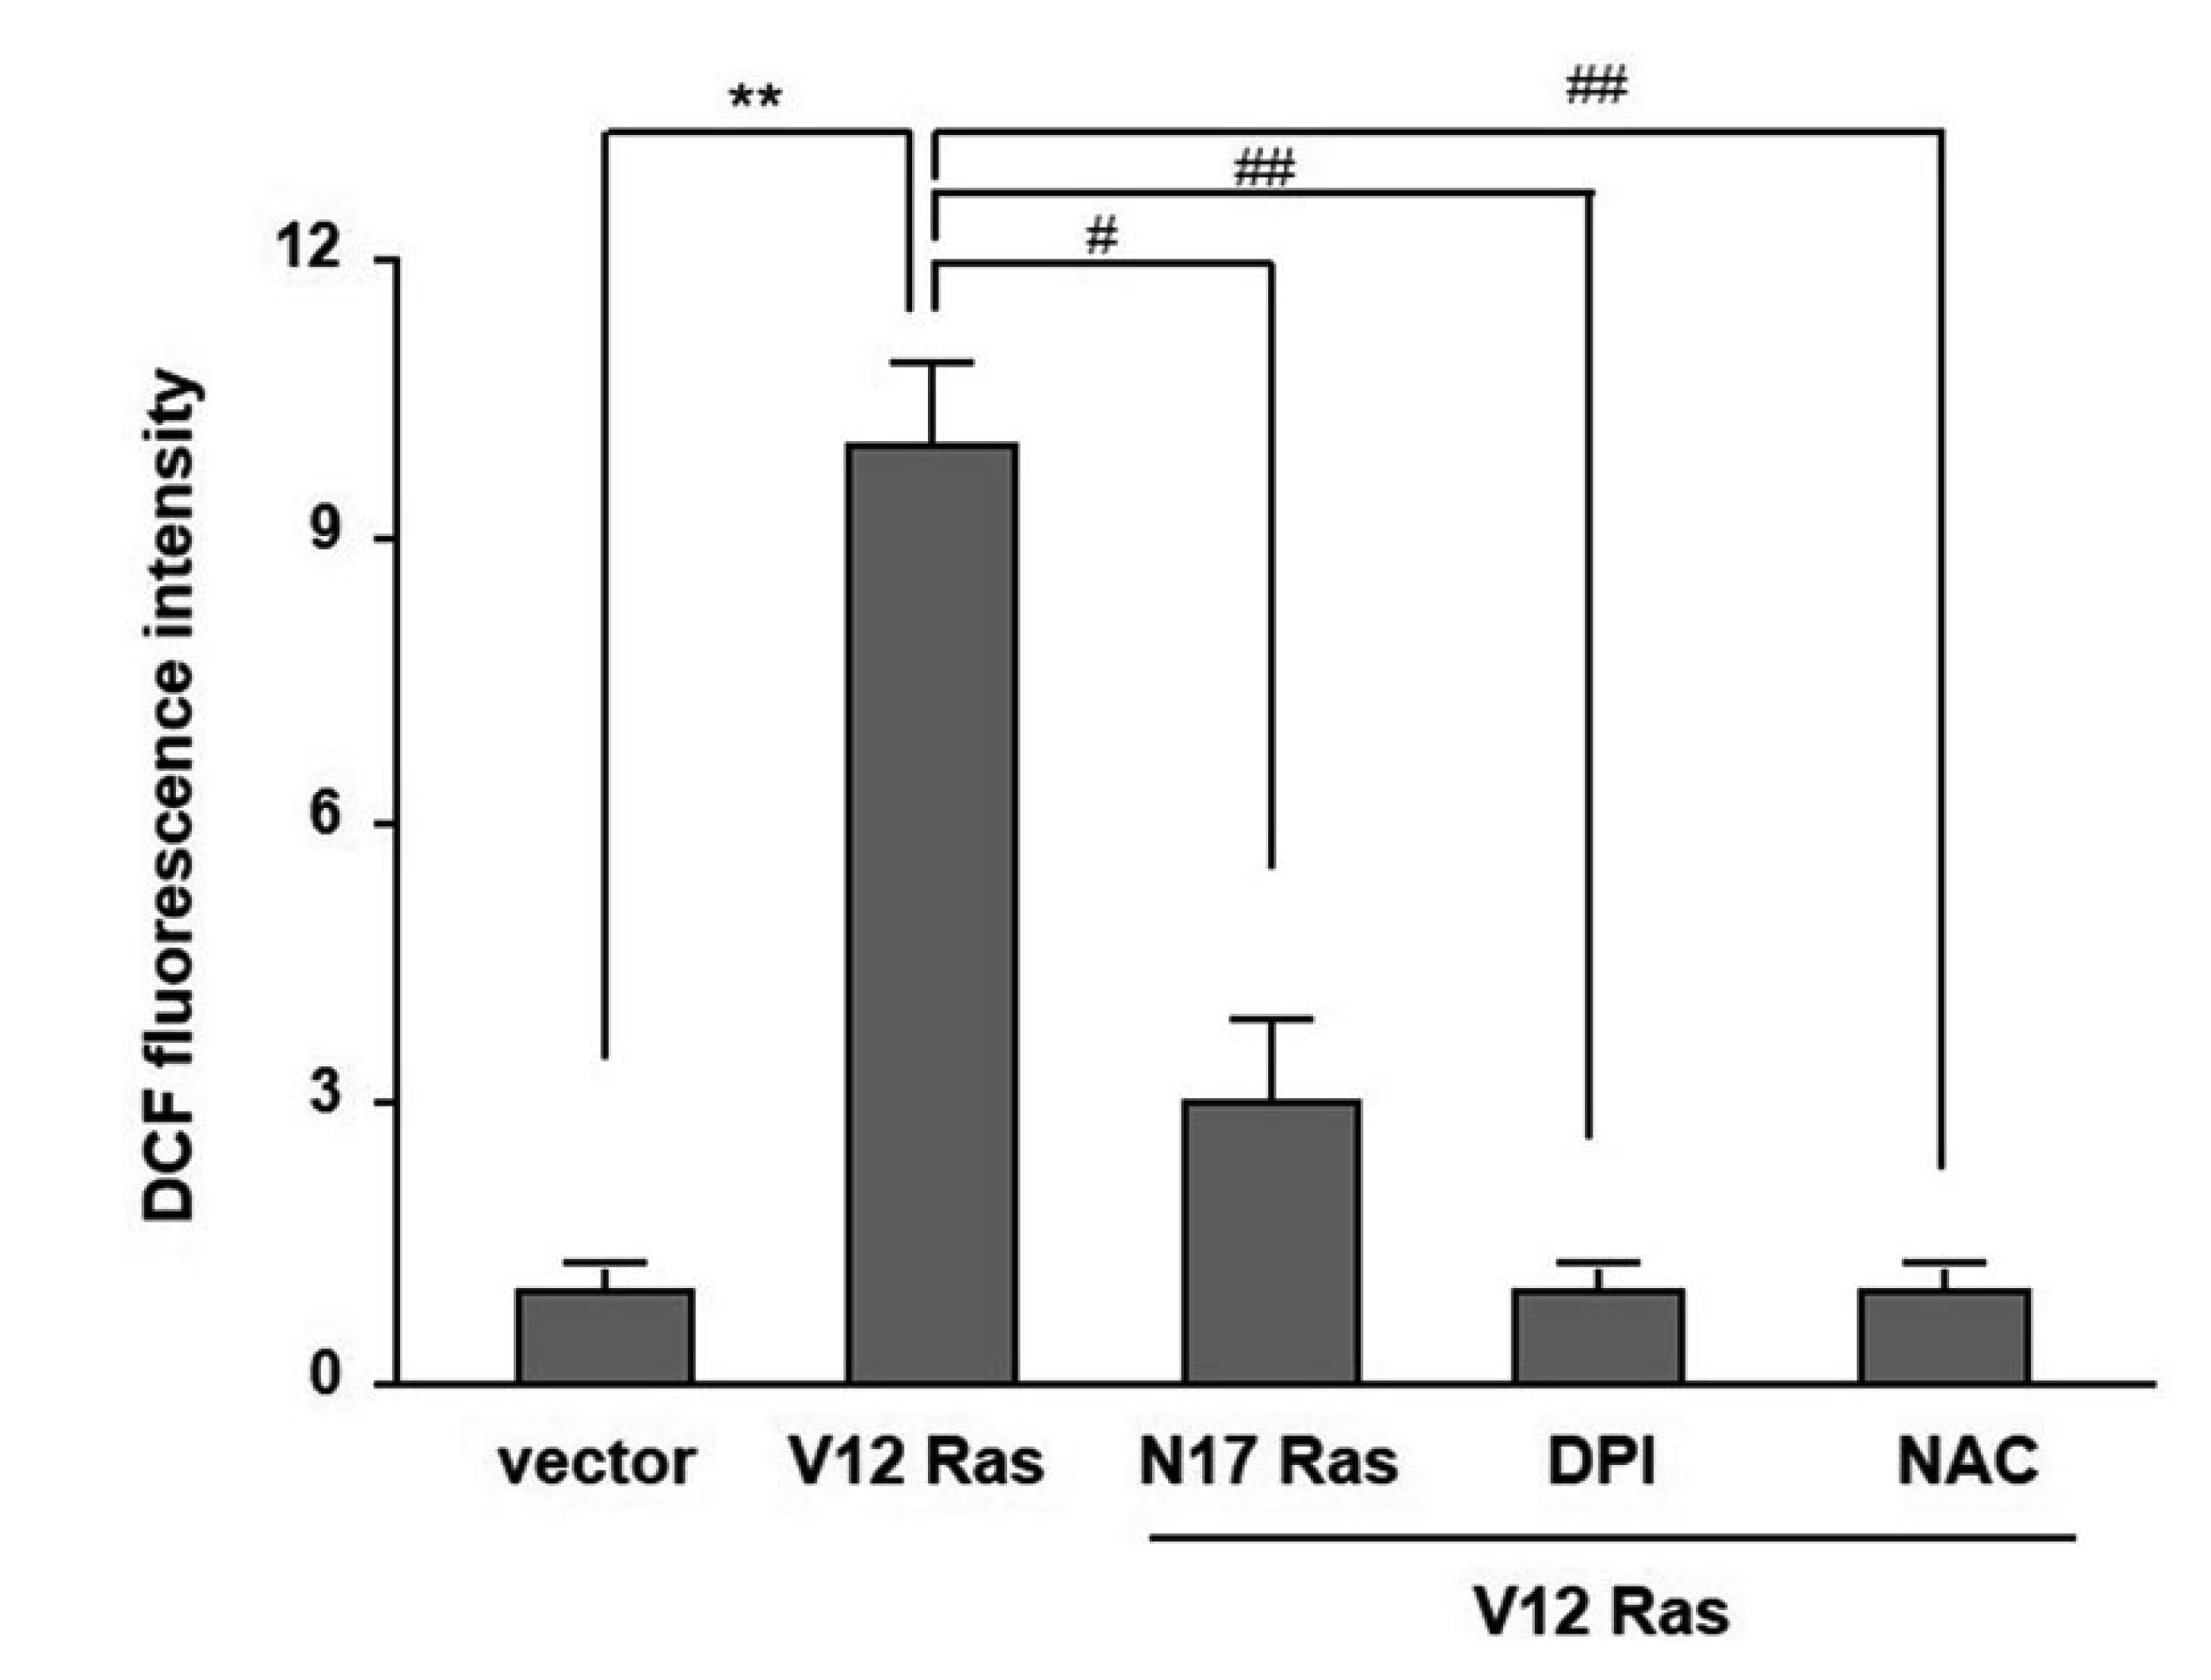 | Fig. 3Reactive oxygen species (ROS) production in the pcDNA3-NIH3T3 (vector) and V12-Ras-NIH3T3 (V12-Ras) cells.The cells were pretreated with 20 mM N-acetylcysteine (NAC) or 500 nM diphenylene iodonium (DPI), or transiently transfected with N17-Ras-pcDNA3 (N17-Ras). They were then incubated with DCFHDA, and a ROS assay was carried out as describe in “Methods”. Each point is the average of multiple independent experiments; the error bars represent ± standard deviation. **p < 0.01 vs. vector, #p < 0.05, ##p < 0.001 vs. V12-Ras.
|
To investigate the possibility that the enhancement in intracellular ROS levels by RasV12 expression contributes to the downregulation of mdr1b expression, we tested whether or not antioxidant increased mdr1b expression in RasV12-NIH3T3 cells. For this purpose, RasV12-NIH3T3 cells were treated with either DPI or NAC, and then cotransfected with mdr1b-Luc reporter plasmid or the pFR-Luc plasmid. After 24 h transfection, the mdr1b promoter activity and its mRNA level were then measured by a luminometer and RT-PCR, respectively. The data presented in Fig. 4A shows that both NAC and DPI were able to increase mdr1b-Luc activity in RasV12-NIH3T3 cells compared to the non-treated cells. However, both DPI and NAC did not affect pFR-Luc. Furthermore, RT-PCR data revealed that pretreating the RasV12-NIH3T3 cells with either NAC or DPI up-regulated mdr1b mRNA expression (Fig. 4B). Intracellular ROS was next investigated to determine whether or not it affected the doxorubicin-induced mdr1b promoter activity. As shown in Fig. 5, we found that mdr1b-Luc activity in the RasV12-NIH3T3 cells was significantly enhanced after increasing the doxorubicin dose in the presence of DPI and NAC versus the untreated control. These data indicate that intracellular ROS production is required for the RasV12-induced downregulation of mdr1b expression in NIH3T3 cells.
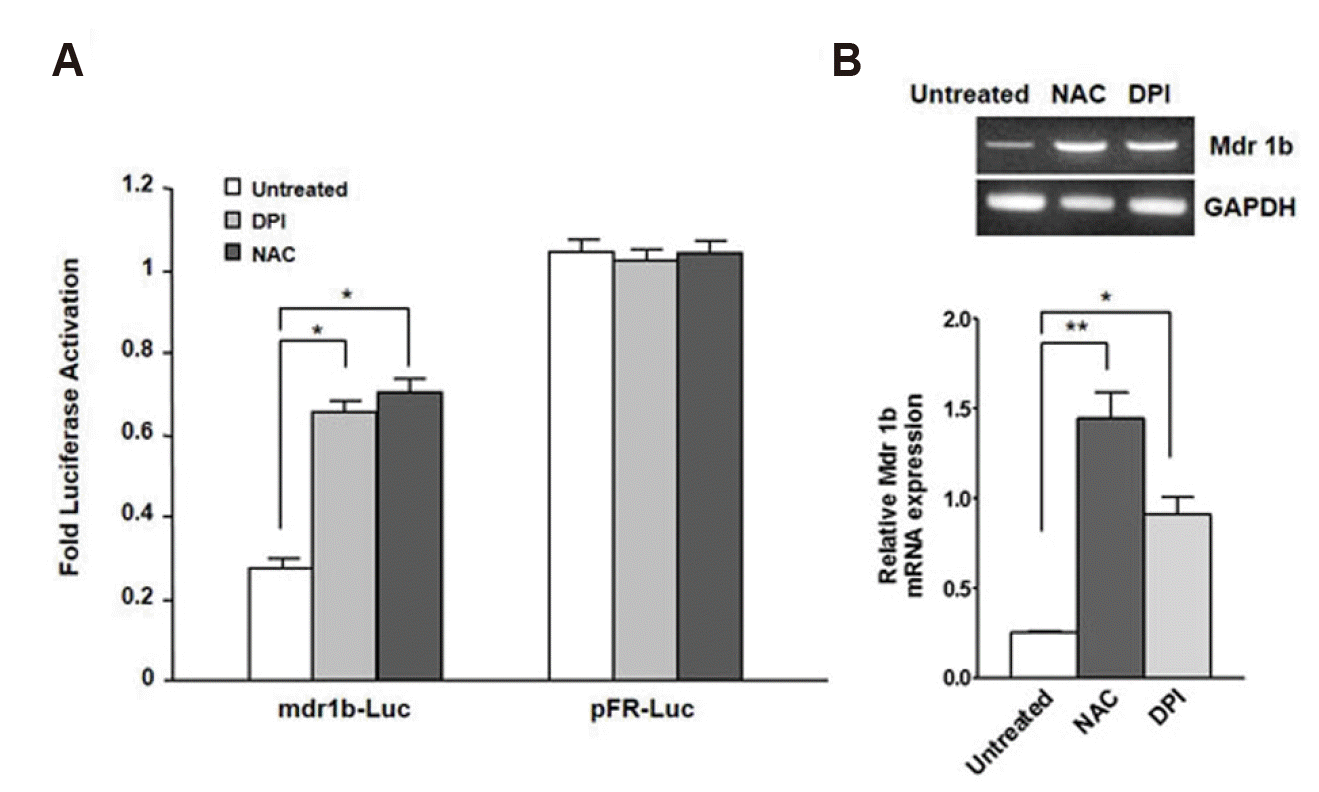 | Fig. 4Effect of N-acetylcysteine (NAC) and diphenylene iodonium (DPI) on basal level of mdr1b expression.(A) The V12-Ras-NIH3T3 (V12-Ras) cells were pretreated with either 20 mM NAC or 500 nM DPI for 12 h, and then cotransfected with either mdr1b-Luc or pFR-Luc and pRL-Luc. The luciferase activities were the luciferase activity was determined as described in Fig. 1A. Each point is the average of multiple independent experiments; the error bars represent ± standard deviation. (B) RT-PCR analysis of the mdr1b gene expression level in V12-Ras-NIH3T3 cells with NAC or DPI. The cells were pretreated with either NAC or DPI for 12 h. RT-PCR was performed with the total RNA extract (20 µg) and the PCR products were separated on 1.5% agarose gels, and stained with ethidium bromide. *p < 0.05, **p < 0.01 vs. untreated.
|
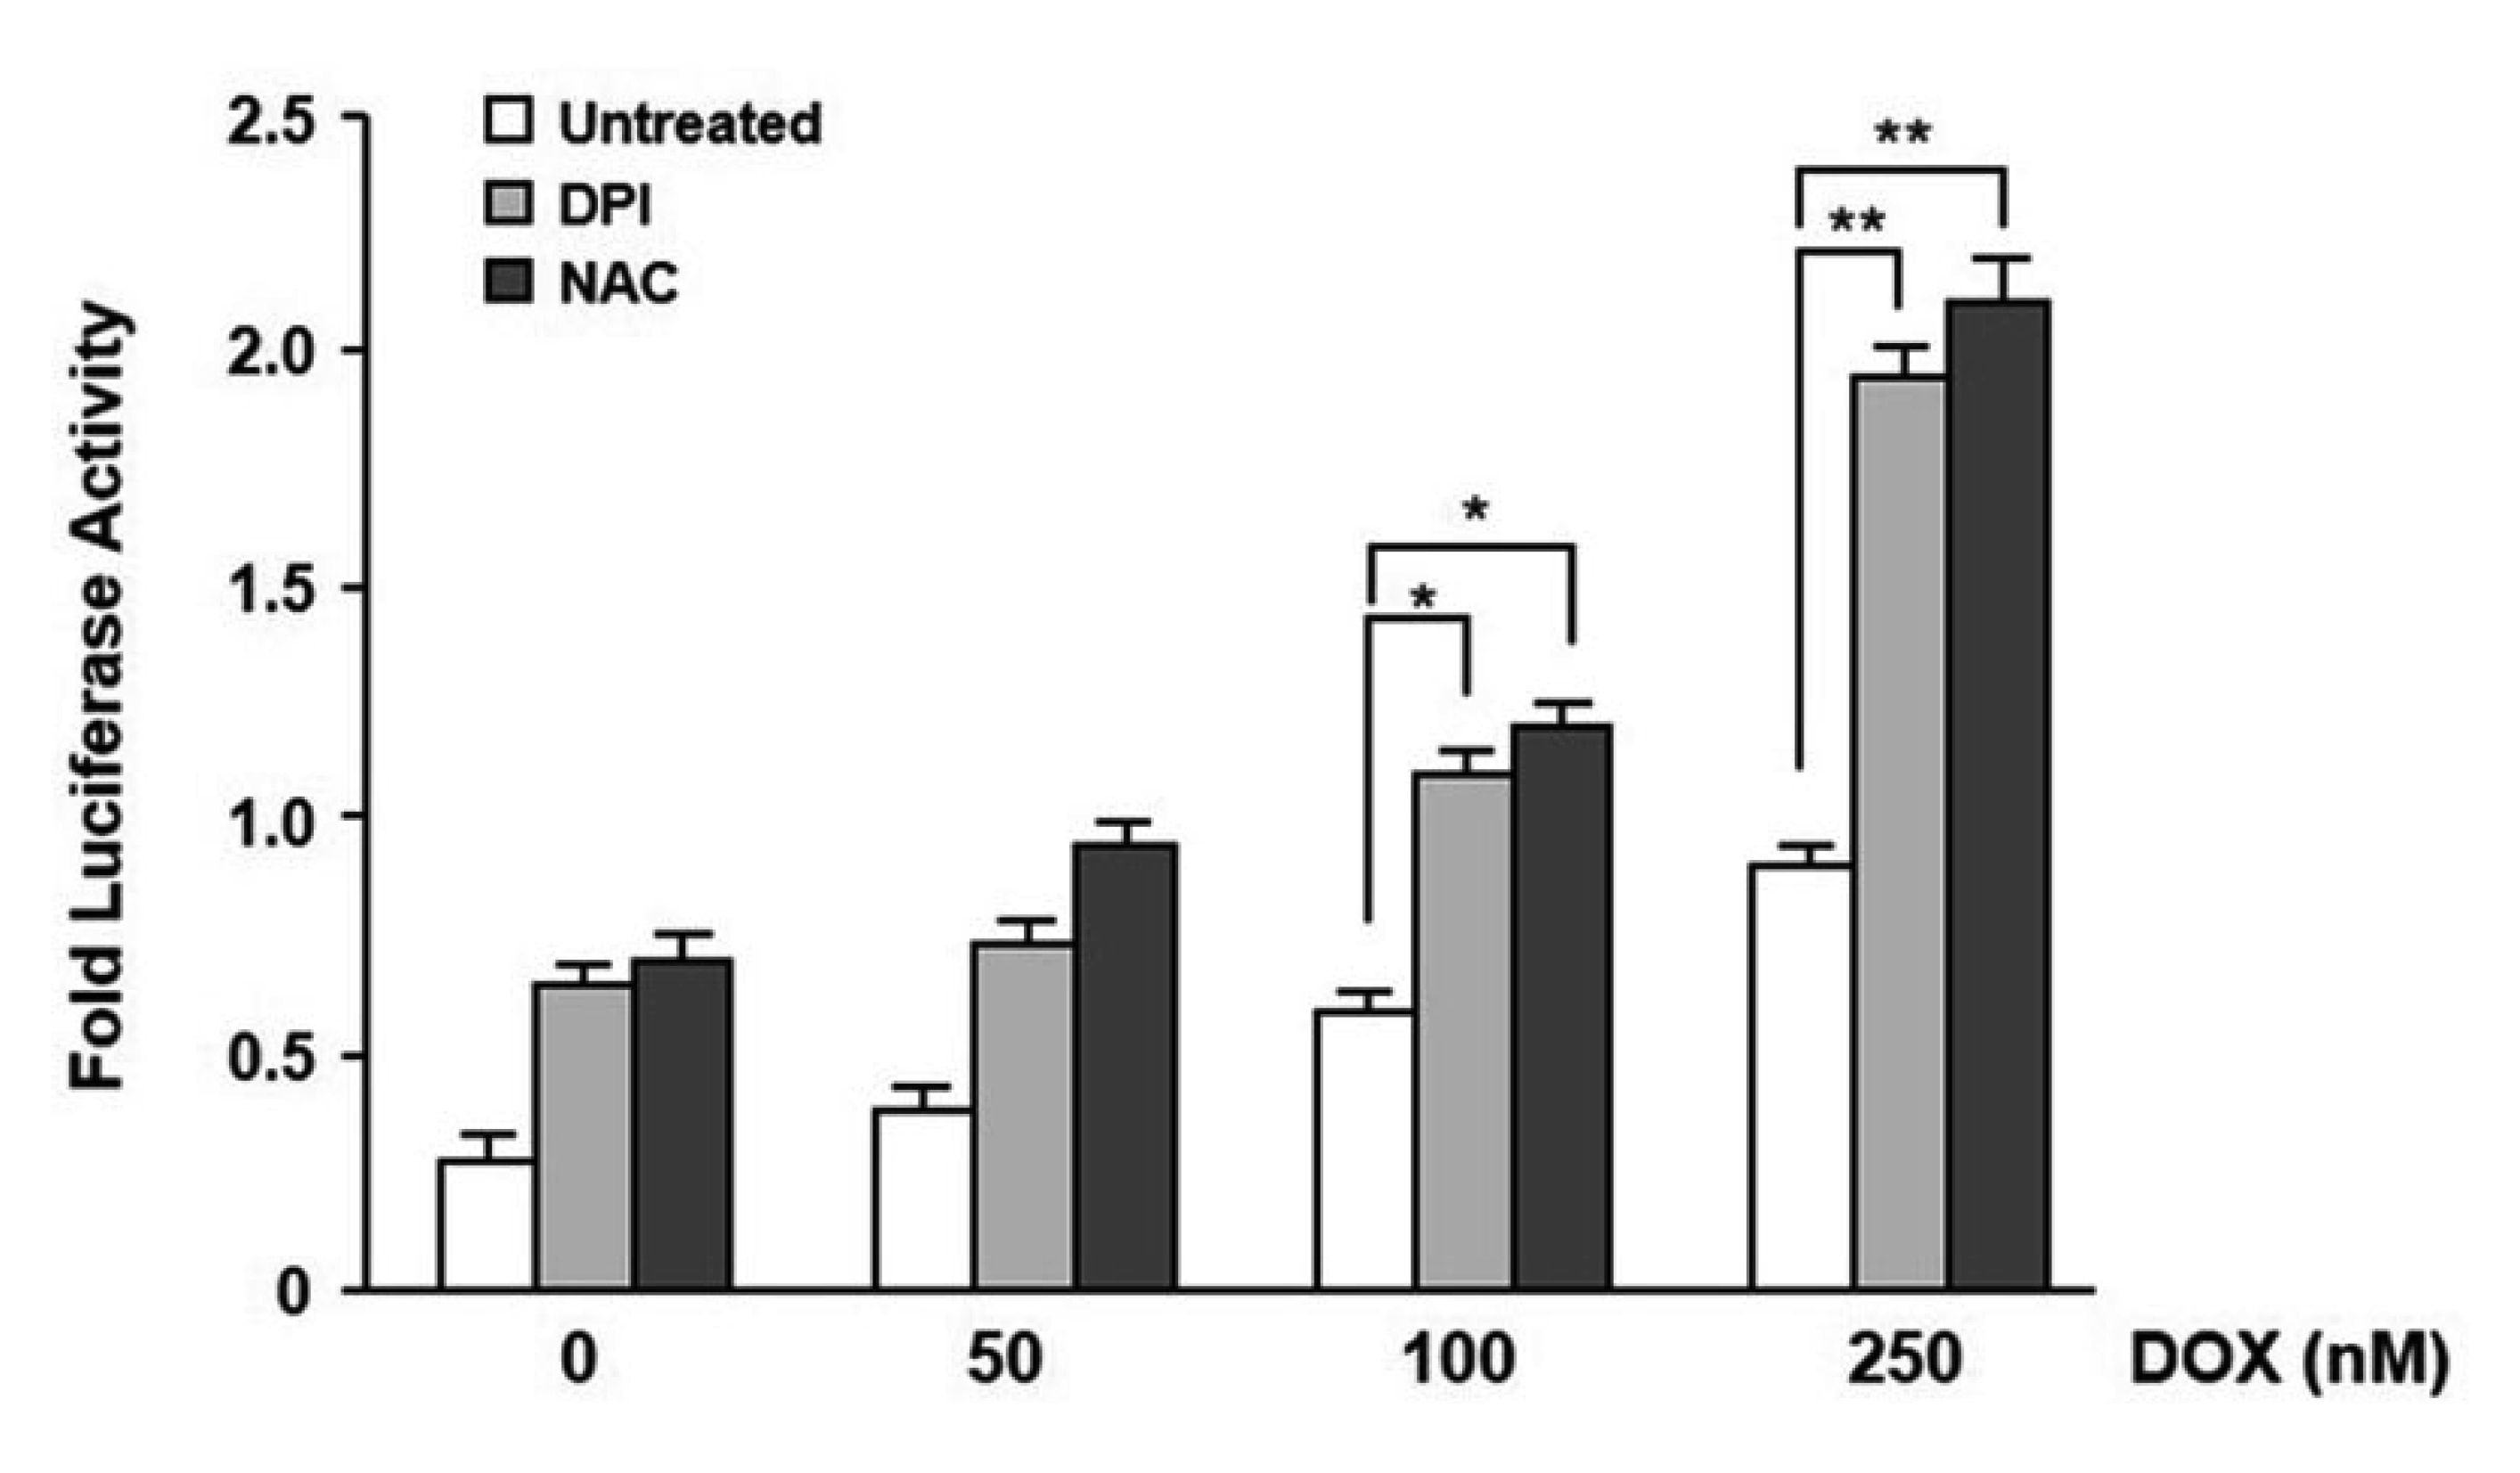 | Fig. 5Effect of N-acetylcysteine (NAC) and diphenylene iodonium (DPI) on the induction level of mdr1b expression by doxorubicin (DOX).The V12-Ras-NIH3T3 cells were pretreated with 20 mM NAC or 500 nM DPI for 12 h and then cotransfected with either mdr1b-Luc or pFR-Luc and pRL-Luc. Four hours after transfection, the cells were treated with 50, 100, or 250 nM doxorubicin for 24 h, after which the luciferase activities were determined as described in Fig. 1A. Each point is the average of multiple independent experiments; the error bars represent ± standard deviation. *p < 0.05 vs. untreated. **p < 0.01.
|
Involvement of ERK signal transduction in the downregulation of mdr1b expression
ROS proposed to stimulate mitogen-activated protein kinase (MAPK) activities including ERK, p38 and JNK [26]. Thus, increased ROS generation by RasV12 expression was investigate to determine whether it caused ERK activation, which would contribute to downregulation of mdr1b expression. To test this possibility, the pcDNA3-NIH3T3 or RasV12-NIH3T3 cells were treated with either DPI or NAC, and were subsequently cotransfected with Gal4-Elk1 or pFR-Luc. Twenty-four hours after transfection, the level of luciferase activity was measured. Elk1 is a transcription factor that is activated by MAPK signaling. The Gal4-Elk1 construct contains the Gal4 DNA binding domain fused to the Elk-1 carboxyl-terminal transactivation domain. The results, shown in Fig. 6A, demonstrated that RasV12-NIH3T3 cells exhibited a significantly increase in ERK activity versus the pcDNA3-NIH3T3 cells, and the suppression of ROS production by treatment with either DPI or NAC resulted in the inhibition of Ras activation of Gal4-Elk1 by 50%, but NAC and DPI had no effect on pFR-Luc. As a control, ERK inhibitors PD98059 and U0126 were found to completely block the H-RasV12- activation of ERK activity. ERK activity was next investigated to determine whether or not it contributes to the Ras-mediated downregulation of mdr1b expression. The RasV12-NIH3T3 cells were treated with DMSO, PD98059, or U0126. The cells were then cotransfected with Gal4-Elk1 or pFR-Luc, 48 h transfection, cells were treated with or without 250 nM doxorubicin. After 24 h, the levels of luciferase activity were then measured. Pretreatment of RasV12-NIH3T3 cells with either PD98059 or U0126 increases the basal level of mdr1b-Luc activity compared with that of the untreated cells. Furthermore, blocking the ERK signaling pathway led to the stimulation of the doxorubicin-induced mdr1b-Luc activity versus the untreated cells (Fig. 6B).
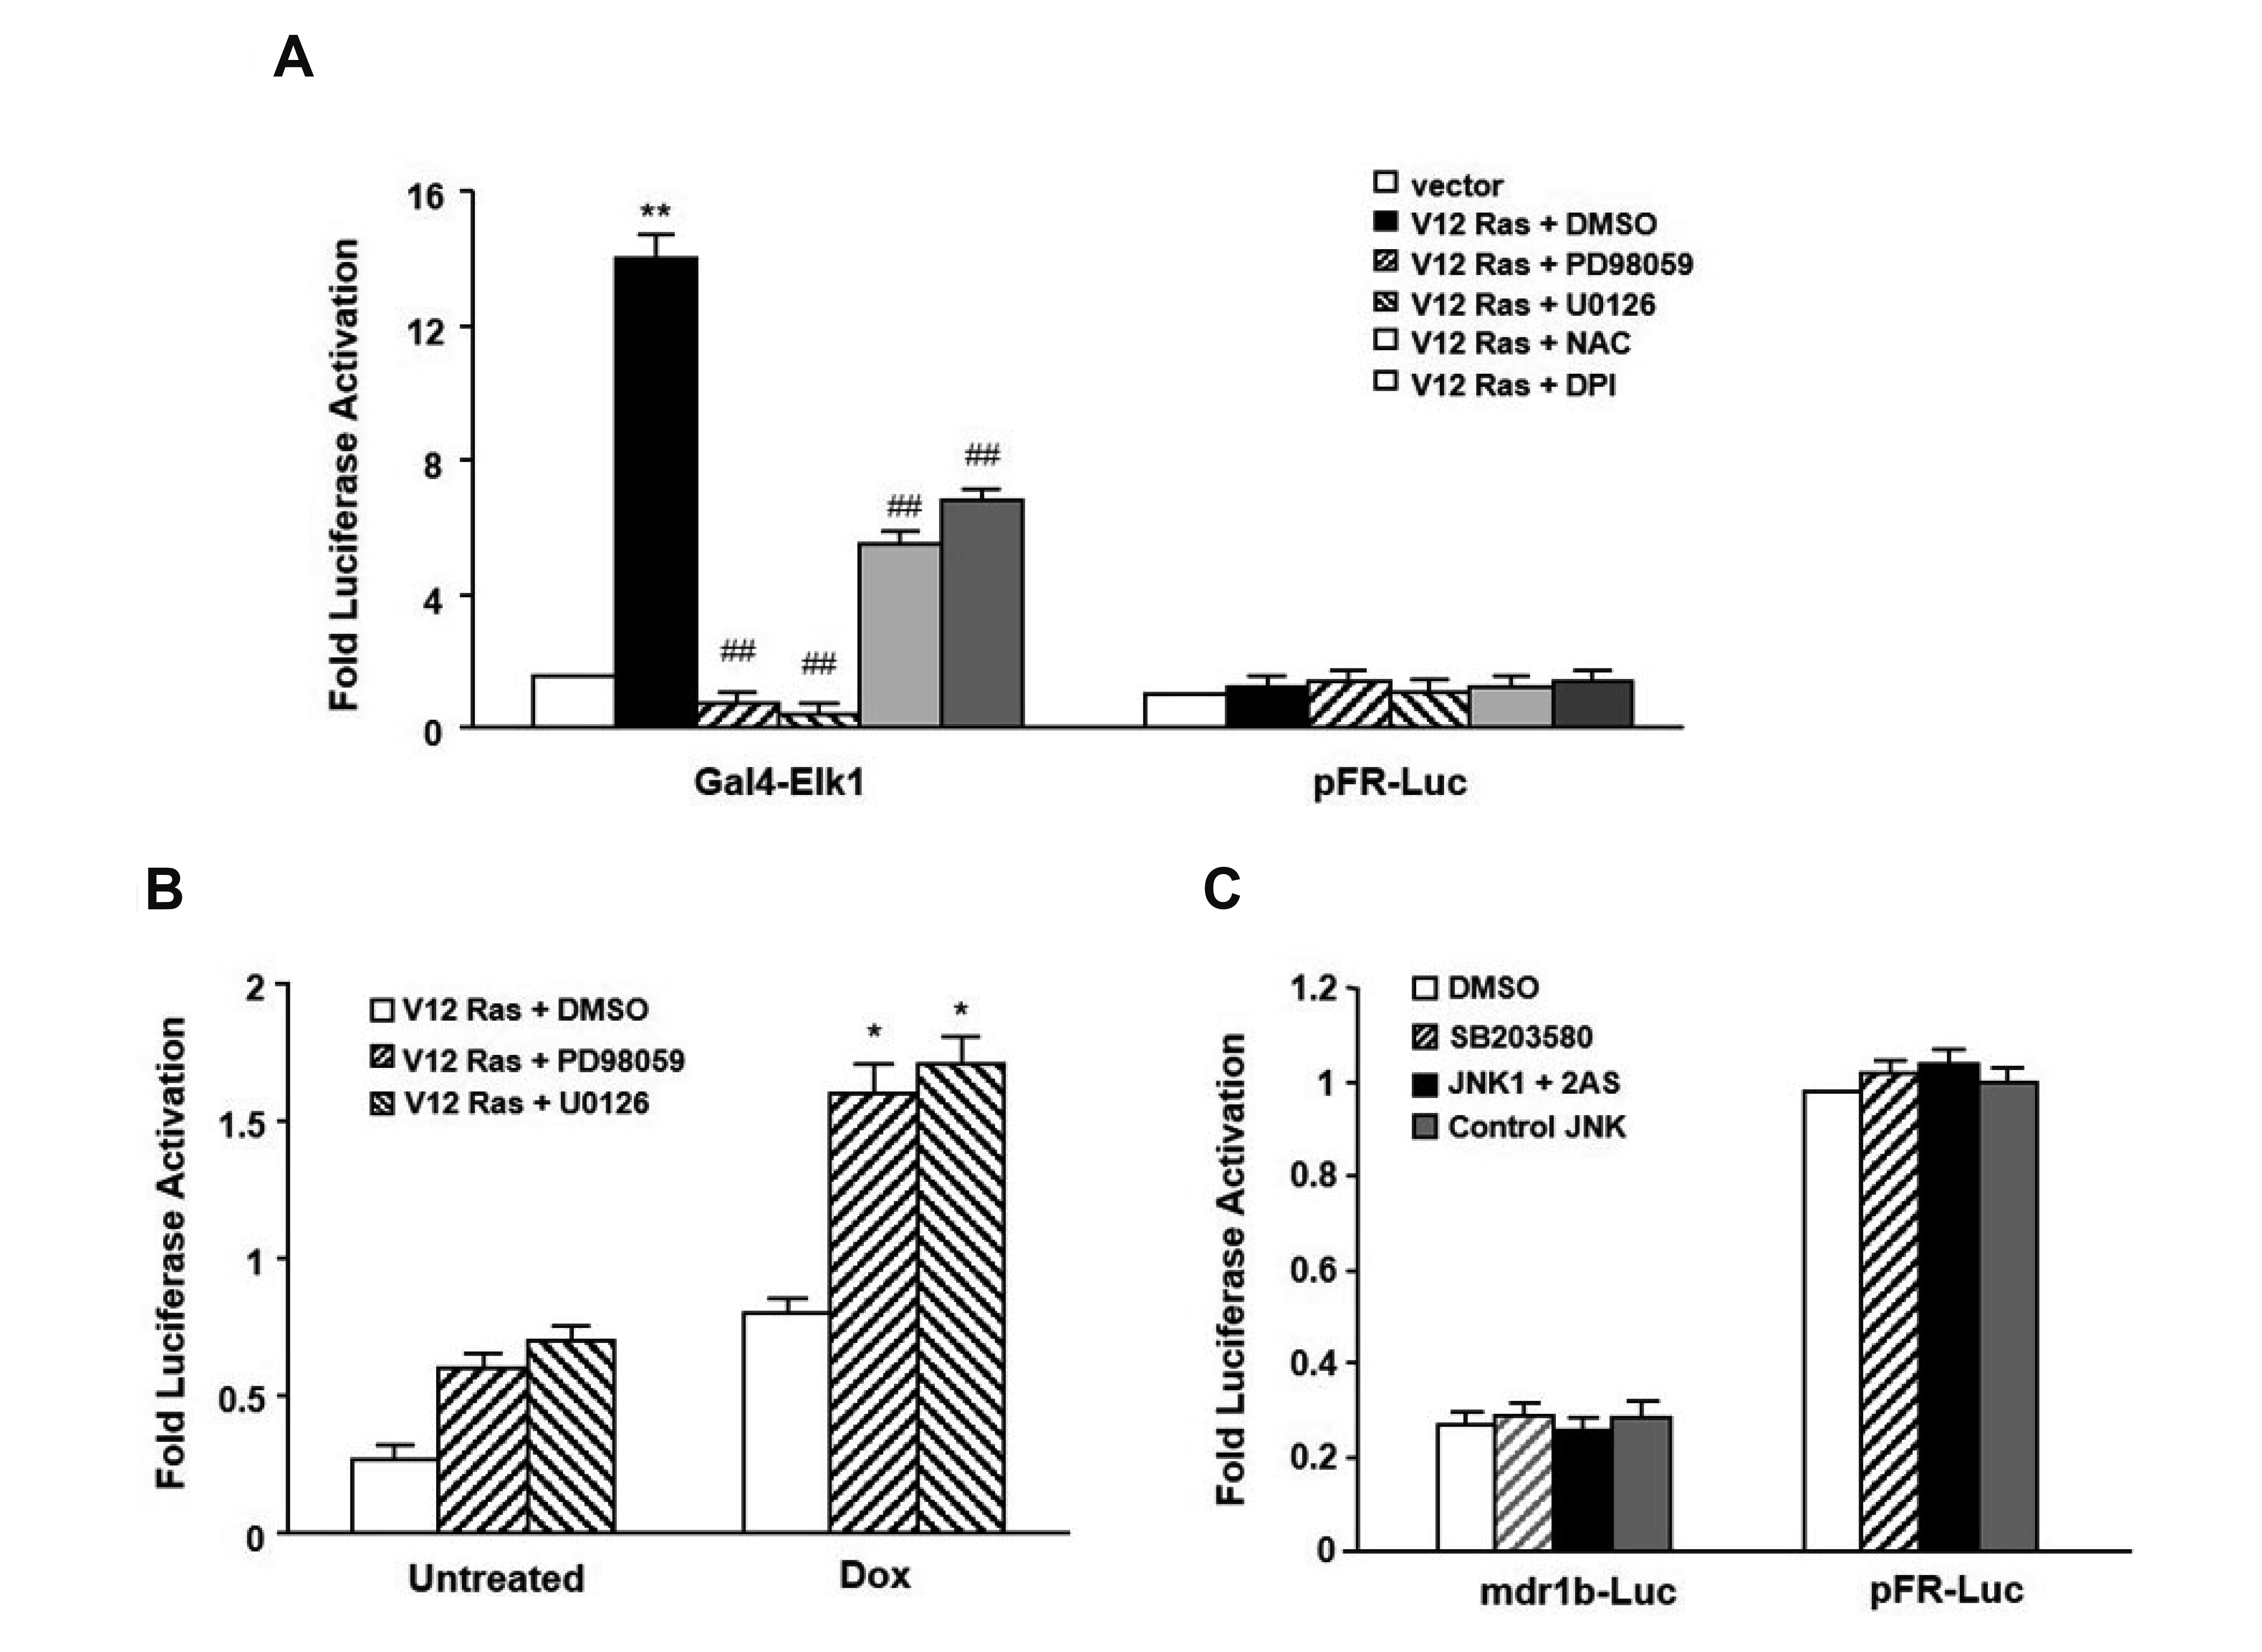 | Fig. 6Effect of ERK signaling pathway in the regulation of mdr1b expression.(A) pcDNA3-NIH3T3 (vector) and V12-Ras-NIH3T3 (V12-Ras) cells were pretreated with either DMSO or the indicated compounds, at the following concentrations: 50 µM PD98059, 20 µM U0126, 10 mM NAC, and 500 nM DPI. Subsequently, the cells were cotransfected with either the Gal4-Elk1 or pFR-Luc plasmid and pRL-CMV. The luciferase activities were then measured 24 h after transfection determined as described in Fig. 1A. (B) V12-Ras-NIH3T3 cells were incubated 50 µM PD98059 or 20 µM U0126 for 30 min and then cotransfected with mdr1b-Luc and pRL-Luc. Four hours after transfection the medium was replaced with fresh medium in the presence or absence of 250 nM doxorubicin (DOX), and 24 h later, the luciferase activities were determined as described in Fig. 1A. (C) V12-Ras-NIH3T3 cells were pretreated with DMSO or p38 inhibitor 20 µM SB2303580, or transiently transfection with a combination of JNK1AS and JNK2AS (JNK1+2AS) or control oligonuleotides (control JNK). The cells were then cotransfected with mdr1b-Luc and pRL-Luc, and the luciferase activities were determined as described in Fig. 1A. Each point is the average of multiple independent experiments; the error bars represent ± standard deviation. *p < 0.05 vs. V12-Ras, **p < 0.01 vs. vector, and ##p < 0.001 vs. V12-Ras.
|
To address the potential contribution of JNK and p38 in the RasV12-mediated downregulation of mdr1b expression, RasV12-NIH3T3 cells were treated with the P38 kinase inhibitor, SB203580 or transfected with antisense JNK1 and JNK2, which inhibit JNK pathway [20]. They were then transfected with the mdr1b-Luc reporter plasmid. After 24 h, the luciferase activities were measured. As shown in Fig. 6C, the blocking of these signaling pathways had little effect on mdr1b expression in the RasV12-NIH3T3 cells. These results suggest that ERK activity, but not JNK and p38, contributes to the ROS-mediating down-regulation of mdr1b expression in the V12-Ras-NIH3T3 cells.
The effect of mdr1b expression on cellular response to doxorubicin
If the intracellular ROS production and ERK activation play an importing role in the Ras-mediated downregulation of mdr1b expression, then the agents capable of inhibiting ROS production and blocking ERK activity, when combined with doxorubicin treatment, should inhibit their cytotoxicity. To test this possibility, doxorubicin-induced apoptosis in RasV12-NIH3T3 and pcDNA3-NIH3T3 cells with or without antioxidant and MEK inhibitors were compared. As shown in Fig. 7, doxorubicin increased apoptosis with increasing doses, and a dose of 250 nM doxorubicin led to induced approximately 40% apoptosis after 24 h of treatment in control NIH3T3 cells. In contrast, the RasV12-NIH3T3 cells showed very high sensitivity to doxorubicin and apoptosis was great than 90% at the concentration of 250 nM doxorubicin. However, the combination of either doxorubicin with NAC or DPI reduced the apoptotic response of the RasV12- NIH3T3 cells, and treatment of the RasV12-NIH3T3 cells with the ERK inhibitors reduced apoptotic response versus the untreated cells.
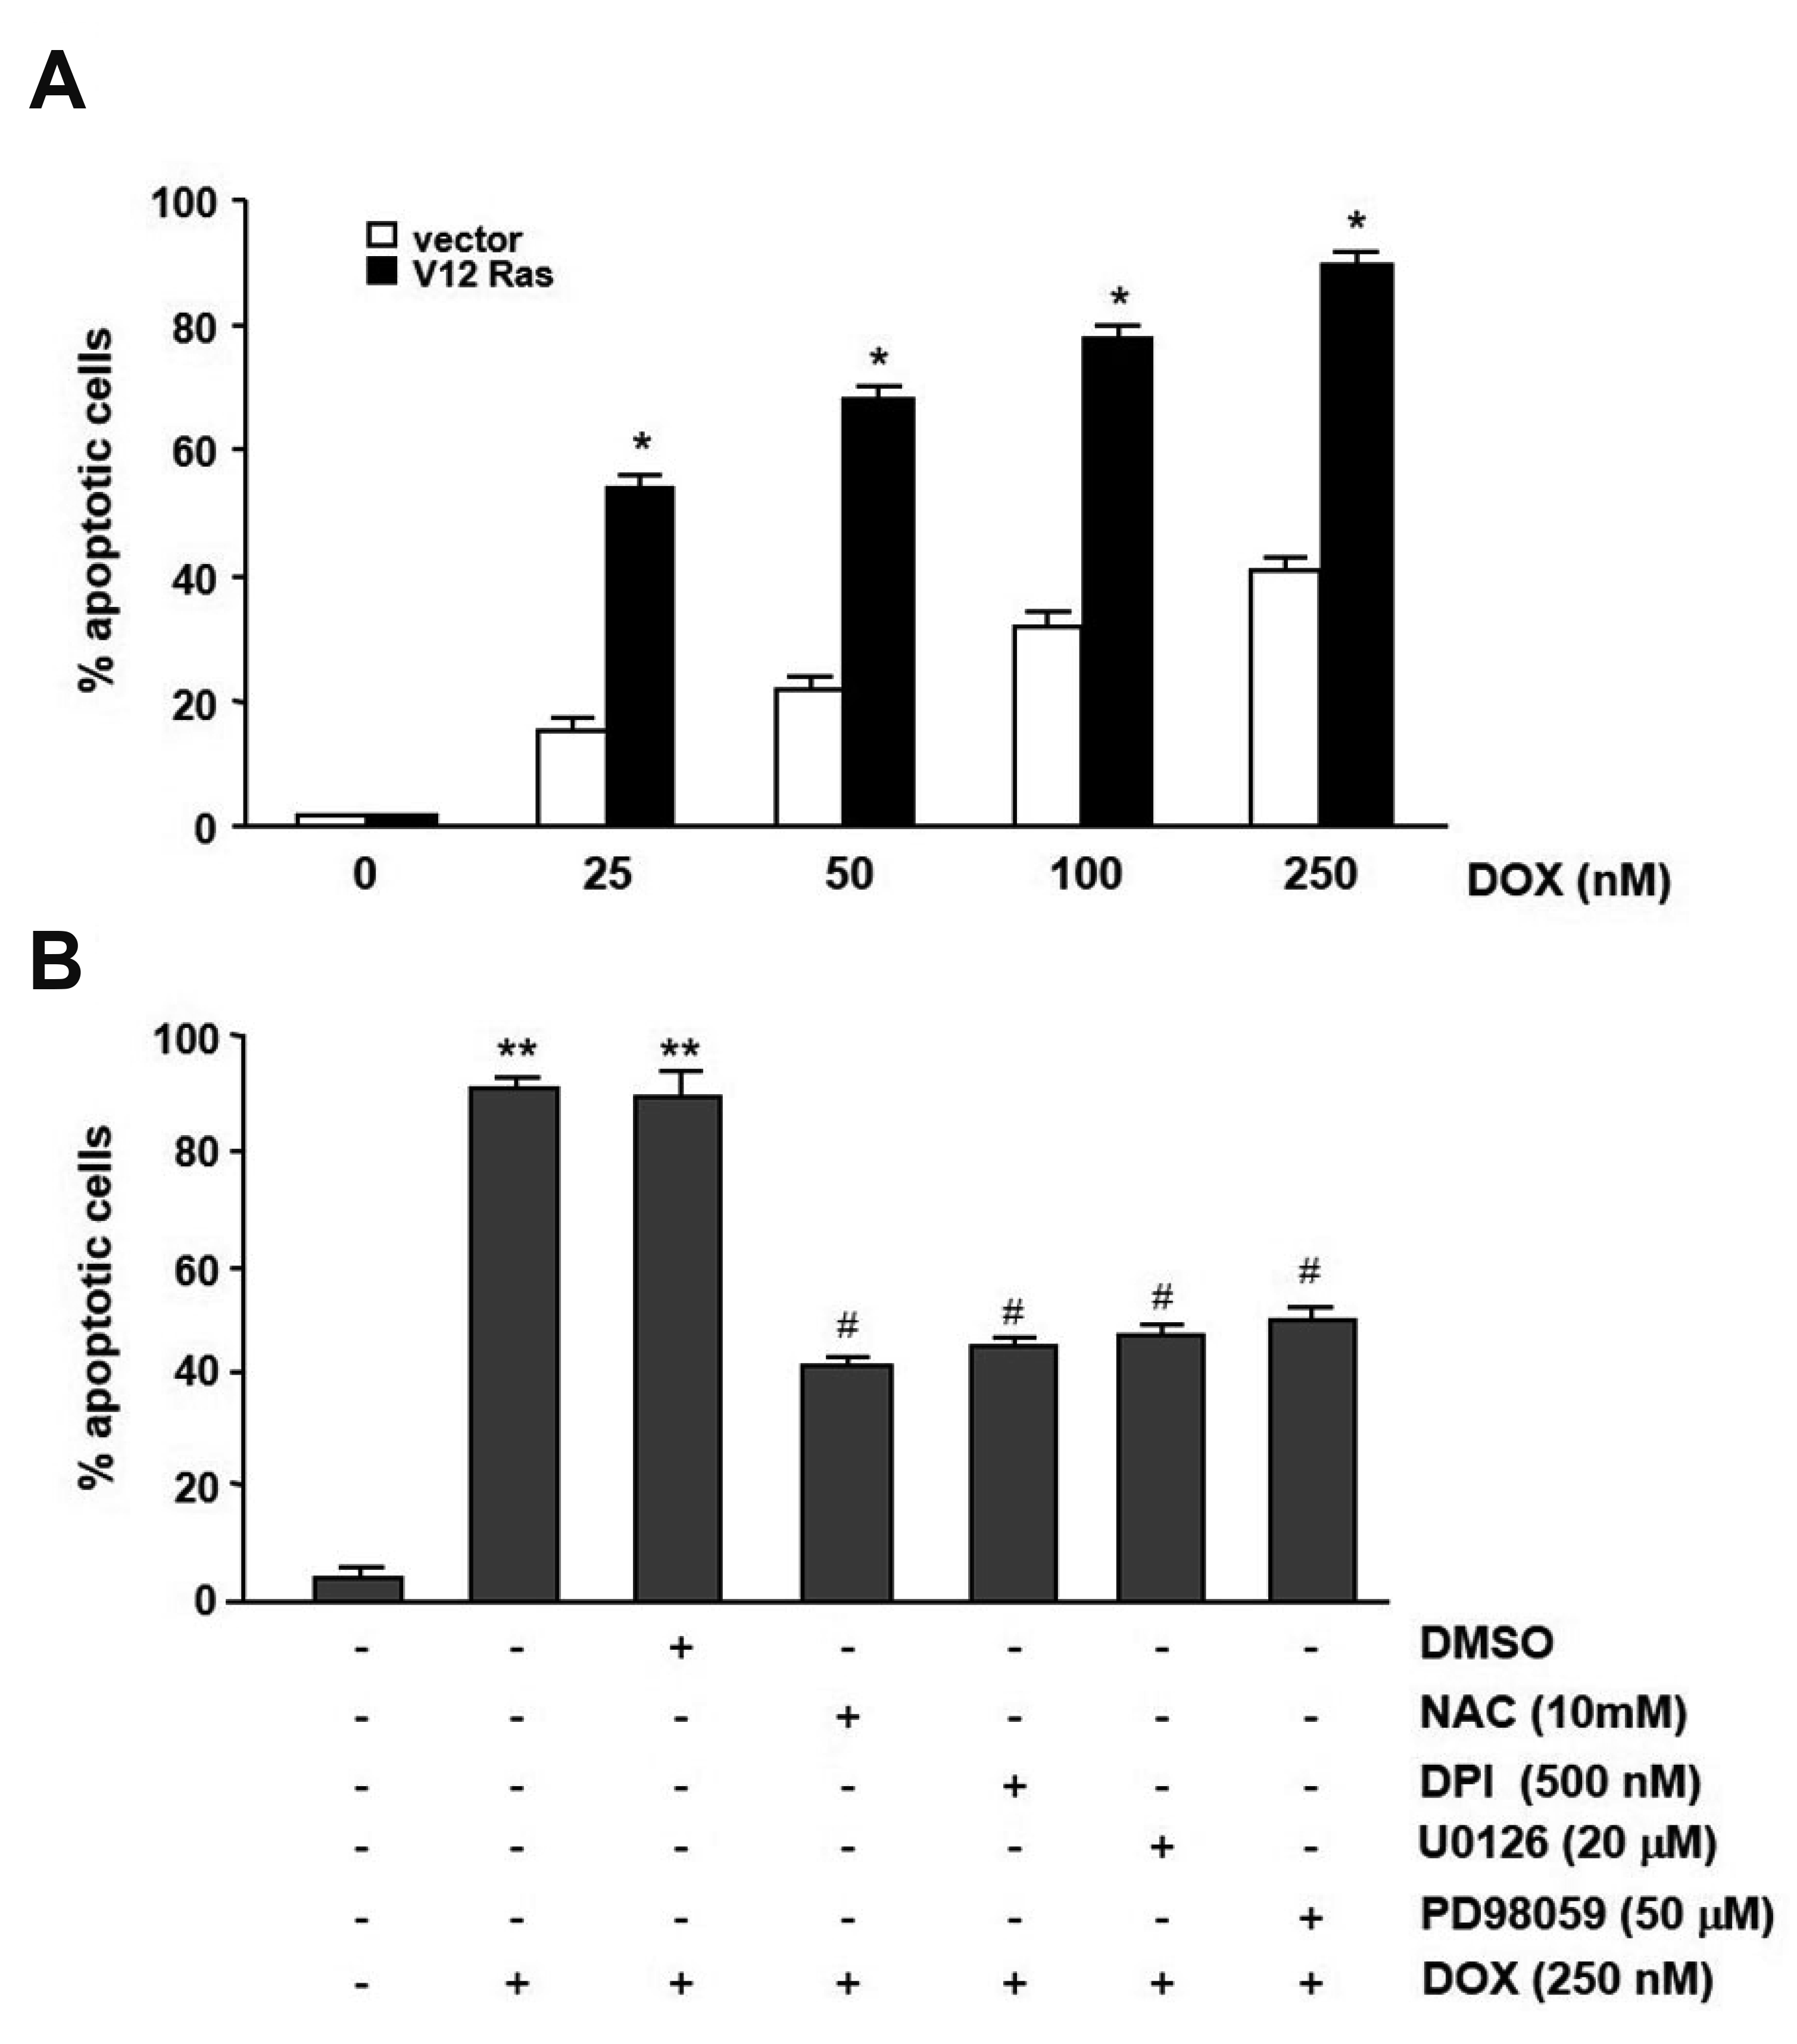 | Fig. 7Effect of mdr1b expression by doxorubicin on apoptotic cell death.(A) pcDNA3-NIH3T3 (vector) and V12-Ras-NIH3T3 (V12-Ras) cells were treated with the indicated doxorubicin (DOX) doses for 24 h. Subsequently, the cells were stained with propidium iodide, after which apoptosis was analyzed by flow cytometry. (B) Pretreatment of V12-Ras-NIH3T3 cells with 20 mM NAC, 500 nM DPI, 50 µM PD9850 or 20 µM U0126, and the apoptosis was then measured. The Bars represented standard deviation. values determined from at least three independent experiments. *p < 0.05 vs. vector, **p < 0.01 vs. DMSO, and #p < 0.005 vs. DOX.
|
Go to :
DISCUSSION
A high frequency of point mutations in the Ras gene, which occurs in approximately 30% of human cancers, can lead to a transformation and advanced tumor progression [4,5]. Oncogenic mutation of Ras has been reported to be involved in tumorigenesis in various human tumors, so discovering the molecular mechanisms of Ras-mediated mdr1b regulation can result in superior cancer management. In spite of several reports on the effect of oncogenic Ras on the MDR expression, there are inconsistent results regarding the relation between oncogenic Ras and mdr expression. The transformation of rat liver epithelial cells with the Ras oncogene caused appearance of MDR [6]. In addition, the promoter of the mdr1 gene was shown to be a potential target for the H-Ras oncogene [27], which suggests that the mdr1 gene could be activated during the tumor progression related with oncogenic H-Ras. Therefore, it is possible that oncogenic Ras could up-regulate mdr1b gene expression. However, others have suggested that an oncogenic Ras transformation had no effect on mdr-1 gene expression [9] and H-Ras expression led to the downregulation of mdr-1 gene expression in human colon carcinoma and acute myeloid leukemia cells [10,11]. In this study, we tries to determine the relationship between dominant active H-Ras and mdr1b expression. In order to understand the possible role of oncogenic H-Ras in mdr1b expression, NIH3T3 cells were transfected either with the dominant active H-Ras expression plasmid, RasV12-pcDNA3 or an empty expression plasmid, pcDNA3. To determine the mdr1b expression level, a reporter assay was used for measuring the mdr1b promoter activity and a RT-PCR assay was used for measuring the expression of mdr1b mRNA level. Oncogenic Ras expression was found to lead to the down-regulation of mdr1b expression and dominant negative Ras (RasN17) prevented the RasV12 as-mediated decrease in mdr1b promoter activity. In addition, the RasV12-NIH3T3 cells exhibited a decrease in doxorubicin-induced mdr1b-Luc activity (Figs. 1 and 2) and potentiate doxorubicin-induced apoptosis compared to the control cells. These results indicate that oncogenic H-Ras expression is contributed to the downregulation of mdr1b expression.
Although ROS are thought to be toxic to cells, it has recently been reported that ROS act as secondary messenger that regulates the cellular proliferation in variety of eukaryotic cells [26,28]. The oncogenic Ras produced ROS in NIH3T3 [22], HaCaT [23], and WI38 cells [25]. It is believed that these ROS generation is induced by Ras-mediated NADPH oxidase activity, which is located in the cellular membrane in non-phagocytic cells. It was confirmed that RasV12 expression increased ROS generation, which was reduced by RasN17 or by DPI. The promoter of rat mdr1b gene contains several transcriptional factor-binding sites, such as AP-1, NF-κB, NF-Y and p53 [29-32], and it is these factors that exhibit redox-sensitivity [33-35]. Several reports have shown that mdr1b can be induced by intracellular ROS production [17,18] and that the activation of the NF-κB redox-sensitive transcriptional factors by intracellular ROS production may be involved in mdr1b induction [19]. However, other studies have reported that an enhancement of ROS levels downregulates Pgp expression [36] and that this downregulation is mediated by activating the receptor tyrosine kinase pathway [37]. In the present study, evidence that intracellular ROS is important for the down-regulation of mdr1b expression in V12-Ras-NIH3T3 cells was provided. Pretreatment of V12-Ras-NIH3T3 cells with NAC and DPI led to an effective increase in mdr1b promoter activity and mdr1b mRNA expression (Figs. 4 and 5). This suggests that Ras overexpression could down-regulate mdr1b expression via the enhancement of intracellular ROS. A number of stresses and chemicals, such as, UV irradiation [38], heat stress [39], TNF-α [40] and benzopyrine [41] are able to induce Pgp expression. Most of these stress factors are known to stimulate production of large amount of ROS. However, induction of mdr1b expression in response to H2O2 treatment at concentrations in excess of 1 mM [18] may be associated with various physiological responses in cells. This is because these concentrations are highly toxic to cells, and would cause apoptosis [18,37]. Therefore, Pgp may have an important role in preventing apoptosis under severe oxidative stress, presumably by regulating the anti-apoptotic or apoptotic protein [42,43]. Low H2O2 concentrations (< 10 µM) are effective in activating ERK [44] and regulating cell proliferation [45]. Moreover, these concentrations are markedly lower than those necessary to trigger apoptosis [46]. Therefore, ROS levels can have different concentration-dependent roles in the regulation of MDR expression.
Important questions remaining are: how do ROS cause the mdr1b downregulation? What are the downstream factors contributed to mdr1b expression? Indeed, intracellular ROS can modulate many signal transduction pathways. However, the downstream effectors of ROS remains unclear. There is increasing number of reports that intracellular ROS level is physiologically related to regulating gene expression and activating MAPK. A recent study suggests that JNK activation plays an important intracellular regulator in response to various anticancer drugs and can affect the MDR phenotype [47,48]. In addition, MDR phenotype of the L120/VCR mouse leukemic cells was associated with increased p38 [49]. Moreover, increased ERK activity was attribute to MDR-1 overexpression in Taxol-resistance cell lines [50]. However, Osborn et al. [51] reported that the induction of MDR1 is required for the PKC activity, but ERK, p38 or JNK had no effect on MDR1 expression in K562 cells. However, in this study it was the inhibition of the ERK pathway, but not p38 and JNK, led to enhanced mdr1b promoter activity and inhibited doxorubicin-mediated apoptosis induction in RasV12-expressing cells (Fig. 6). The activation of the ERK pathway is known to have a role in the pro-survival signal against various toxic stimuli [52]. However, recent several studies have been reported that the suppression of ERK pathway cause enhanced sensitivity to anticancer drugs [53]. Moreover, ERK activation is also contributed to in the development of apoptosis in B lymphoma cells [54], neuronal cells [55], HeLa and human lung A549 cells [56]. In this system using NIH3T3 cells, a strong correlation between inhibiting the ERK pathway and a resistance to doxorubicin toxicity was found (Fig. 7B), indicating that ERK contributes to the downregulation of mdr1b expression. The Raf/ERK/MEK cascade is a major down-stream signaling pathway of oncogenic Ras [57]. Therefore, there is the possibility that ERK activation induced by V12-Ras expression acts directly to down-regulate mdr1b expression. However, the direct contribution of ERK to mdr1b inhibition by oncogenic Ras does not appear to be significant, because blocking ROS generation significantly decreased mdr1b expression and prevented doxorubicin-induced apoptosis. Furthermore, treating the V12-Ras-NIH3T3 cells with either NAC or DPI led to a decrease ERK activity. Some cancer cells promote cell growth by increasing intracellular ROS generation [45]. The intracellular ROS concentration of these cancer cells may contribute to the downregulation of mdr-1 level. Consequently, measuring the ROS concentration and ERK activity would be useful strategy for predicting which cancers may respond to anticancer drugs. Although the molecular mechanism by which mdr1 mRNA expression is reduced by increasing ERK activity is currently unclear, however, since ERK activity modulates gene expression by increasing or inhibiting the activity of various transcription factors, we speculate that the increase in ERK induced by ROS suppresses the activity of certain transcription factors acting on the mdr1 promoter, resulting in a decrease in mdr1 expression. It will be clarified through future research.
In conclusion, the current findings provide strong evidence that oncogenic Ras overexpression in NIH3T3 cells leads to the down-regulation of mdr1b expression through intracellular ROS production, and that the ERK activation induced by ROS, at least in part, participates in down-regulating mdr1b expression.
Go to :
 XML Download