INTRODUCTION
METHODS
Reagents and antibodies
Cell lines and culture conditions
Plasmid DNA and transient transfection
Establishment of the ATG5 KO cell line
Quantitative reverse transcription PCR (RT-qPCR) analysis
Table 1
Autophagy assay
Cell survival assay
Cell cycle analysis by flow cytometry
Apoptotic assay by flow cytometry
RESULTS
Generation and validation of a Ras-NIH 3T3/Mdr ATG5 KO cell line
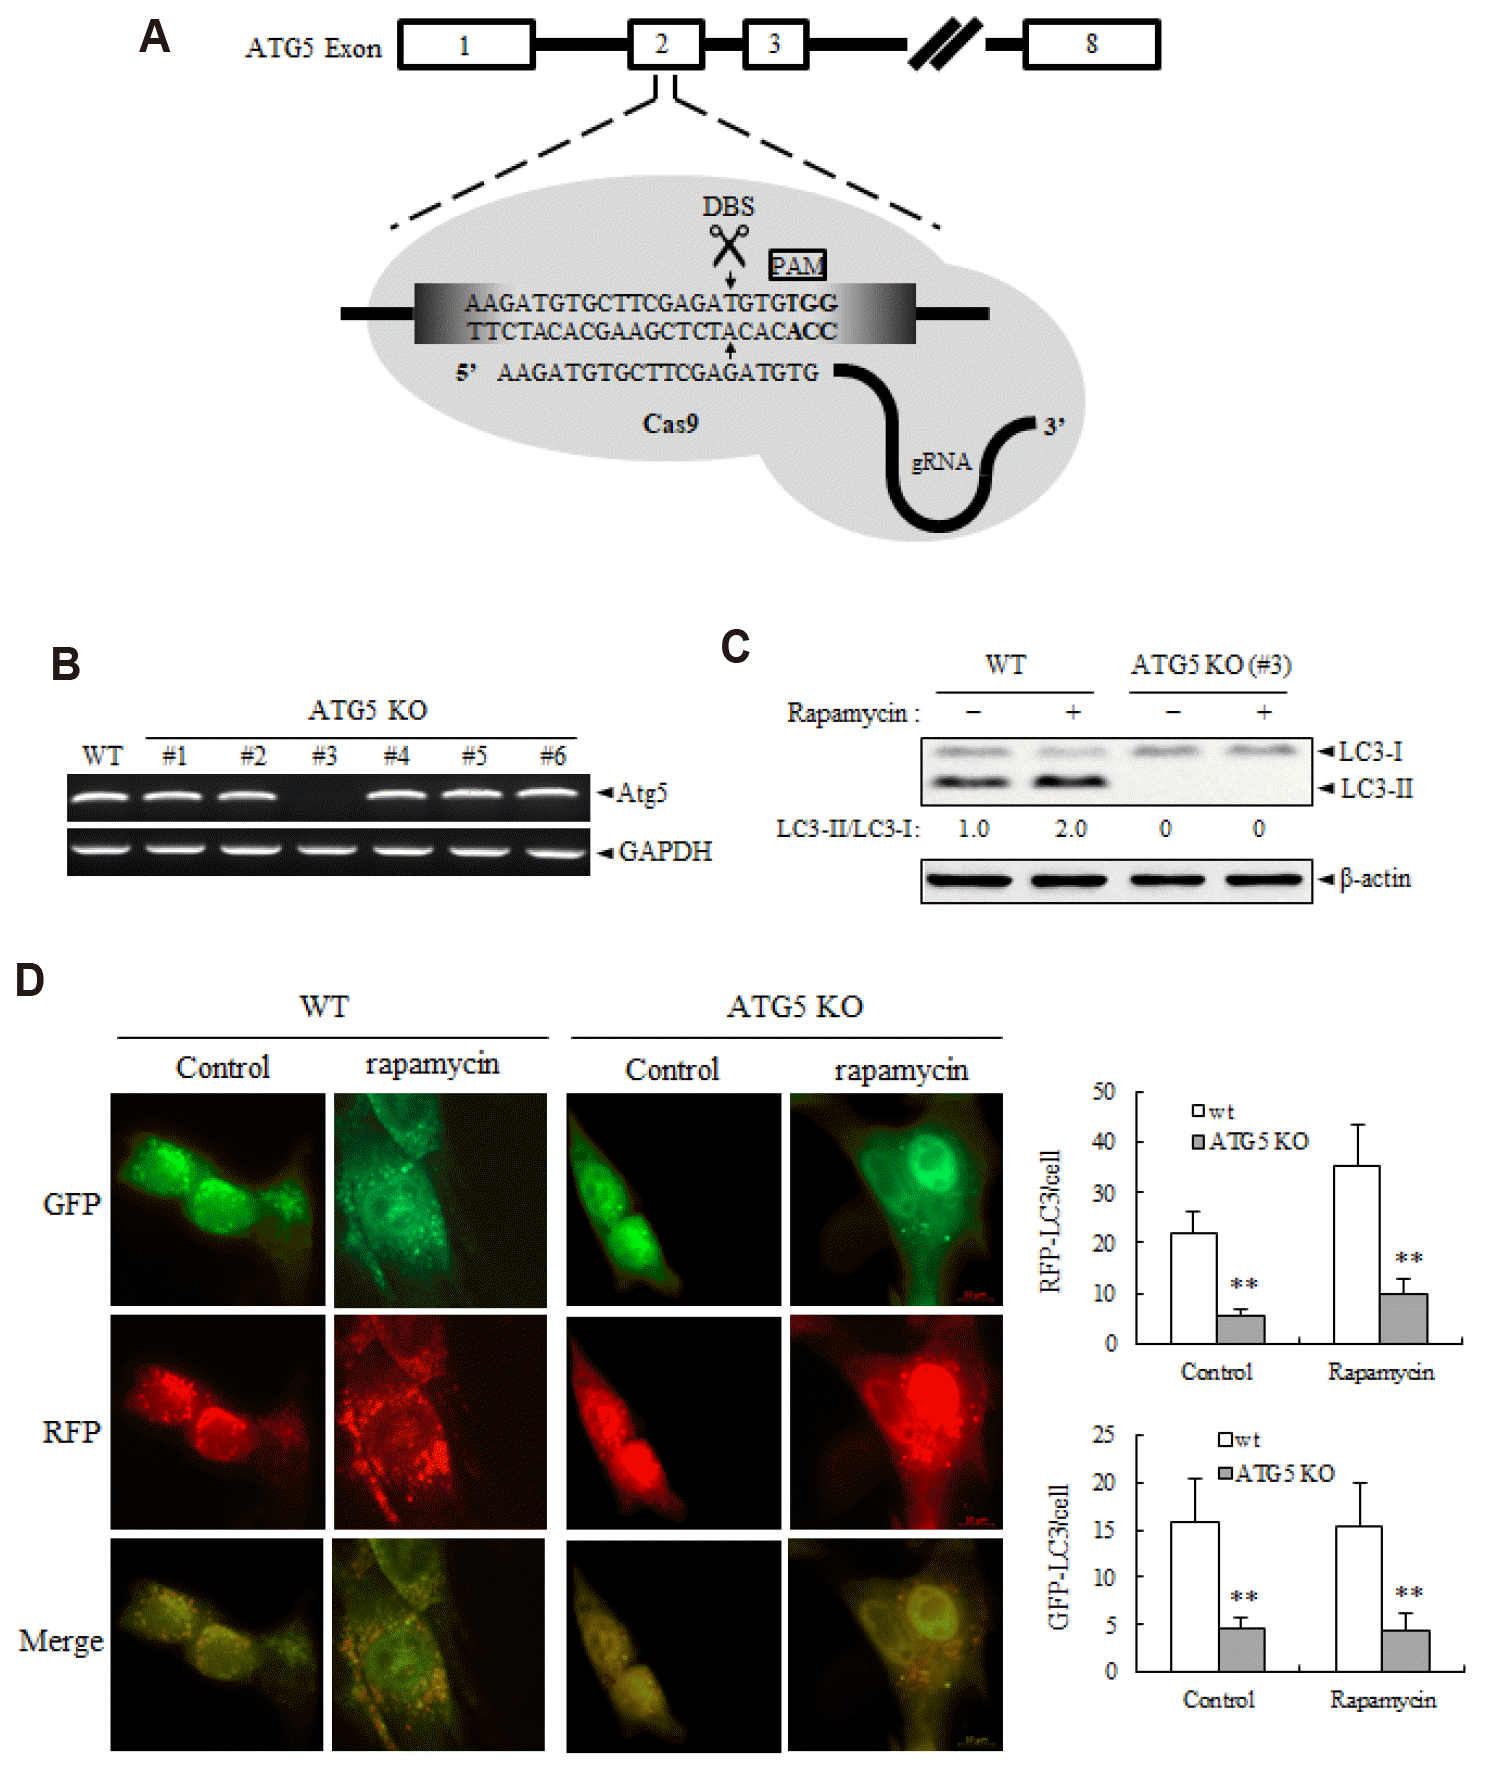
 | Fig. 1Validation of the ATG5 knockout (KO) in Ras-NIH 3T3/Mdr cells.(A) The sgRNA target site is located at the exon 2 of ATG5 gene. The 20-nt guide sequence comprising the 5΄-end of the chimeric sgRNA is shown. (B) RT-PCR was performed to confirm KO of ATG5. PCR products were by agarose gel electrophoresis (2.0% [w/v] agarose). GAPDH was used as a internal control. (C) To confirm autophagy deficiency in the ATG5 KO cell line, cells were treated with rapamycin (250 nM). The conversion of soluble LC3-I to lipid bound LC3-II was identified by immunoblotting. β-Actin expression was used as a protein loading control. Results shown here are representative of at least three independent experiments. (D) Autophagic flux were measured using the ptfLC3 plasmid that simultaneously expresses RFP- and GFP-tagged LC3 protein. (D, left panel) Representative images showing GFP-LC3 and mRFP-LC3 puncta. Early autophagosomes show GFP-RFP colocalization whereas late, acidic autophagosomes lose GFP and appear red. (D, right panel) Quantitative analysis of GFP-LC3 puncta and RFP-LC3 puncta. Data are expressed as mean ± SD. DSB, double-strand break; WT, wild-type. **p < 0.01 as compared with ATG5 WT cells, as determined by Dunnett’s t-test.
|
ATG5 KO restores paclitaxel sensitivity in MDR cells
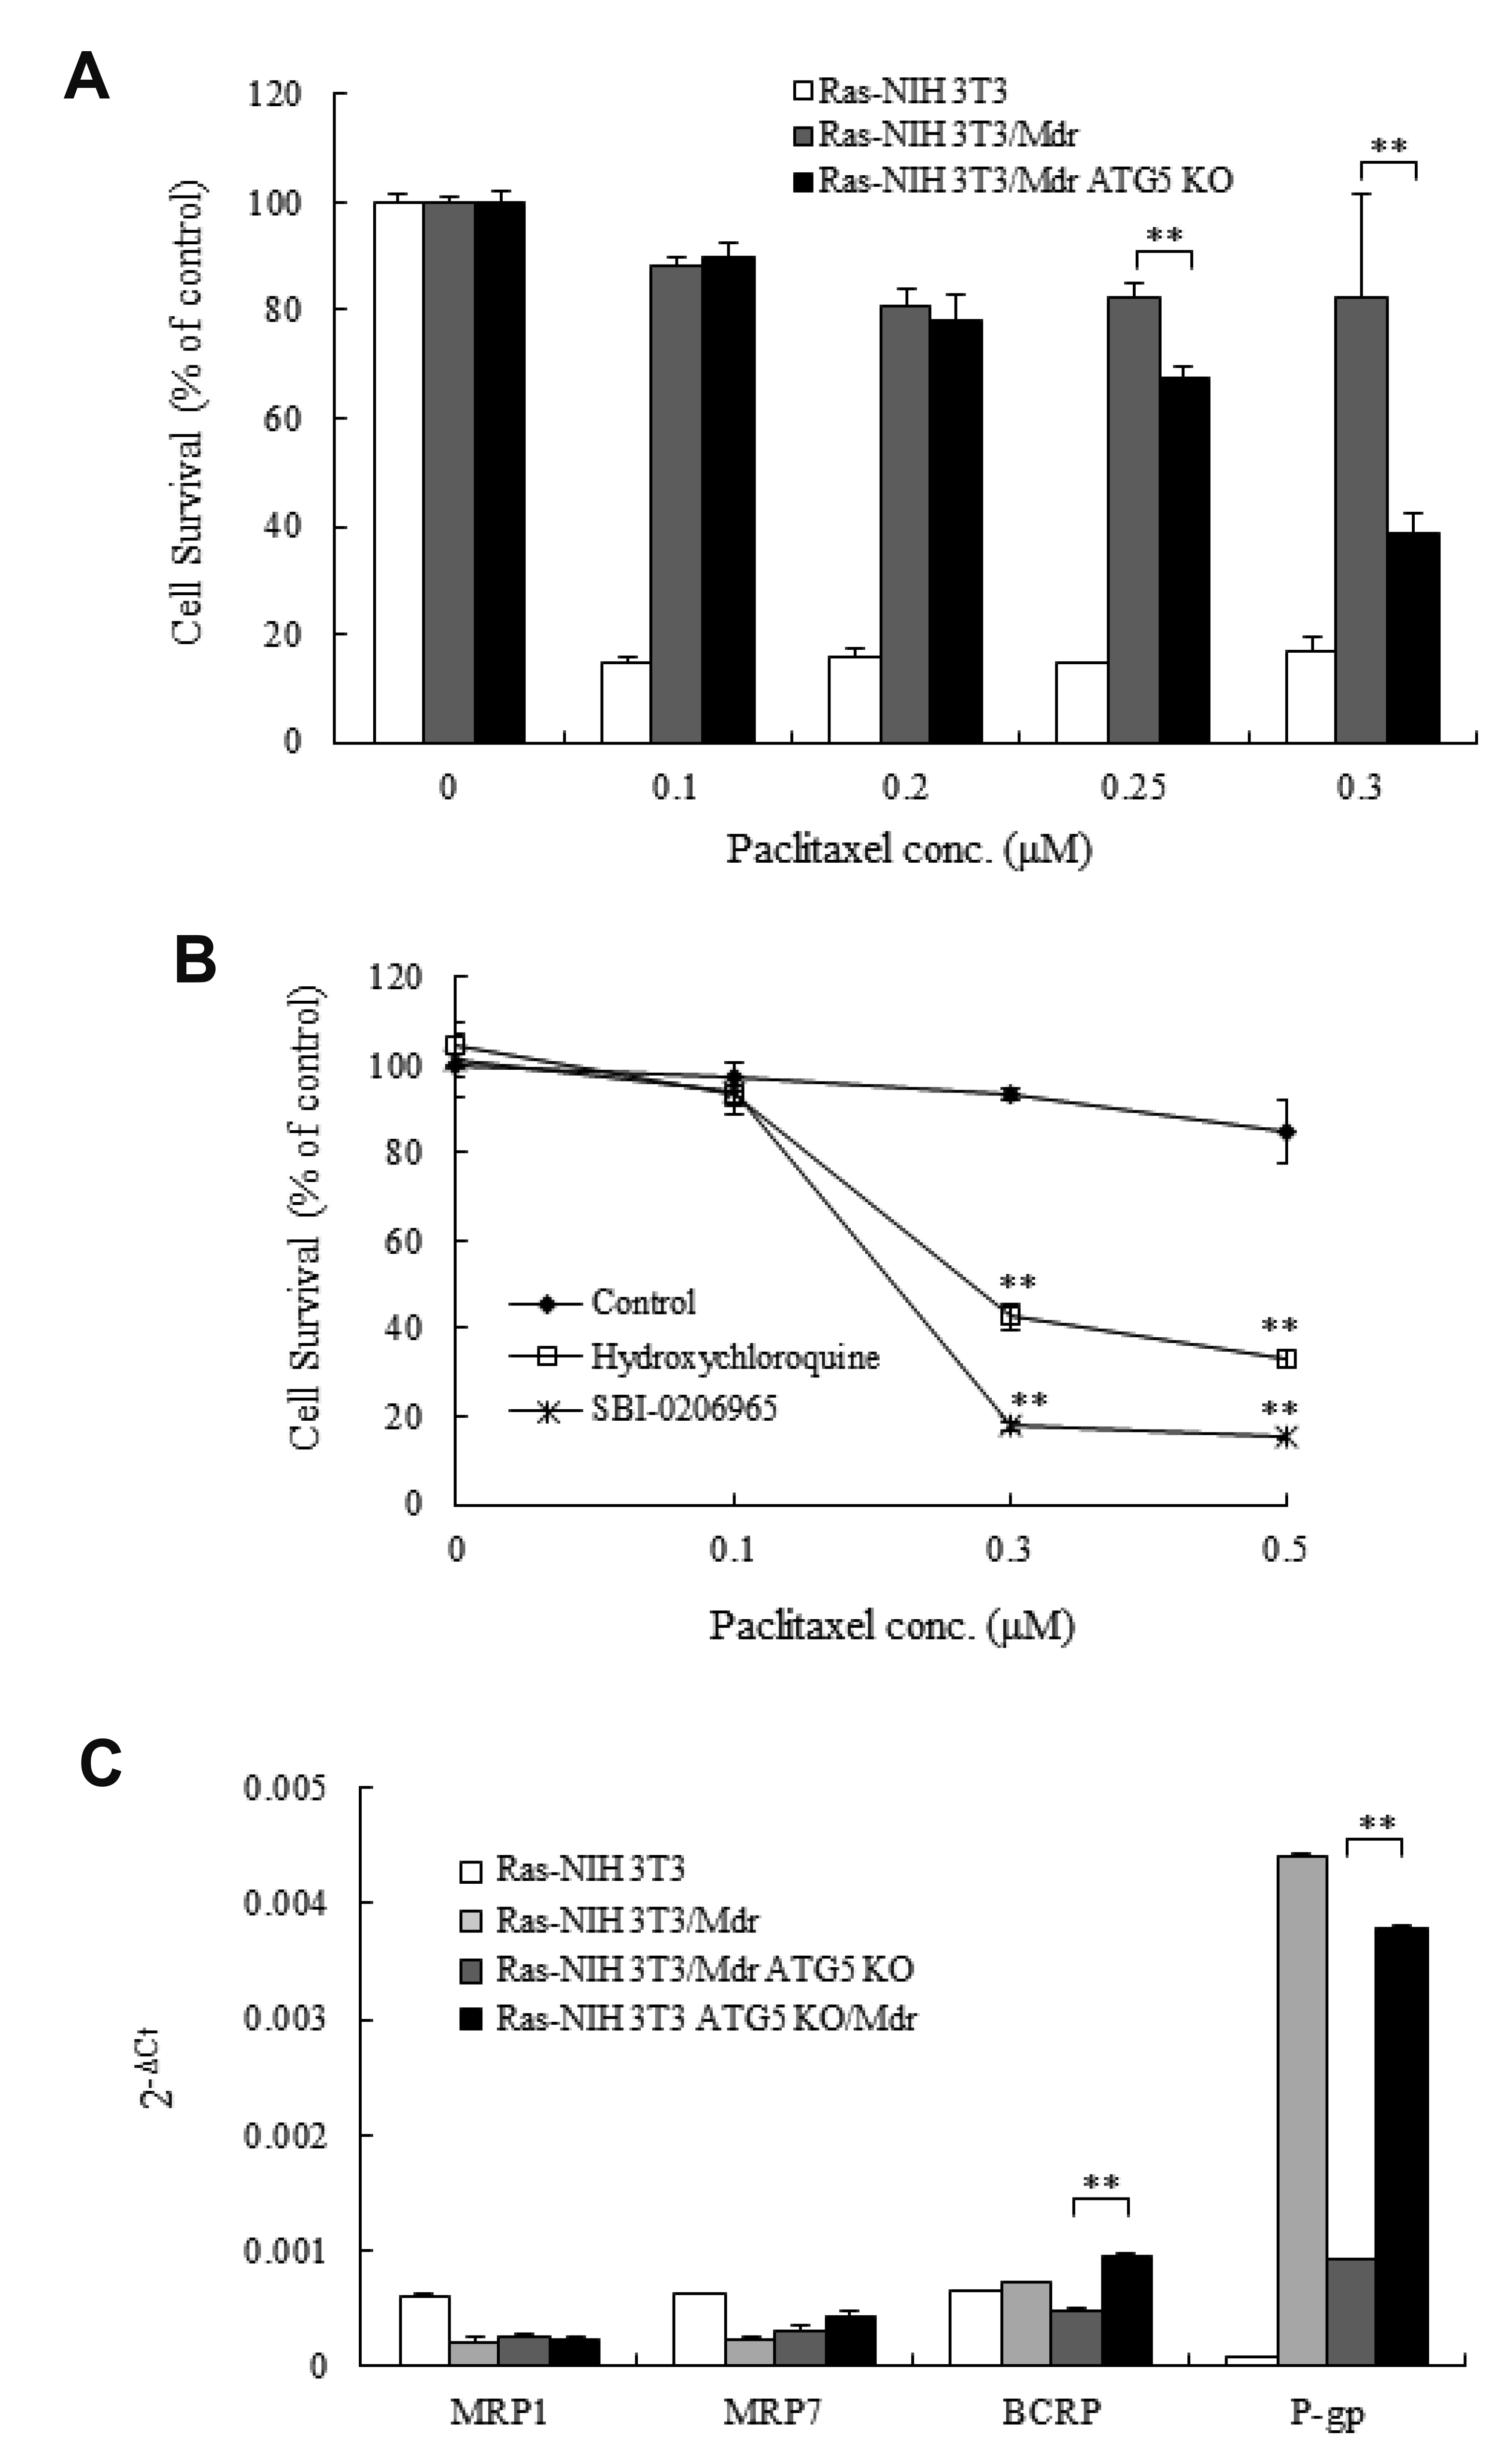
 | Fig. 2Effects of an ATG5 knockout (KO) mutation on multidrug resistance.(A) Ras-NIH 3T3, Ras-NIH 3T3/Mdr and Ras-NIH 3T3/Mdr ATG5 KO cells were treated with increasing concentrations of paclitaxel ranging from 0.1 to 0.3 μM for 3 days. The cytotoxicity was evaluated using the WST-1 assay. The viability of cells treated with vehicle alone was set to 100%. Each point represents mean ± SD of quadruplicate determinations of one (of three) representative experiment. **p < 0.01 as compared with Ras-NIH 3T3/Mdr cells, as determined by Dunnett’s t-test. (B) Ras-NIH 3T3/Mdr cells were incubated in the presence and absence of SBI-0206965 (early autophagy inhibitor, 2 μM) or hydroxychloroquine (late autophagy inhibitor, 15 μM) for 3 days. The cell viability was then evaluated with the WST-1 reagent. The values represent mean ± SD of quadruplicates from one of three representative experiments. **p < 0.01 compared with control cells, as determined by Unpaired t-test. (C) Real-time RT-PCR was performed to measure the mRNA expression levels of four ABC transporters from Ras-NIH 3T3/Mdr ATG5 KO cells. The comparative threshold cycle (Ct) method was used to present relative gene expression. The expression of the target genes was normalized to β-actin expression. Each point represents mean ± SD of quadruplicate determinations of one (of three) representative experiment. MRP, multidrug resistance (MDR) protein; BCRP, breast cancer resistant protein; P-gp, P-glycoprotein. **p < 0.01 as determined by the Dunnett’s t-test compared to Ras-NIH 3T3/Mdr cells.
|
ATG5 overexpression fails to restore paclitaxel resistance in ATG5 KO cells
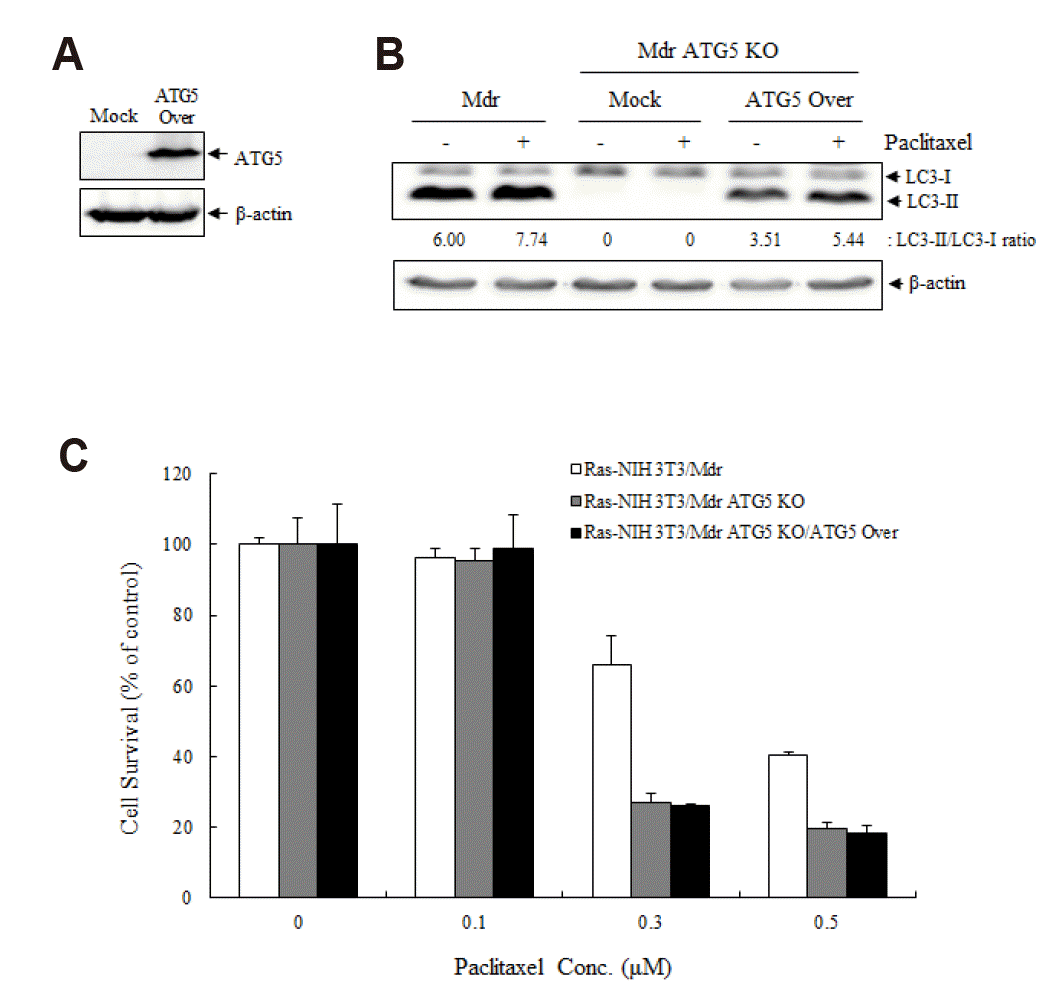
 | Fig. 3The effect of ATG5 overexpression on the resistance to paclitaxel in ATG5 knockout (KO) cells.In (A–C), cells were transiently transfected either with the mock control vector or with pCI-neo-mAtg5 for 24 h. (A) Overexpression of ATG5 was confirmed by immunoblotting. (B) The conversion of LC3-I to LC3-II was identified by immunoblotting. β-Actin expression was used as a protein loading control. Results presented here are representative of at least three independent experiments. (C) The cytotoxicity was evaluated using the WST-1 assay. Each point represents mean ± SD of quadruplicate determinations of one (of three) representative experiment.
|
ATG5 KO promotes necrosis following G2/M arrest in response to paclitaxel
 | Fig. 4Necrosis-inducing effects of paclitaxel on ATG5 knockout (KO) cells.(A) The ATG5 KO and their parental multidrug resistance (MDR) cells were treated with paclitaxel for 48 h. Cell cycle analysis was assesses using flow cytometry of propidium iodide-stained cells. Cell number and DNA fluorescence intensity are plotted on the vertical and horizontal axes, respectively. The G0/G1, S and G2/M populations were quantified using the CellQuest Pro software. Results presented here are representative of at least three independent experiments. (B) Cells were treated with paclitaxel (0.5 μM) for 48 h, stained with annexin V/propidium iodide (PI) and subjected to the flow cytometry analysis. The flow cytometry profile shows the Annexin V-FITC staining and the PI staining on the horizontal and vertical axes, respectively. The numbers shown indicate the percentage of cells in each quadrant. A group treated with camptothecin (5 μM) was used as a positive control. Results presented here are representative of at least three independent experiments. VH, vehicle; CTL, control.
|


 PDF
PDF Citation
 Print
Print


 XML Download