

 PDF
PDF Citation
 Print
Print


INTRODUCTION
Anti-neutrophil cytoplasmic antibody (ANCA)-associated vasculitis (AAV) is a rare autoimmune disease (AID) involving the small vessels and mainly affecting older patients [1]. Three distinct groups of diseases―microscopic polyangiitis (MPA), granulomatosis with polyangiitis (GPA), and eosinophilic polyangiitis (EGPA)―comprise AAV, which is typically associated with necrotising intravascular inflammation [2,3]. In AAV, multiple aetiologies, including environmental factors, genetics, and infection, are proposed to contribute to the pathogenesis; however, growing evidence indicates that immune dysregulation is crucial in provoking and perpetuating the inflammatory response [4]. Interestingly, it has been identified that the trigger of innate and adaptive immunity could cause a shift in metabolic activity [5]. Meanwhile, even though remarkable advances have recently been made in the understanding of AAV, the clinical and laboratory aspects associated with inflammation remain to be better investigated.
Compelling evidence now indicates that patients with AIDs show altered lipid metabolism, which could differ based on the underlying disease [6]. In rheumatoid arthritis (RA), it is described that patients with active disease exhibit a “lipid paradox”, in which reduced total, high-density lipoprotein (HDL), and low-density lipoprotein (LDL) cholesterol are present in proportion to the degree of inflammation [7]. Similarly, it has been shown that patients with systemic lupus erythematosus (SLE) present with decreased total and HDL cholesterol, whereas triglyceride, total, and LDL cholesterol levels are elevated at the time of diagnosis [8]. Of note, it was demonstrated that low HDL cholesterol was associated with higher disease activity in SLE, whereas alterations of triglyceride levels indicated changes in disease activity, emphasising that lipid profiles could be affected by inflammation, and could be markers of disease severity in AIDs. However, owing to the rarity of the disease, the lipid profiles in patients with AAV and their relationship with disease activity has not yet been well determined. Therefore, the objective of this study was to investigate whether changes of lipid profiles correlate with disease severity in AAV.
MATERIALS AND METHODS
Patient selection
We included 67 AAV patients who were registered in the Severance Hospital ANCA-associated VasculitidEs (SHAVE) cohort. Patients diagnosed with AAV as defined by the 2007 European Medicine Agency algorithms for AAV and polyarteritis nodosa, as well as the 2012 International Chapel Hill Consensus Conference Nomenclature of Vasculitides at the Division of Rheumatology in Severance Hospital, are enrolled in the SHAVE cohort [9,10]. All of the included patients were not using cholesterol-lowering drugs and had their serum samples collected on fasting. In addition, patients with malignancies, chronic infections such as hepatitis B or C virus, or other autoimmune diseases that could mimic AAV were excluded. Patients registered in the SHAVE cohort are subject to routine assessment of clinical and laboratory data at an interval of three to six months, undergo simultaneous blood sampling, and have their sera isolated and stored. Written informed consent was obtained from the patients prior to blood sampling, and the Institutional Review Board of Severance Hospital (4-2016-0901) approved this study.
Clinical and laboratory data collection and lipid profile assessment
Clinical data collected at the date of blood sampling were as follows; AAV subtypes, demographic data of age, sex, new-onset disease (disease duration less than one month), the Birmingham Vasculitis Activity Score (BVAS) version 3, and presence of comorbid hypertension, diabetes mellitus, or dyslipidemia [11,12]. Both incident and prevalent cases of AAV were enrolled. In addition, the following data were gathered from patient’s electronic medical records: 1) information on clinical manifestations and the respective clinical scores based on BVAS, and 2) current prescription of immunosuppressive agents to treat AAV. Laboratory data consisted of ANCA serostatus, white blood cell and platelet counts, along with creatinine, erythrocyte sedimentation rate (ESR), C-reactive protein (CRP), complement (C)3, and C4 levels.
The frozen serum samples obtained from patients were thawed and analysed for seven different lipid profile tests, namely total cholesterol, triglyceride, HDL and LDL cholesterol, and lipoprotein (a), and apolipoproteins A1 and B. The determination of total cholesterol, triglyceride, HDL, and LDL cholesterol level was done by using the Hitachi 7600 automated chemistry analyser (Hitachi Co., Tokyo, Japan), while lipoprotein (a), and apolipoproteins A1 and B levels were estimated using the Cobas c702 chemistry autoanalyser (Hitachi Co.).
Statistical analyses
Statistical analyses were performed using MedCalc version 19.3.1 (MedCalc Software bvba, Ostend, Belgium). Continuous and categorical variables were represented as mean±standard deviation and number (%). Patients were divided into the high disease activity group (BVAS ≥12) and the low disease activity group (BVAS <12), as described in our previous study [13]. Differences between continuous variables were compared by Student’s t-test for two groups and by analysis of variance for three groups. Correlation coefficient and 95% confidence intervals (CI) between continuous variables were estimated using Pearson’s correlation analysis. In all statistical analyses, a two-tailed p-value <0.05 was considered significant.
RESULTS
Clinical and laboratory characteristics of patients
The patients’ clinical and laboratory characteristics are shown in Table 1. Thirty-five (52.2%), 19 (28.4%), and 13 (19.4%) patients were diagnosed with MPA, GPA, and EGPA, respectively. The mean age of patients was 60.0 years, and 22 (32.8%) of the patients were male. When the patients were divided into high disease and low disease activity group, patients with high disease activity had greater proportion of those with new-onset disease (80.0% vs. 31.0%, p<0.001) and the BVAS was higher compared to those with low disease activity. Regarding ANCA serostatus and laboratory results, ANCA negativity was found more frequently in those with low disease activity, and the mean levels of white blood cells, creatinine, ESR, and CRP were significantly higher in the high disease activity group, whereas the C3 level was lower in the low disease activity group. Moreover, when the lipid profiles were compared between the two groups, patients with high disease activity had significantly lower levels of total, HDL and LDL cholesterol, and apolipoproteins A1 and B. Patients with high disease activity more often presented with general and renal manifestation than did with low disease activity, but no differences in the administration of immunosuppressive agents were found between the groups (Table 2).
Table 1
Baseline characteristics of patients with AAV
| Variables | Total (n=67) | High disease activity (n=25) | Low disease activity (n=42) | p-value |
|---|---|---|---|---|
| AAV subtypes | 0.452 | |||
| MPA | 35 (52.2) | 15 (60.0) | 20 (47.6) | |
| GPA | 19 (28.4) | 7 (28.0) | 12 (28.6) | |
| EGPA | 13 (19.4) | 3 (12.0) | 10 (23.8) | |
| Demographic data | ||||
| Age (yr) | 60.0±14.3 | 59.5±16.8 | 60.2±12.9 | 0.850 |
| Male sex | 22 (32.8) | 10 (40.0) | 12 (28.6) | 0.339 |
| Body mass index (kg/m2) | 21.9 ±3.4 | 21.3±3.1 | 22.2±3.6 | 0.300 |
| New-onset disease* | 33 (49.3) | 20 (80.0) | 13 (31.0) | <0.001 |
| Disease duration (mo) | 17.2±31.0 | 5.6±21.3 | 24.1±33.9 | 0.008 |
| BVAS | 9.8±6.8 | 17.5±3.9 | 5.2±2.8 | <0.001 |
| ANCA serostatus | ||||
| MPO-ANCA (or P-ANCA) positivity | 39 (58.2) | 18 (72.0) | 21 (50.0) | 0.080 |
| PR3-ANCA (or C-ANCA) positivity | 6 (9.0) | 3 (12.0) | 3 (7.1) | 0.664 |
| ANCA negativity | 22 (32.8) | 4 (16.0) | 18 (42.9) | 0.032 |
| Comorbidities | ||||
| Hypertension | 13 (19.4) | 6 (24.0) | 7 (16.7) | 0.466 |
| Diabetes mellitus | 12 (17.9) | 6 (24.0) | 6 (14.3) | 0.320 |
| Dyslipidemia | 27 (40.3) | 13 (52.0) | 14 (33.3) | 0.135 |
| Laboratory results | ||||
| White blood cell count (/mm3) | 8.9±4.4 | 10.4±5.5 | 8.0±3.4 | 0.033 |
| Platelet count (×1,000/mm3) | 308.5±145.9 | 349.7±199.0 | 284.1±97.1 | 0.075 |
| Creatinine (mg/dL) | 1.9±1.9 | 2.9±2.2 | 1.3±1.3 | <0.001 |
| ESR (mm/h) | 46.2±33.6 | 59.1±39.6 | 38.6±27.3 | 0.015 |
| CRP (mg/L) | 20.6±41.7 | 35.2±50.4 | 11.8±33.3 | 0.025 |
| C3 (mg/dL) | 112.0±25.0 | 103.9±26.7 | 116.9±23.0 | 0.039 |
| C4 (mg/dL) | 24.5±8.9 | 23.0±10.1 | 25.4±8.1 | 0.296 |
| Lipid profiles | ||||
| Total cholesterol (mg/dL) | 192.4±49.4 | 161.8±40.1 | 210.7±45.6 | <0.001 |
| Triglyceride (mg/dL) | 132.2±67.1 | 133.8±60.8 | 131.3±71.3 | 0.880 |
| HDL cholesterol (mg/dL) | 56.1±19.4 | 45.4±18.4 | 62.4±17.3 | <0.001 |
| LDL cholesterol (mg/dL) | 110.2±34.8 | 89.3±28.4 | 122.6±32.4 | <0.001 |
| Lipoprotein (a) (mg/dL) | 31.7±30.1 | 36.6±37.1 | 28.8±25.1 | 0.310 |
| Apolipoprotein A1 (mg/dL) | 150.3±37.6 | 126.4±34.6 | 164.5±32.0 | <0.001 |
| Apolipoprotein B (mg/dL) | 100.3±27.6 | 89.2±21.7 | 107.0±28.8 | 0.010 |
Values are presented as number (%) or mean±standard deviation. AAV: anti-neutrophil cytoplasmic antibody-associated vasculitis, MPA: microscopic polyangiitis, GPA: granulomatosis with polyangiitis, EGPA: eosinophilic granulomatosis with polyangiitis, BVAS: Birmingham Vasculitis Activity Score, ANCA: anti-neutrophil cytoplasmic antibody, MPO: myeloperoxidase, P: perinuclear, PR3: proteinase 3, C: cytoplasmic, ESR: erythrocyte sedimentation rate, CRP: C-reactive protein, C3: complement 3, C4: complement 4, HDL: high-density lipoprotein, LDL: low-density lipoprotein. *Patients who were diagnosed with AAV within one month were defined as having new-onset disease.
![]()
Table 2
Clinical manifestation and immunosuppressive agent usage in patients with high and low disease activity
| Variables | High disease activity (n=25) | Low disease activity (n=42) | p-value |
|---|---|---|---|
| Clinical manifestations | |||
| General | 14 (56.0) | 11 (26.2) | 0.015 |
| Cutaneous | 3 (12.0) | 3 (7.1) | 0.664 |
| Mucous membranes/eyes | 3 (12.0) | 2 (4.8) | 0.354 |
| Ear Nose Throat | 10 (40.0) | 17 (40.5) | 0.970 |
| Pulmonary | 19 (76.0) | 24 (57.1) | 0.122 |
| Cardiovascular | 3 (12.0) | 1 (2.4) | 0.143 |
| Gastrointestinal | 0 (0.0) | 0 (0.0) | NA |
| Renal | 21 (84.0) | 14 (33.3) | <0.001 |
| Nervous | 5 (20.0) | 11 (26.2) | 0.568 |
| Administration of immunosuppressive agent | |||
| Glucocorticoids | 15 (60.0) | 31 (73.8) | 0.242 |
| Glucocorticoid dosage (mg/d)* | 99.9±269.3 | 12.9±20.5 | 0.120 |
| Cyclophosphamide | 5 (20.0) | 11 (26.2) | 0.568 |
| Rituximab | 1 (4.0) | 0 (0.0) | 0.373 |
| Azathioprine | 2 (8.0) | 11 (26.2) | 0.109 |
| Methotrexate | 1 (4.0) | 0 (0.0) | 0.373 |
![]()
Relationship between BVAS, laboratory data, and lipid profiles
Laboratory data of ESR and CRP, and the lipid profiles were selected to evaluate association with BVAS. The values of total cholesterol, HDL and LDL cholesterol, apolipoproteins A1 and B, ESR, and CRP were significantly associated with BVAS (Figure 1). In contrast, in a subgroup analysis of patients with new-onset disease, only HDL cholesterol, lipoprotein(a), and apolipoprotein A1 were significantly associated with BVAS (Figure 2). In both analyses, apolipoprotein A1 was identified to have the highest absolute value of correlation coefficient with BVAS (r=−0.521, 95% CI −0.677 to −0.321, p<0.001 in total patients, r=−0.430, 95% CI −0.674 to −0.102, p=0.012 in patients with new-onset disease) (Figures 1 and 2).
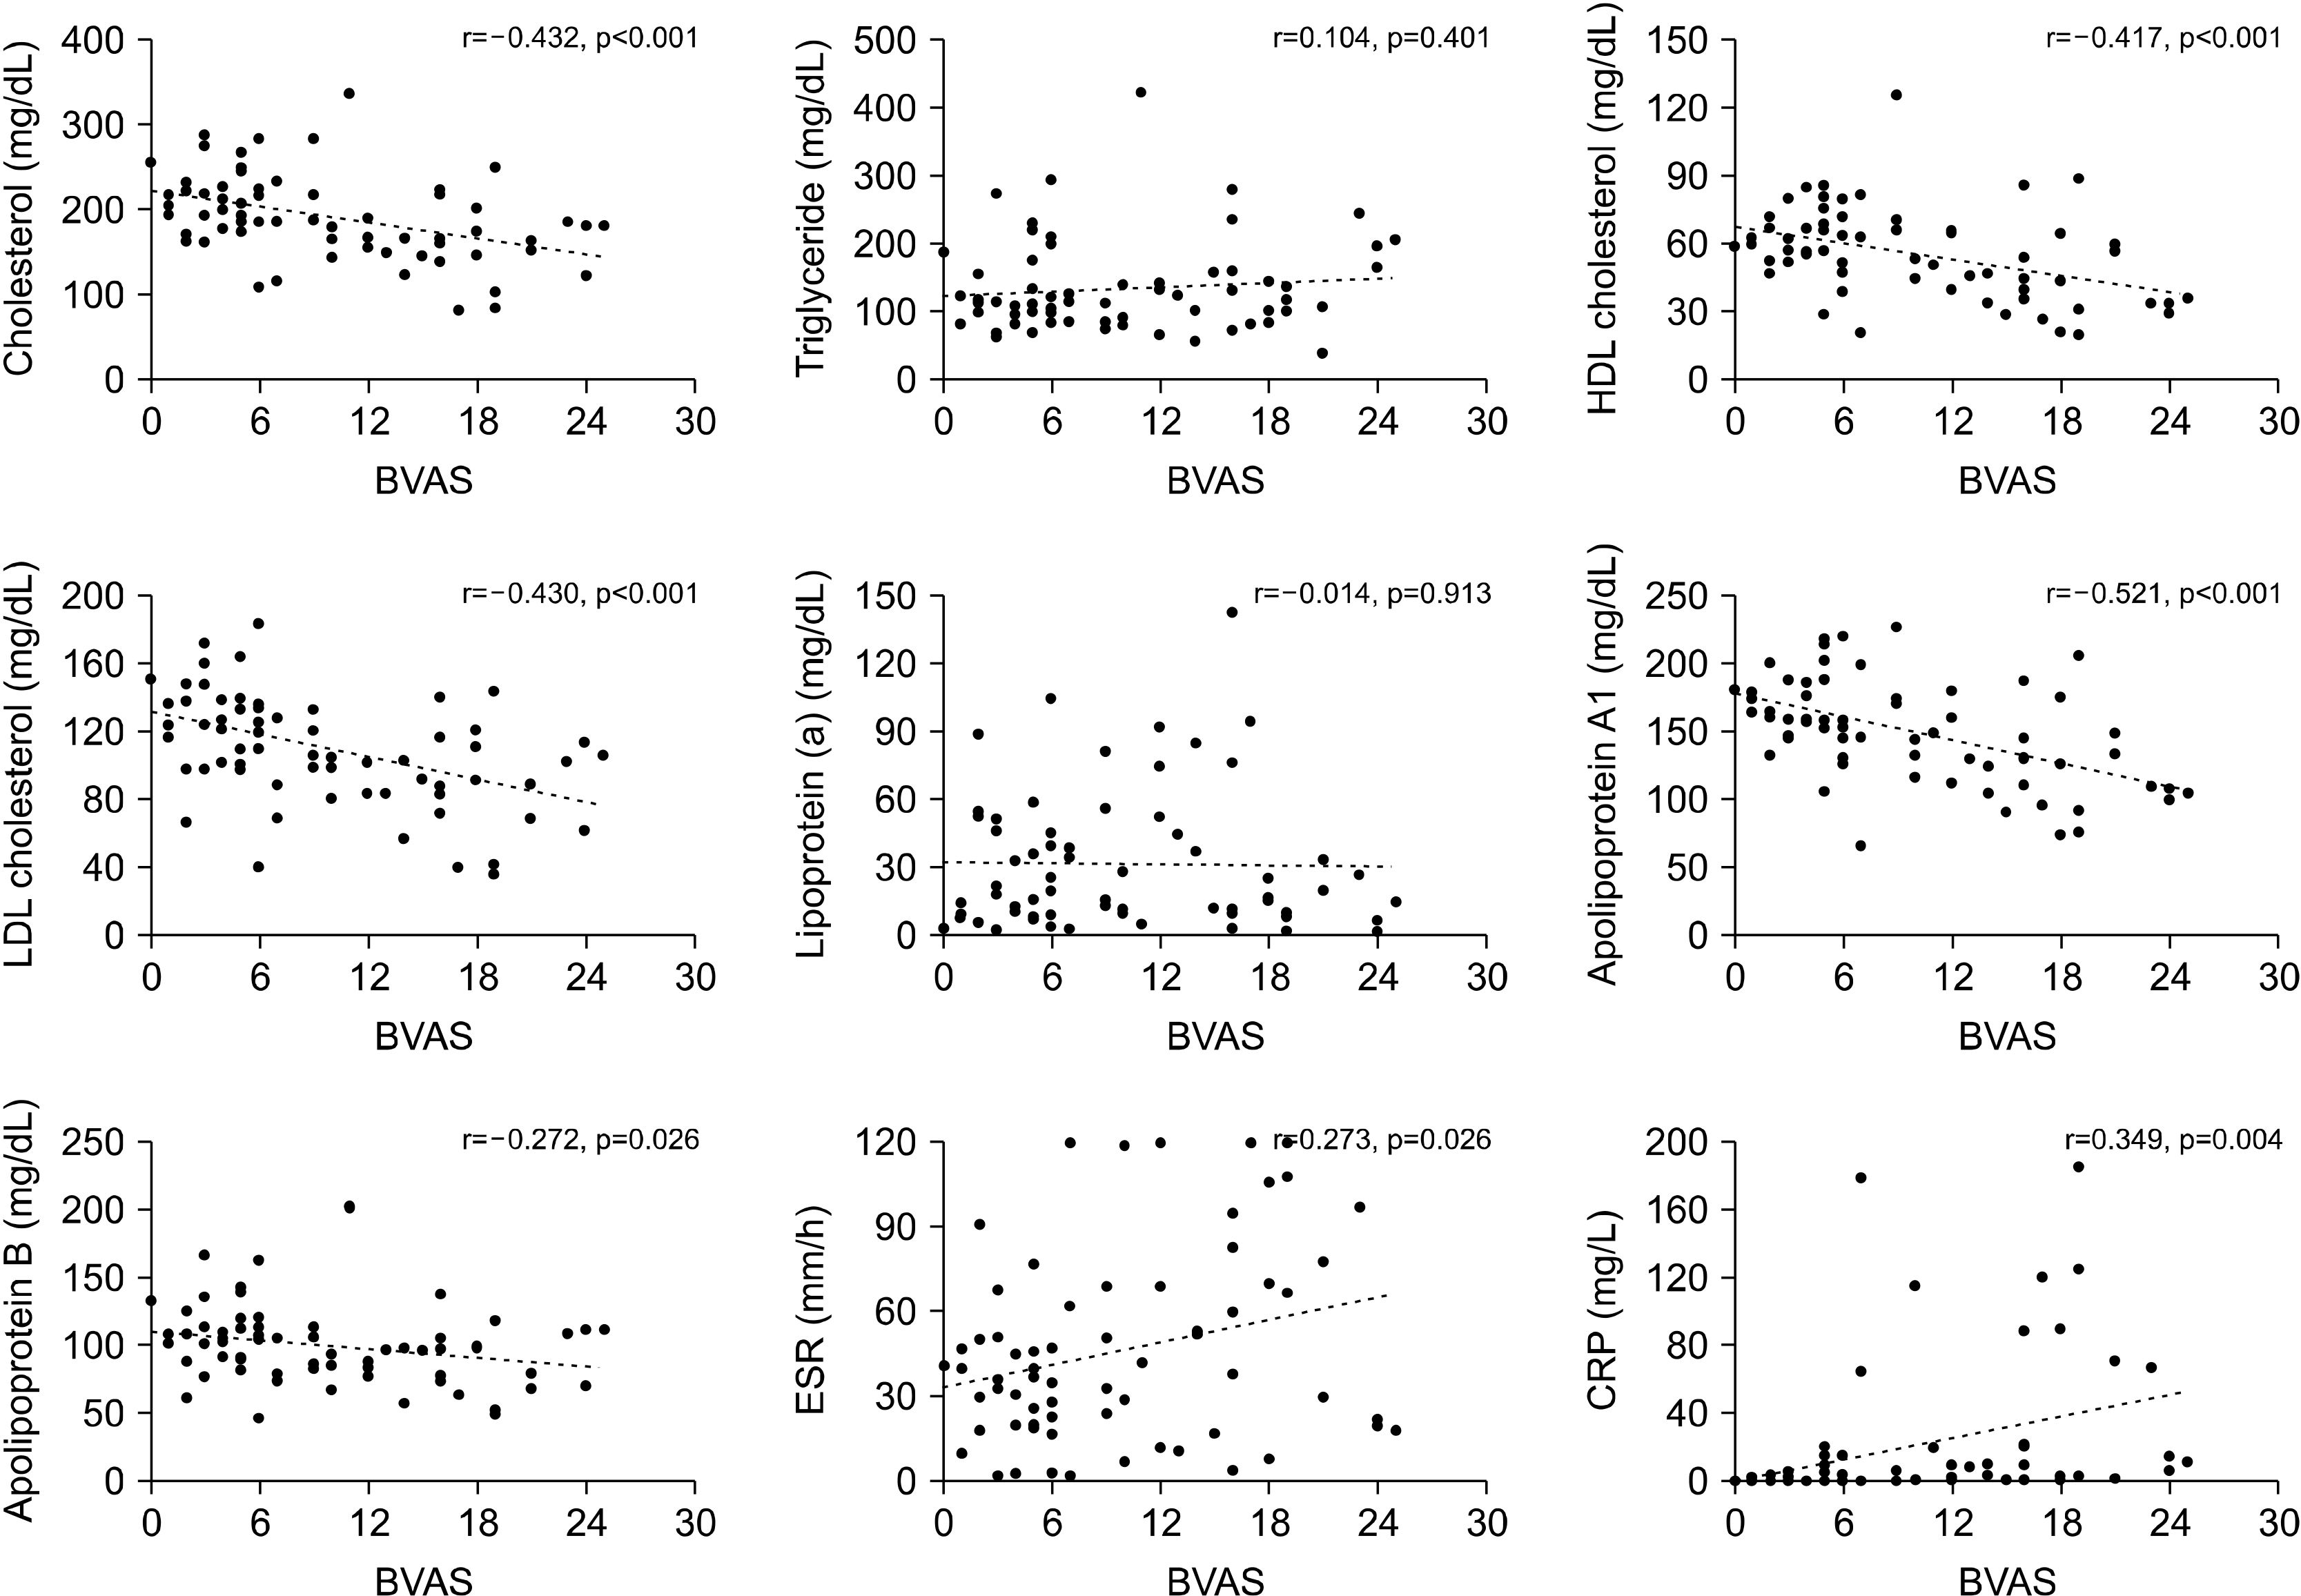
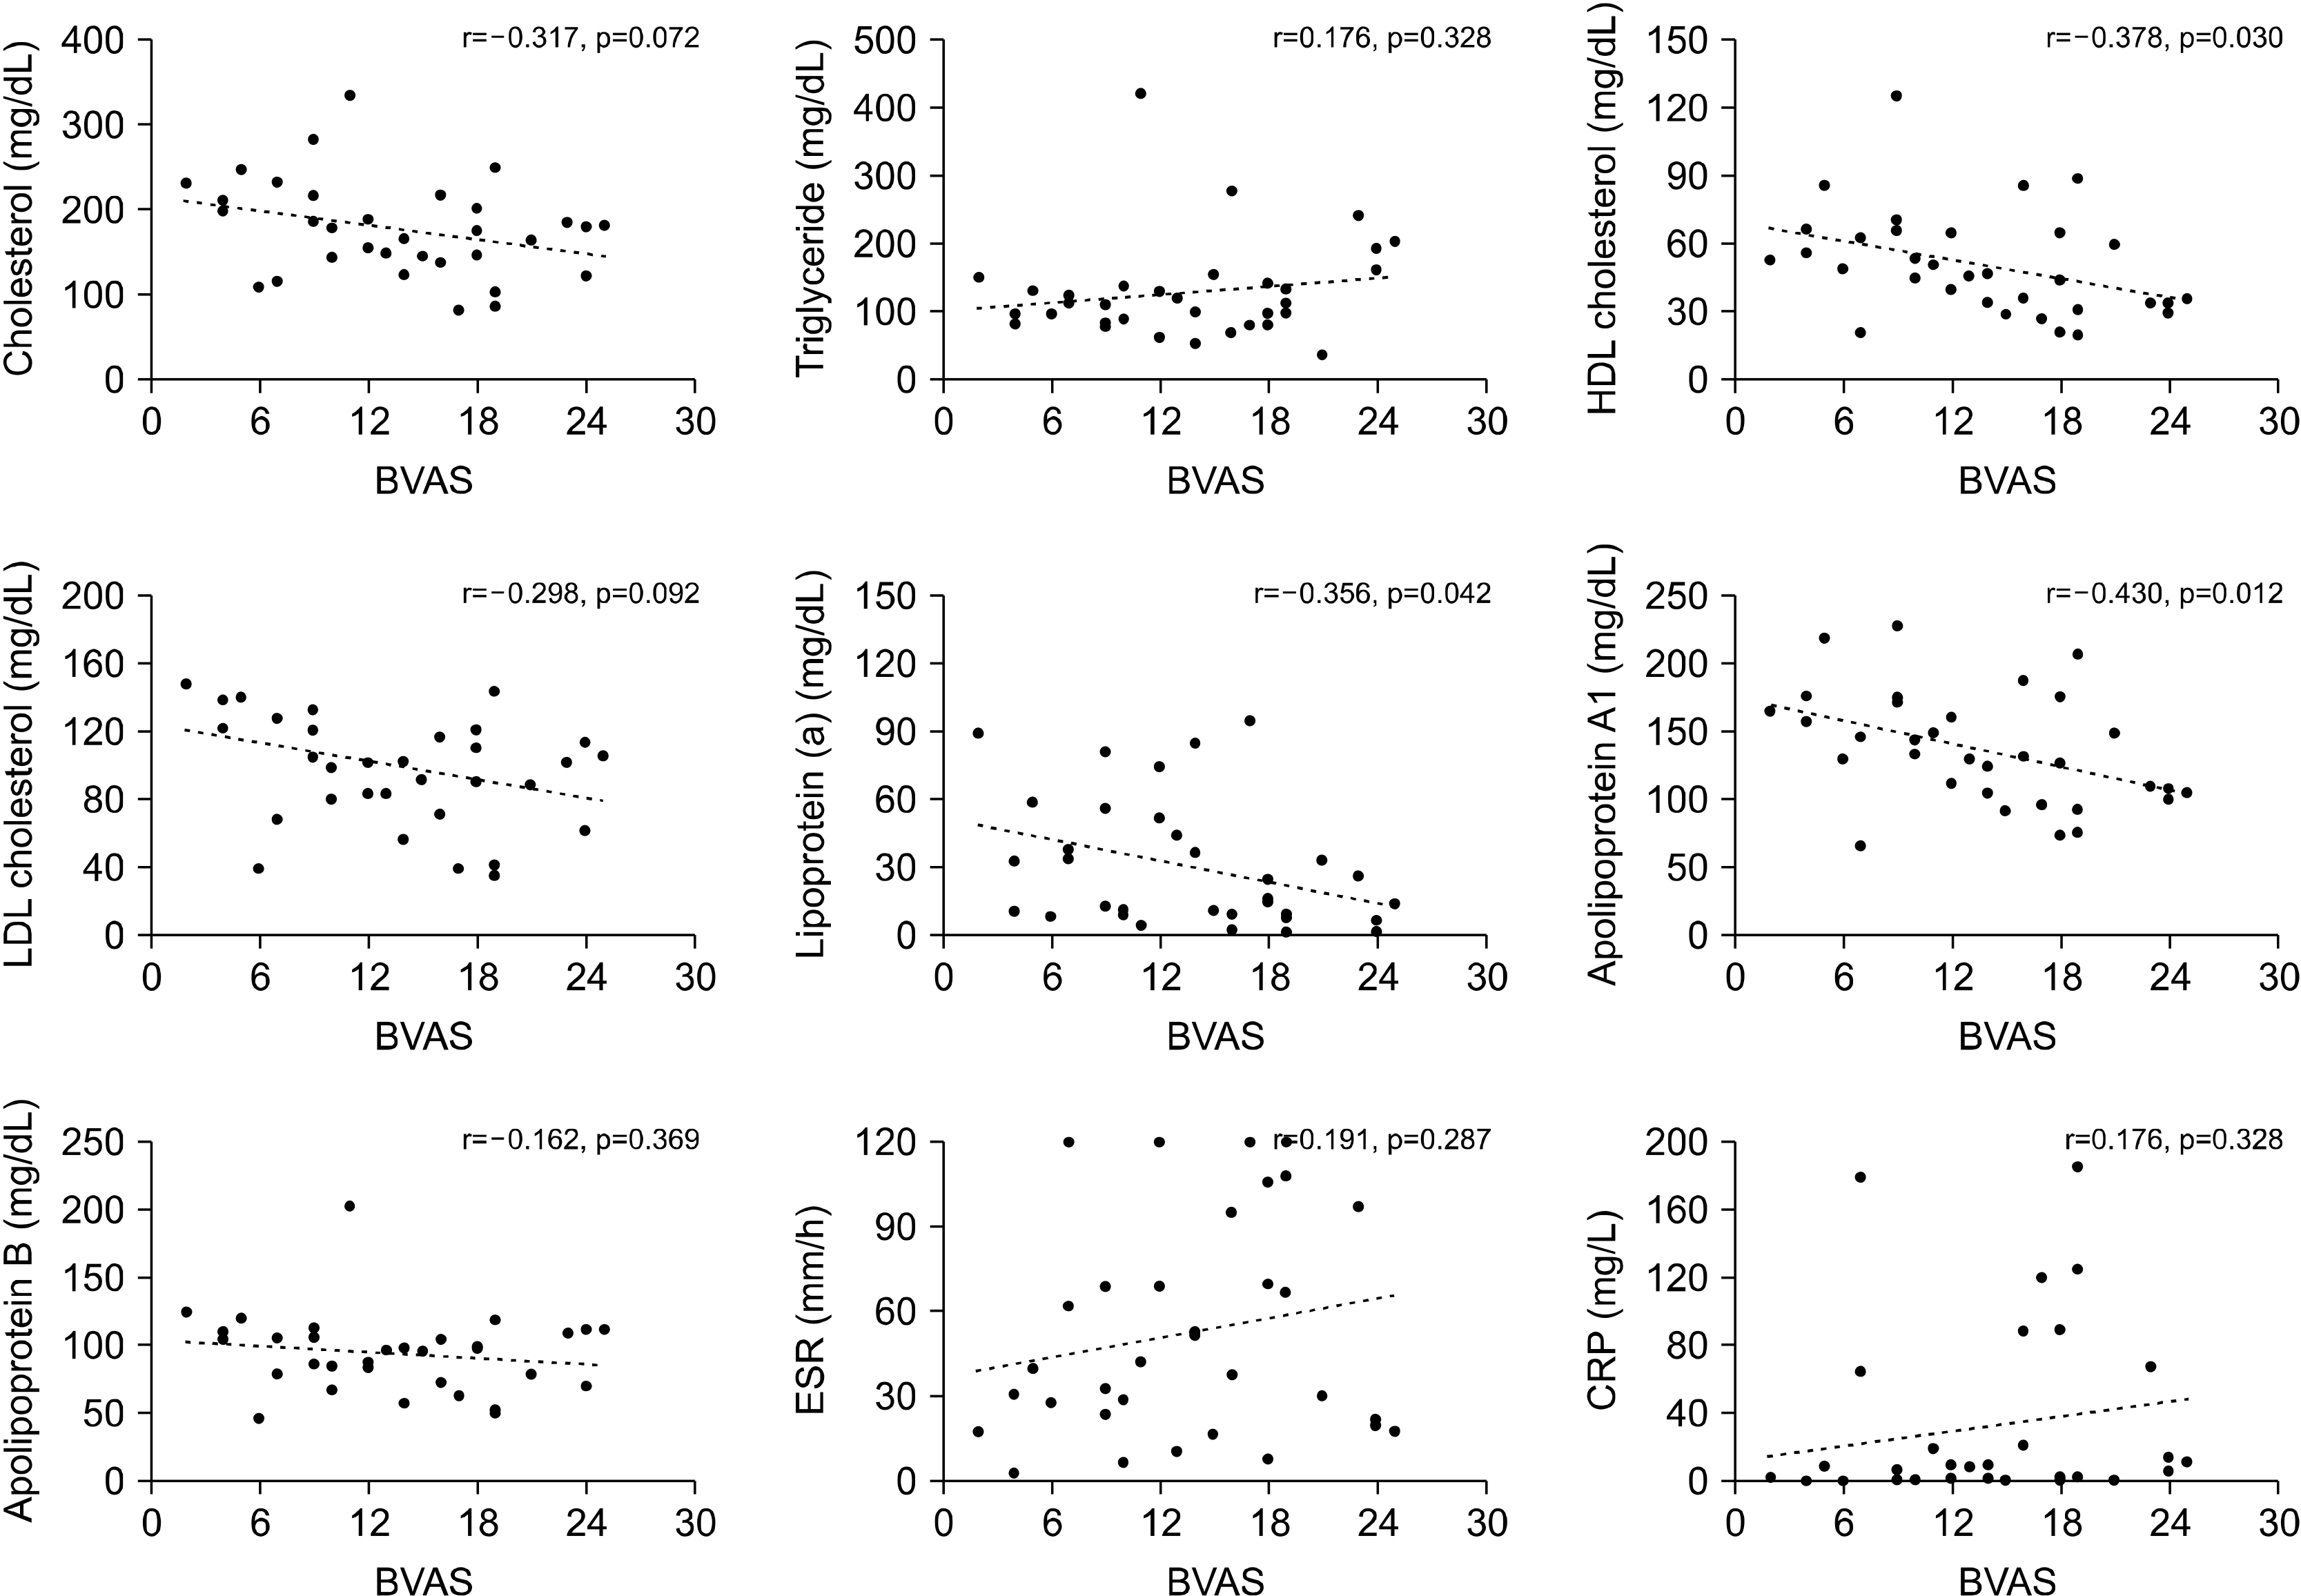
Figure 1
Association between laboratory data and BVAS in AAV. The correlation between BVAS and laboratory data were assessed in total patients (n=67). BVAS: Birmingham Vasculitis Activity Score, AAV: anti-neutrophil cytoplasmic antibody-associated vasculitis, HDL: high-density lipoprotein, LDL: low-density lipoprotein, ESR: erythrocyte sedimentation rate, CRP: C-reactive protein.
![]()
Figure 2
Association between laboratory data and BVAS in new-onset AAV. The correlation between BVAS and laboratory data were assessed in patients with new-onset disease (n=33). BVAS: Birmingham Vasculitis Activity Score, AAV: anti-neutrophil cytoplasmic antibody-associated vasculitis, HDL: high-density lipoprotein, LDL: low-density lipoprotein, ESR: erythrocyte sedimentation rate, CRP: C-reactive protein.
![]()
To further investigate the correlation between lipid profiles and the predisposition for organ-specific involvement, we assessed the association of lipid profiles and clinical scores comprising BVAS. The relationship between the general manifestation score was most closely associated with CRP, whereas the mucous membranes/eyes scores were only significantly associated with triglyceride and ESR levels. In addition, pulmonary scores were correlated with total cholesterol and apolipoprotein A1, while apolipoprotein A1 had the highest absolute correlation coefficient values with the renal manifestation score (r=−0.457, p<0.001) (Table 3).
Table 3
Association between lipid profiles, acute phase reactants, and clinical scores comprising BVAS
![]()
Lipid profiles according to clinical diagnosis and ANCA serostatus
We compared the lipid profiles of the patients according to the clinical diagnosis and ANCA serostatus. However, there were no significant differences in lipid profiles according to the clinical diagnoses of MPA, GPA, and EGPA (Supplementary Figure 1). Similarly, the level of lipid profiles investigated appeared comparable even when dividing the patients into myeloperoxidase (MPO)-ANCA, proteinase 3 (PR3)-ANCA, and ANCA-negative groups (Supplementary Figure 2).
DISCUSSION
Although research concerning lipid profiles and its clinical significance in patients with AAV is scarce, a recent publication by Wallace and colleagues [14] analysed lipid levels in patients’ sera from the Rituximab for ANCA-Associated Vasculitis (RAVE) trial. This study revealed that lipid levels of total and LDL cholesterol and of apolipoproteins A1 and B increase after treatment in patients with newly diagnosed AAV, implying that the decrease of lipid profiles is relevant to a higher inflammatory burden in AAV. These findings were reproduced in our study, as BVAS, which estimates patients’ assessment of global disease activity in AAV, was inversely correlated with total and LDL cholesterol and apolipoprotein A1 and B levels. This confirmed that escalated inflammation directly contributes to the decrease of lipids. However, in our study, the HDL cholesterol level was also associated with disease activity in AAV. Of special interest, we demonstrated that only HDL cholesterol and apolipoprotein A1 were significantly associated with BVAS, even in patients with new-onset disease. Moreover, the absolute value of the correlation coefficient between BVAS and apolipoprotein A1 was the highest among the lipid profiles and acute phase reactants, indicating that apolipoprotein A1 could be a surrogate marker of disease activity in AAV.
It is unclear why apolipoprotein A1 is most relevant to disease severity in AAV within the lipid profiles investigated. However, this could be partly attributed to the anti-inflammatory properties of HDL cholesterol, and due to apolipoprotein A1’s critical role in modulating the function of HDL cholesterol. HDL cholesterol is traditionally considered “good” cholesterol because it removes cholesterol from local tissues; it also transports excess cholesterol to the liver, in a process known as reverse cholesterol transport, thereby exerting protective effects in the development of atherosclerosis and cardiovascular diseases [15,16]. In contrast, HDL cholesterol has also been acknowledged to have anti-inflammatory characteristics, as it suppresses antigen presenting cells and T-cell activation [17,18]. In line with these findings, a previous study indicated that infusion of HDL cholesterol could alleviate arthritis in an experimental model of RA [19]. Meanwhile, apolipoprotein A1 is a major protein that constitutes nearly 70% of proteins in HDL, and facilitates the transfer of cholesterol to HDL from tissues, and the transport of HDL cholesterol within the circulation to the liver [20]. Given that apolipoprotein A1 is essential to the function of HDL cholesterol, the decrease of apolipoprotein A1 may be most significantly related to higher disease activity in AIDs, particularly AAV. Interestingly, a previous study has also shown that apolipoprotein A1 and HDL cholesterol levels decrease in the sera of patients with inflammatory arthritis compared to controls, which supports our hypothesis [21]. Moreover, it was demonstrated in the same study that apolipoprotein A1 is decreased in the blood and increased in the inflamed joints in RA, indicating that the decrease of apolipoprotein A1 in the circulation could be closely linked to the inflammatory process.
Similarly, when we analysed the association between lipid profiles, acute phase reactants, and the clinical scores comprising BVAS, it was demonstrated that apolipoprotein A1 was significantly correlated with general, pulmonary, and renal manifestation scores. Notably, apolipoprotein A1 had the highest correlation with the renal manifestation score among the laboratory variables included. In addition, even though CRP, a representative acute phase reactant used to assess the degree of inflammation, had a higher correlation with general manifestation scores than did apolipoprotein A1, apolipoprotein A1 better correlated with the renal manifestation scores than did CRP. Taken together, it is suggested that the differential expression of lipid profiles could be helpful in predicting organ involvement patterns in AAV.
While the three representative diseases of MPA, GPA, and EGPA are traditionally known to comprise a group of AAV, it is increasingly understood that a distinct feature could be present according to the ANCA serostatus and the diagnosis [22,23]. In addition, it was described that total and LDL cholesterol and apolipoprotein B levels are significantly elevated following treatment in PR3-ANCA-positive patients, but not in MPO-ANCA positive patients [14]. However, our observations revealed no differences in lipid profiles regarding diagnosis or ANCA serostatus. Although the difference in study design could have affected the discordant result, this discrepancy could be also accounted for by the fact that PR3-ANCA is detected more frequently than is MPO-ANCA in AAV patients in the Western world, and is associated with higher disease relapse [24-26]. In contrast, MPO-ANCA-positive AAV is more common than is PR3-ANCA positive AAV in Asia, and its presence is associated with higher disease activity in Korean patients [24,27]. Therefore, increased inflammatory burdens, rather than disease subtypes or ANCA types, may be an important factor influencing lipid profiles in patients with AAV.
Besides disease activity, medications treating dyslipidaemia, as well as glucocorticoids and immunosuppressive agents, could also affect patients’ lipid profiles [28,29]. Accordingly, in the study design, we only included patients with AAV not taking lipid-lowering agents, and the immunosuppressants that were being administered were also compared between patients with high and low disease activity. However, our findings indicate that the use of medications was comparable between the two groups, implying that immunosuppressant use did not significantly impact the lipid profiles of our study population.
Several inherent limitations are present in this study. First, the number of patients enrolled in this study was relatively small, which could have affected data inter-pretation. Furthermore, as we defined the patients into high disease activity and low disease activity group according to the BVAS cut-off of 12, this could have influenced in the study results. Second, as this study was a cross-sectional study, we were not able to evaluate the changes of lipid profiles according to the alterations of disease activity. In addition, due to the lack of a control group, a direct comparison of lipid profiles could not be made with that of the normal population. Third, data of lifestyle habits such as alcohol ingestion and smoking, which could impact in the lipid profiles, was not collected in this study. Fourth, the present study did not provide the mechanism leading to dysregulated lipid profiles. Hence, further exploration is necessary to understand the pathways that lead to aberrant lipid levels in AAV. Fifth, it is unclear whether the decrease in lipid profiles that were observed in this study is a general phenomenon in chronic inflammatory diseases or is a specific finding for AAV, and should be addressed through future studies.
CONCLUSION
In summary, we confirmed that lipid profiles are altered in patients with AAV; among the lipid profiles investigated, the decrease in apolipoprotein A1 level is most relevant to increased disease activity. Moreover, it was found that the expression of lipid profiles differed according to patterns of organ involvement. These results suggest that measuring lipid profiles could have clinical implications regarding the assessment of global disease activity and organ involvement in AAV.
SUPPLEMENTARY DATA
Supplementary data can be found with this article online at https://doi.org/10.4078/jrd.2020.27.4.261.
 XML Download