

 PDF
PDF Citation
 Print
Print


INTRODUCTION
Understanding the causal role of risk factors to diseases is important to uncover the pathogenesis of disease and plan treatment strategy. Concluding causality from observational data, however, is troublesome, as observational studies conducted to identify correlations between modifiable exposures and disease outcomes often include confounding factors or reverse causation, which lead to misunderstood and biased findings [1]. Consequently, in observational studies, a link between the modifiable risk factor or exposure and outcome cannot be causal. A randomized controlled trial (RCT) is widely recognized as the gold standard, which has the best possibility to establish a relationship between a risk factor and an outcome. Associations found in observational studies, in many cases, do not reveal any relationship in RCTs [2,3]. In addition, RCTs cannot be done often, because they can be costly, impractical, or even unethical [4].
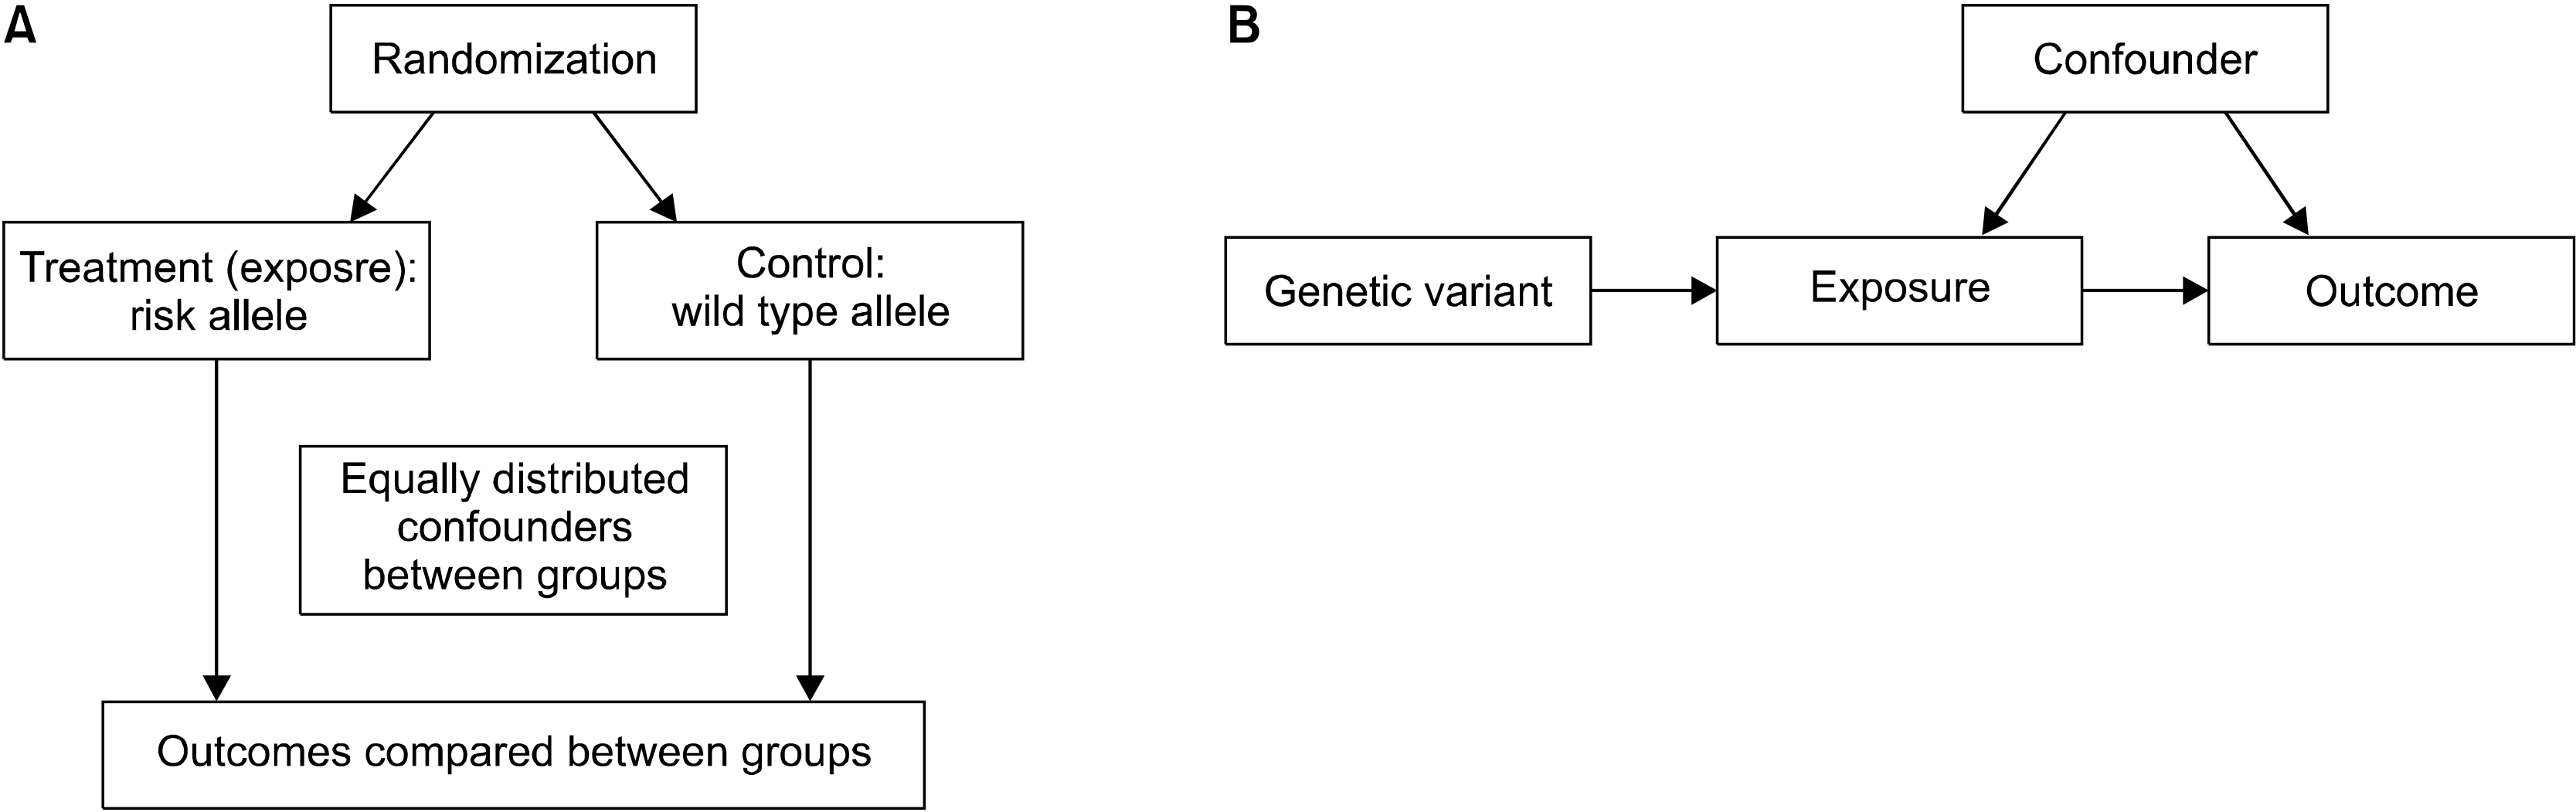
To deal with the confounders in observational studies and identify causal relationships, an alternative approach is needed. One of the alternative approaches is to perform Mendelian randomization (MR) experiments that are based on Mendel’s independent assortment rule: each trait is inherited to the next generation independently of other traits. In MR, the random segregation of alleles (genes) separates them independently into exposed and controlled groups, which results in unmeasured confounding factors that are also distributed equally between two groups [5]. Thus, the MR experiment resembles a RCT [6] (Figure 1). The MR approach uses genetic variants linked to modifiable traits/exposures to identify causal associations with disease. The increasing size and scope of genome-wide association studies (GWASs) to identify risk factors (exposures) and diseases (outcomes) has led to increased use of MR studies. However, MR studies depend on three assumptions, and it is important to assess the plausibility of such assumptions to validate the results from MR studies.
Go to : 
MAIN SUBJECTS
Assumptions for MR
MR uses a genetic variant as a proxy for a risk factor, and therefore, choosing a genetic instrument variable (IV) is important for a successful MR study. The IV assumptions for a genetic variant are crucial to the validity of MR. To validate a genetic variant as a valid IV for causal inference in an MR test, three key assumptions must be met [7] (Figure 2): (1) the genetic variant is directly associated with the exposure; (2) the genetic variant is not related to factors known to obscure the connection between the exposure and the effect; and (3) the genetic variant has no effect other than through the exposure.
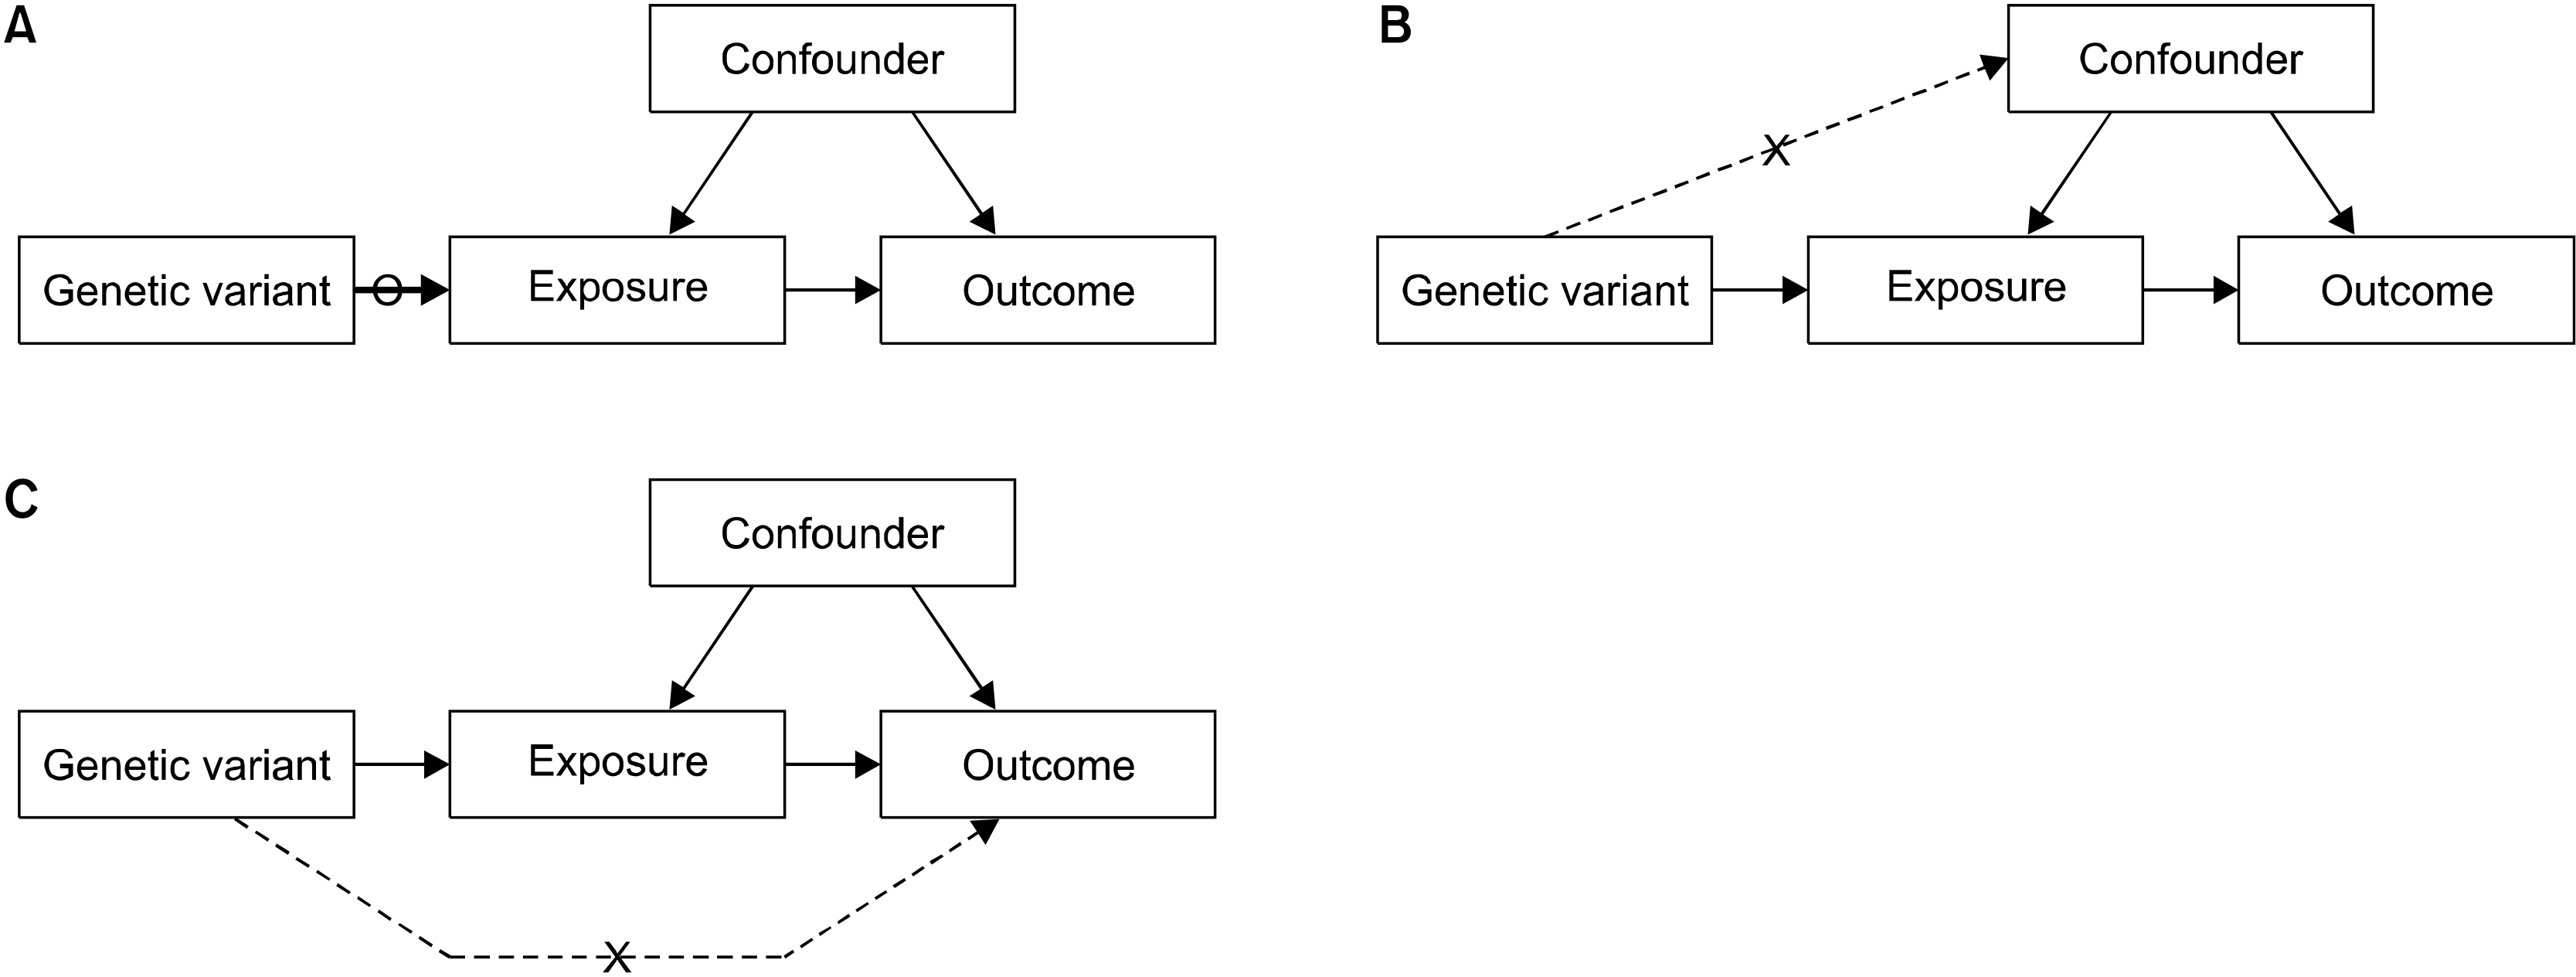 | Figure 2Three core assumptions for Mendelian randomization. (A) Instrumental variable (IV) assumption 1: The genetic variant should be associated with the exposure. (B) IV assumption 2: The genetic variant should not associate with confounder. (C) IV assumption 3: The genetic variant should influence the outcome only through the exposure.
|
IV assumption 1: The genetic variant must be related to the exposure. Typically, genome-wide-significant single nucleotide polymorphisms (SNPs) (p<5×10⁻⁸) are used as instruments in MR studies. Moreover, combining the results of many SNPs is used as an instrument in MR studies, because the use of poor instruments based on a single SNPs will skew MR estimates [6].
IV assumption 2: The genetic variant is not to be correlated with exposure–outcome relationship confounders. Although it is theoretically impossible to prove that this hypothesis is present in an MR test, the correlation between the variant and known confounding factors of the exposure–outcome relation could be disproved [6].
IV assumption 3: The genetic variant affects the outcome only through the risk factor. This is commonly called the “no pleiotropy” rule. If a SNP is correlated with several traits, irrespective of the exposure of interest, the third IV assumption may be infringed. While it is not possible to prove that this assumption is considered in an MR study, different extensions of the MR design such as MR-Egger or a weighted median test can be used to detect the presence of pleiotropy and/or estimate the causal effect of exposure, even in the presence of assumption 2 and/or 3 violations [6].
Method of MR
MR can estimate causal effects where exposure and outcome data from different samples exist. Two-sample MR uses two different study samples for the risk factor and the outcome to estimate the causal effects of the risk factor on the outcome [8]. It is helpful when it is difficult to measure both the risk factor and outcome at the same time, as two-sample MR offers the chance to incorporate data from different sources [8]. When the genotype-exposure and genotype-outcome data comes from different sources, meta-analysis can estimate the combined effects by using two-sample MR to estimate the size of the exposure (risk factor)–outcome (disease) association [9]. Individually, single genetic variants usually explain only very little of the variation in a phenotype, which can lead to “weak instruments,” in particular in modest sample sizes [10]. To overcome this, multiple genetic variants are used that collectively explain more of the risk factor variation because they have a greater statistical power than a single variant [11].
1) Wald ratio estimator
The Wald ratio is the easiest way to calculate the causative effect of an exposure on an outcome when a single genetic variant is available. This can be seen as the change in the outcome of a unit change in exposure [9].
2) Inverse-variance weighting (IVW) method
When several genetic variants are correlated with a specific exposure, the Wald ratio approach can be generalized through a meta-analysis process. In particular, the causal effect estimates of each genetic variant are combined in an IVW meta-analysis framework. The IVW test, therefore, is a weighted average of the causal effects of genetic variants [11].
3) Accounting for deviations in MR assumptions
The effect of a genetic variant on several biological routes is demonstrated by pleiotropic effects that may affect the outcome through another pathway, known as horizontal pleiotropy. Horizontal pleiotropy contradicts the IV principles, because the effect of the genetic variant tested is not solely owing to the risk factor, which is troublesome for MR studies. Many methods have been established for defining and correcting breaches of assumptions, when some of the variants selected are invalid instruments.
4) The MR-Egger test
The MR-Egger method permits a pleiotropic effect of one or more genetic variants, as long as the size of such pleiotropic effects is independent of the size of the effect of the genetic variant on the risk factor [12]. In the MR-Egger method, a weighted linear regression of the gene–outcome coefficients is conducted for non-measured horizontal pleiotropy [12]. The slope of this regression constitutes the estimation of the causal effect and the intercept can be viewed as an estimate of the (horizontal) average pleiotropic effect of genetic variants [13]. The regression of MR-Egger replaces the second and third IV assumption with the Instrument Strength Independent on Direct Effect (InSIDE) assumption that the exposure effects of individual SNPs are independent of their pleiotropic effects on the outcome [13].
5) Weighted median estimator
If up to 50% of the genetic variants are invalid, then a causal effect may be estimated as the median of the weighted ratio estimates using the reciprocal of the variance of the ratio estimate as weights [14]. The InSIDE assumption is not needed and violations of the second and third IV assumptions are permitted [14]. In contrast to the MR-Egger process, the weighted median estimator has the benefit of preserving greater precision in the estimates.
Limitations of MR
1) Insufficient statistical power
Violations of the IV assumptions lead to MR limitations [15]. Owing to the limited availability of population-specific information on genetic associations, genetic instruments tend to show poor statistical power. Since genetic polymorphisms usually only explain a small fraction of the total variance in traits, it is not advisable to rely on a simple IV study alone for a causal inference [16]. Since a certain genetic variant typically explains only a small proportion of the risk factor variance, multiple variants are often combined to increase statistical strength. MR studies, therefore, need large sample sizes to ensure adequate statistical power.
2) Weak instrument bias
A genetic variant is considered a “weak instrument” if there is no adequate statistical evidence that the genetic variants are associated with the exposure. The strong relationship between the genetic variant and exposure is important [10].
3) Pleiotropy
A genetic variant or multiple genetic variants may associate with other exposures, a phenomenon known as “pleiotropy” [17]. The use of a genetic variant with pleiotropy will contribute to a misrepresentation of MR. The definition of MR is based on three principal assumptions. The MR analysis may be weakened by deviations in the assumptions underlying the IV. The first IV presumption can be directly assessed by checking whether the genetic variant is associated with the risk factor (exposure) [18]. However, the second and third IV assumptions cannot be proven empirically and require investigator judgment and the performance of several sensitivity analyses [18].
Other limitations of MR analysis include the lack of appropriate genetic variants, existence of linkage disequilibrium, genetic heterogeneity, population stratification, and developmental canalization or lack of an understanding of the confounding factors [6].
Example of an MR study: Causal relationship between years of education and rheumatoid arthritis (RA)
Previous studies have shown an association between a high level of education and a reduced risk of RA, but the results from observational studies were inconsistent [19-21]. The goal of this research was to investigate through MR analysis whether years of education are causally linked to the development of RA. The MR-Base database (http://www.mrbase.org/), which holds a large collection of summary data from many GWASs, was searched. Statistical datasets from the UK Biobank (n=293,723) GWASs for years of education were used as the exposure [22]. For the outcome dataset, a meta-analysis of GWASs of RA with autoantibody (n=5,539) and European controls (n=20,169) was used [23]. SNPs associated with years of education were selected, and it was checked whether each SNP was linked to the occurrence of RA. Finally, MR analysis combined these findings to assess the causal link between years of education and development of RA. Two-sample MR analysis was performed to estimate the causative effect of years of education on RA development using 49 SNPs as IVs [24]. IVW was conducted for MR analysis, and MR-Egger and weighted median tests that explore and modify pleiotropy were done as a sensitivity test [24]. The IVW method identified an inverse causative relationship between years of education and RA (β=−0.039, standard error [SE]=0.283, p= 0.008) (Table 1). The MR-Egger regression test showed that the MR results appeared not to be prejudicial to directional pleiotropy (intercept=0.028, p=0.358) and the MR-Egger study showed no causative relationship between RA and years of education (β=−2.320, SE= 1.709, p=0.181) (Table 1, Figure 3). However, the weighted median approach showed a significant causal relationship between RA and years of education (β=−0.950, SE=0.355, p=0.008) (Table 1, Figures 3 and 4). In conclusion, the MR technique showed a potential inverse causal relationship between years of education and development of RA. The current findings may provide an opportunity to identify the mechanisms contributing to the development of RA by years of education.
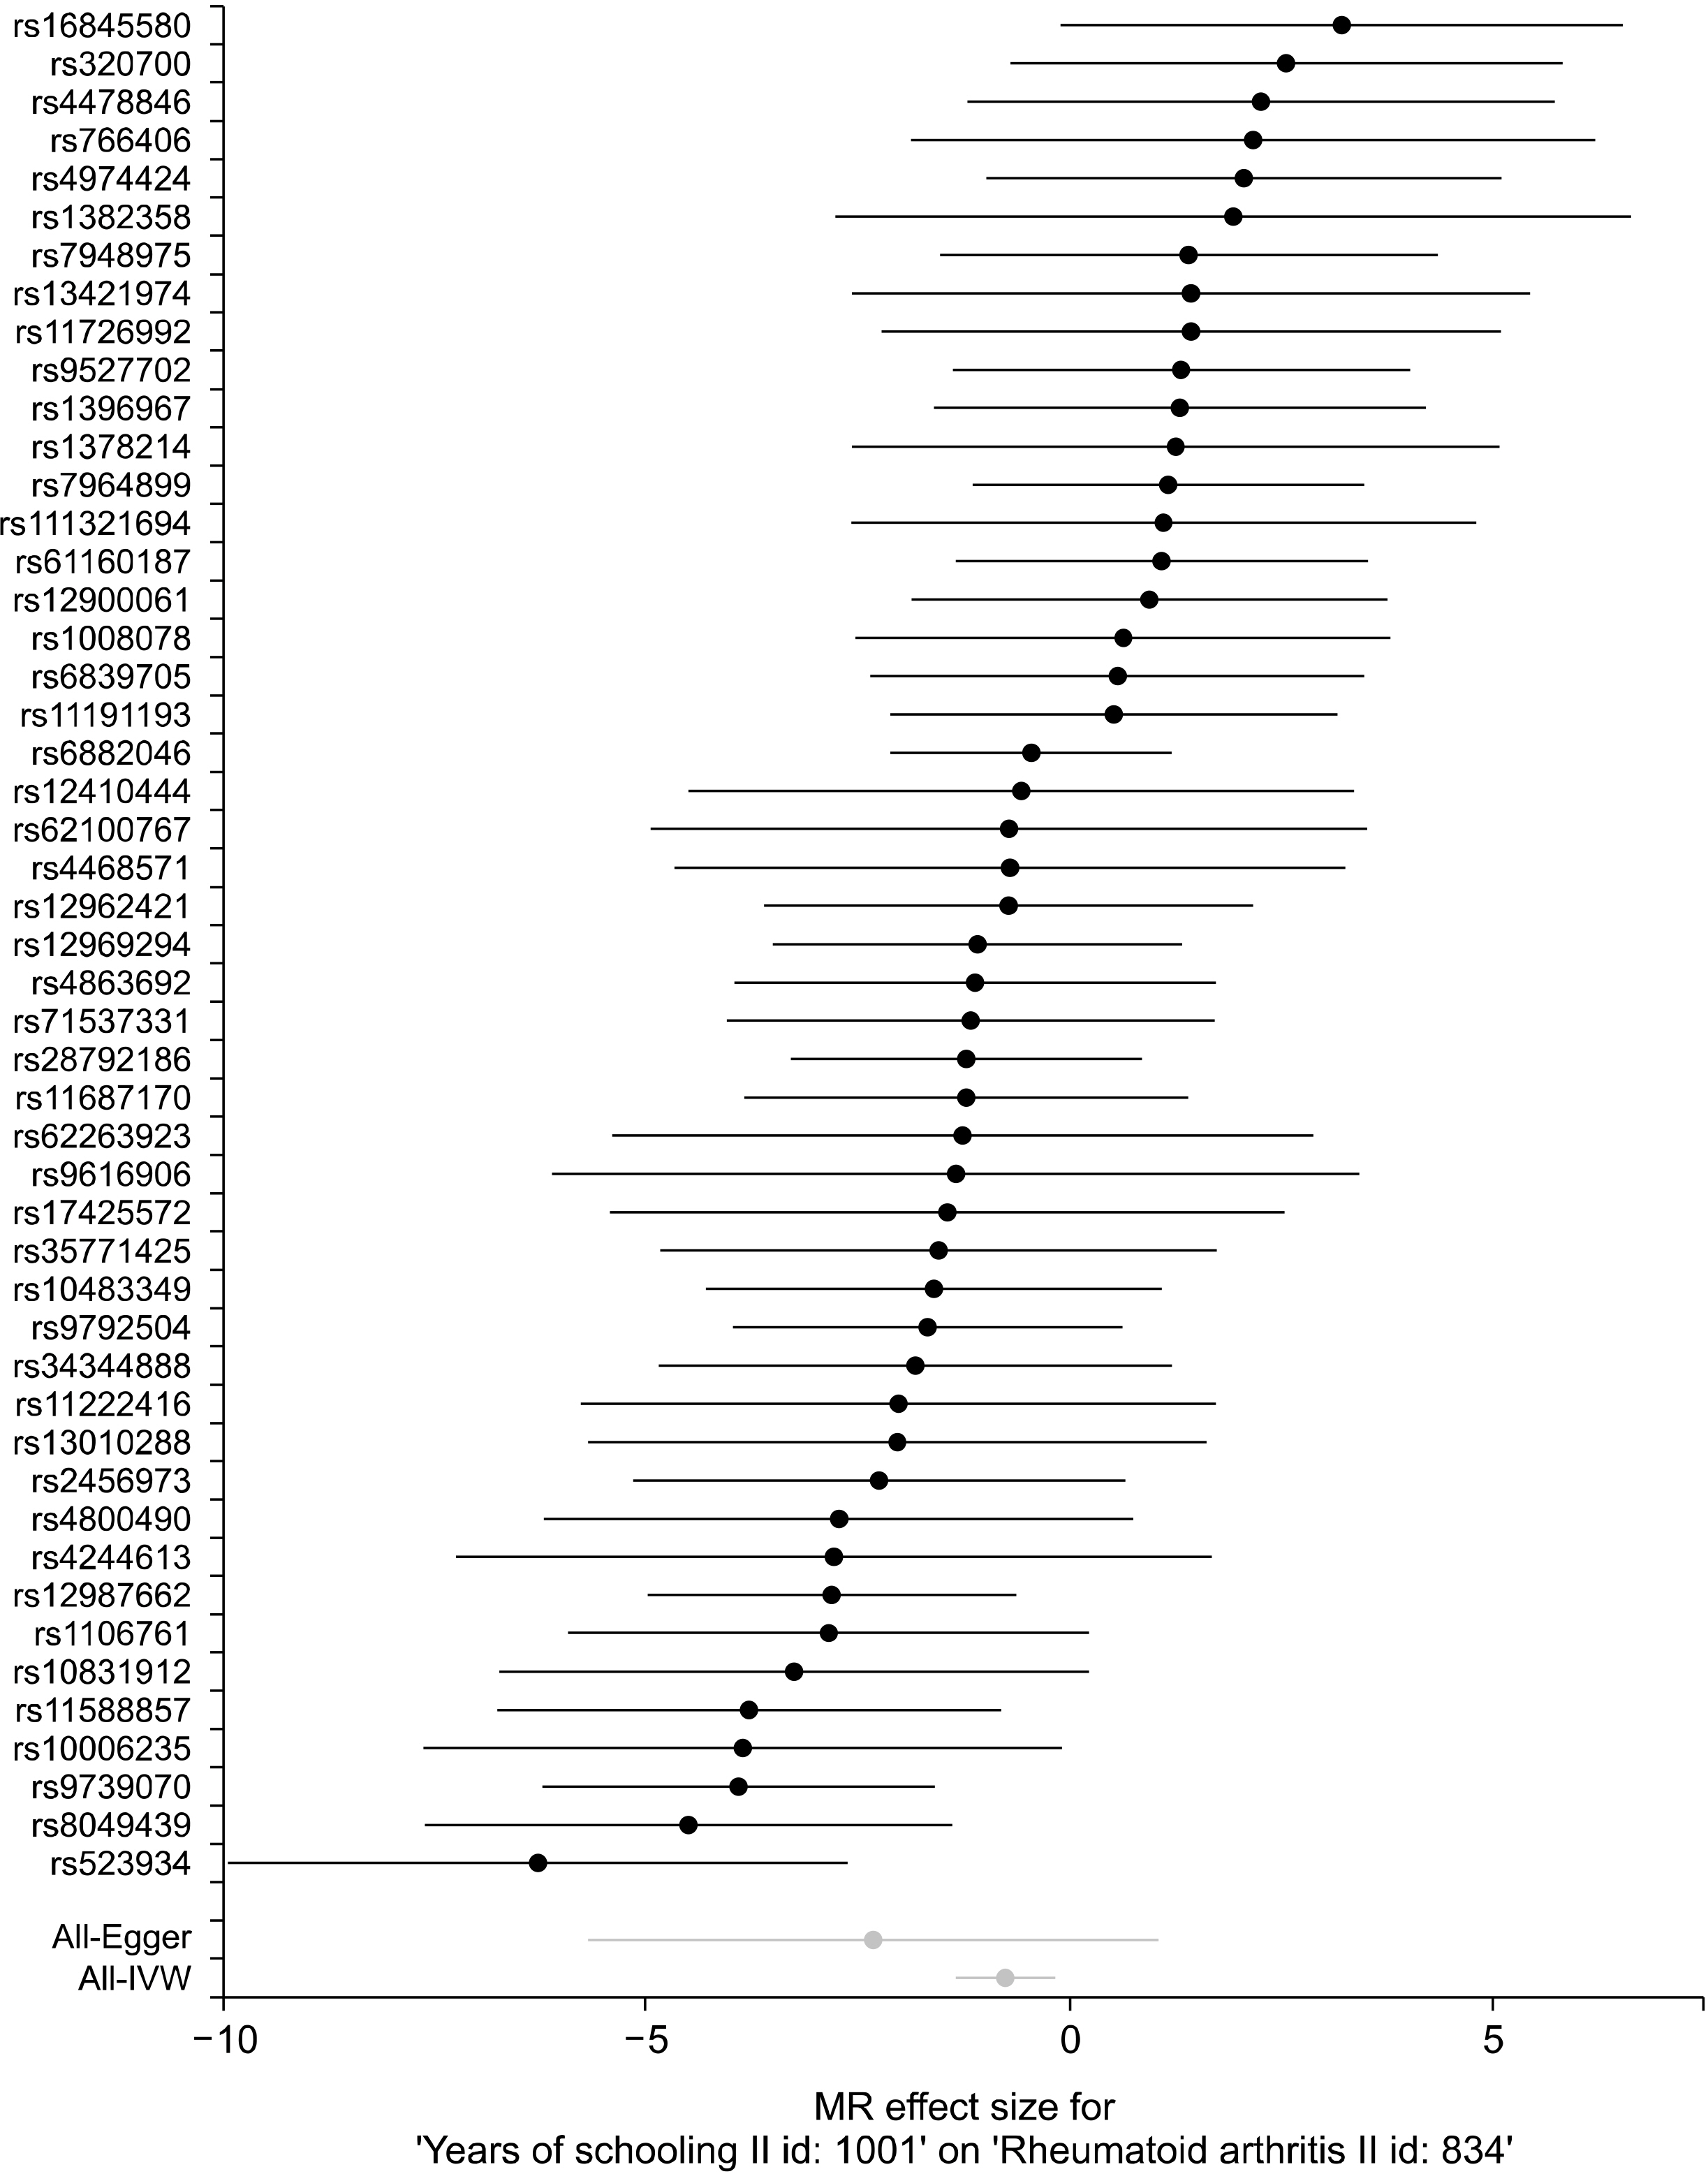 | Figure 3Forest plot of the causal effects of years of education-associated SNPs on RA. SNP: single nucleotide polymorphism, RA: rheumatoid arthritis, MR: Mendelian randomization, IVW: Inverse-variance weighted.
|
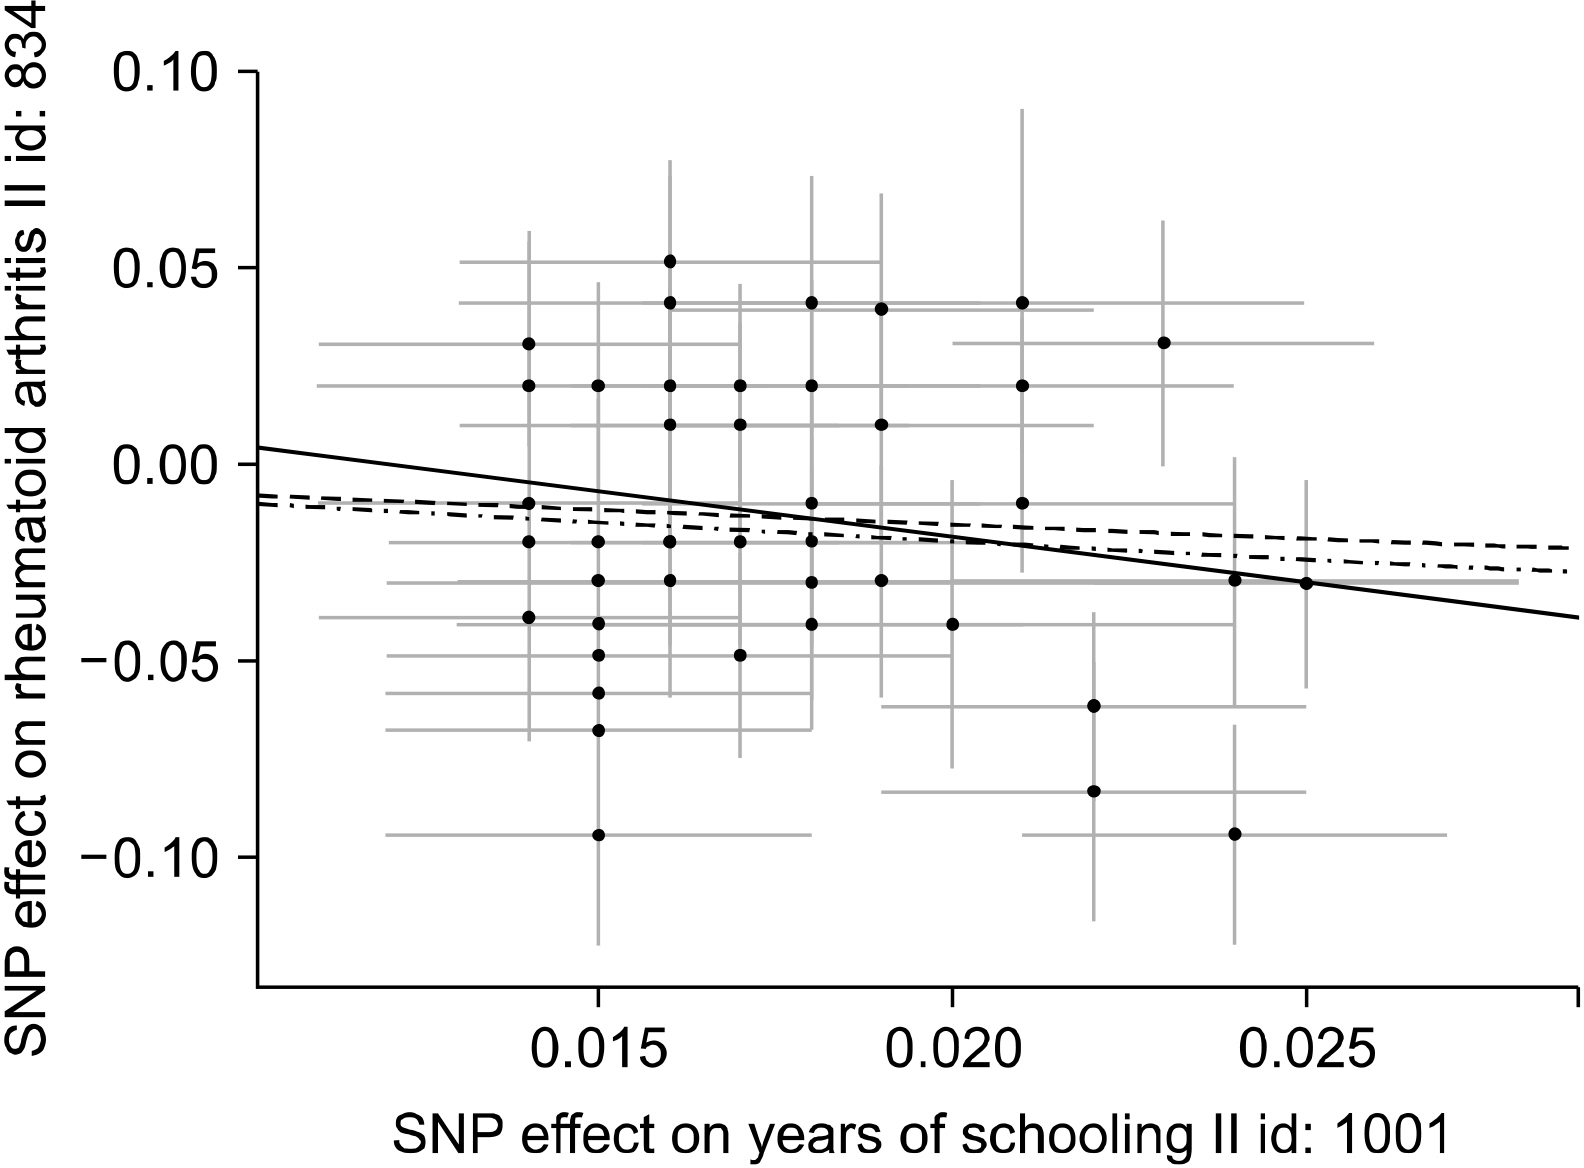 | Figure 4Scatter plots of genetic associations with years of education against the genetic associations with RA. The slopes of each line represent the causal association for each method. The blue line represents the IVW estimate, the green line represents the weighted median estimate, and the dark blue line represents the MR‐Egger estimate. SNP: single nucleotide polymorphism, RA: rheumatoid arthritis, MR: Mendelian randomization, IVW: Inverse-variance weighted.
|
Table 1
The MR estimates from each method of assessing the causal effect of years of education on the risk of RA
| MR method | Number of SNPs | Beta | SE | Association p-value | Cochran Q statistic |
Heterogeneity p-value |
| Inverse variance weighted | 49 | −0.754 | 0.283 | 0.008 | 81.03 | 0.002 |
| MR Egger | 49 | −2.320 | 1.709 | 0.181 | 79.56 | 0.002 |
| Weighted median | 49 | −0.950 | 0.355 | 0.008 | 80.75* | 0.002* |
![]()
Go to :
CONCLUSION
MR studies are similar to RCTs, when the three main IV assumptions are met. Although MR does not serve as a substitute for RCT, it is useful in situations where an RCT is unethical or unavailable. Properly applied, MR is less confusing than the traditional study by using observational data. MR can provide more accurate estimates of the causal effect of a risk factor on an outcome than those obtained from observational studies by overcoming the limitations. MR approaches are increasingly being used to evaluate the causality of associations between risk factors and disease. MR could contribute enormously to our understanding of complex disease etiological architecture. The validity of results from MR studies relies on the correctness of several assumptions, which should be closely checked and interpreted in the context of prior biological knowledge. There may be a number of limitations in MR analyses, and awareness of these is essential for interpreting their results. If properly applied, MR can be majorly successful in uncovering and strengthening the causality between modifiable exposures and a wide range of complex disease-related outcomes. Well-conducted MR studies can be a valuable method for exploring the causal relationships in complex diseases.
Go to :
 XML Download