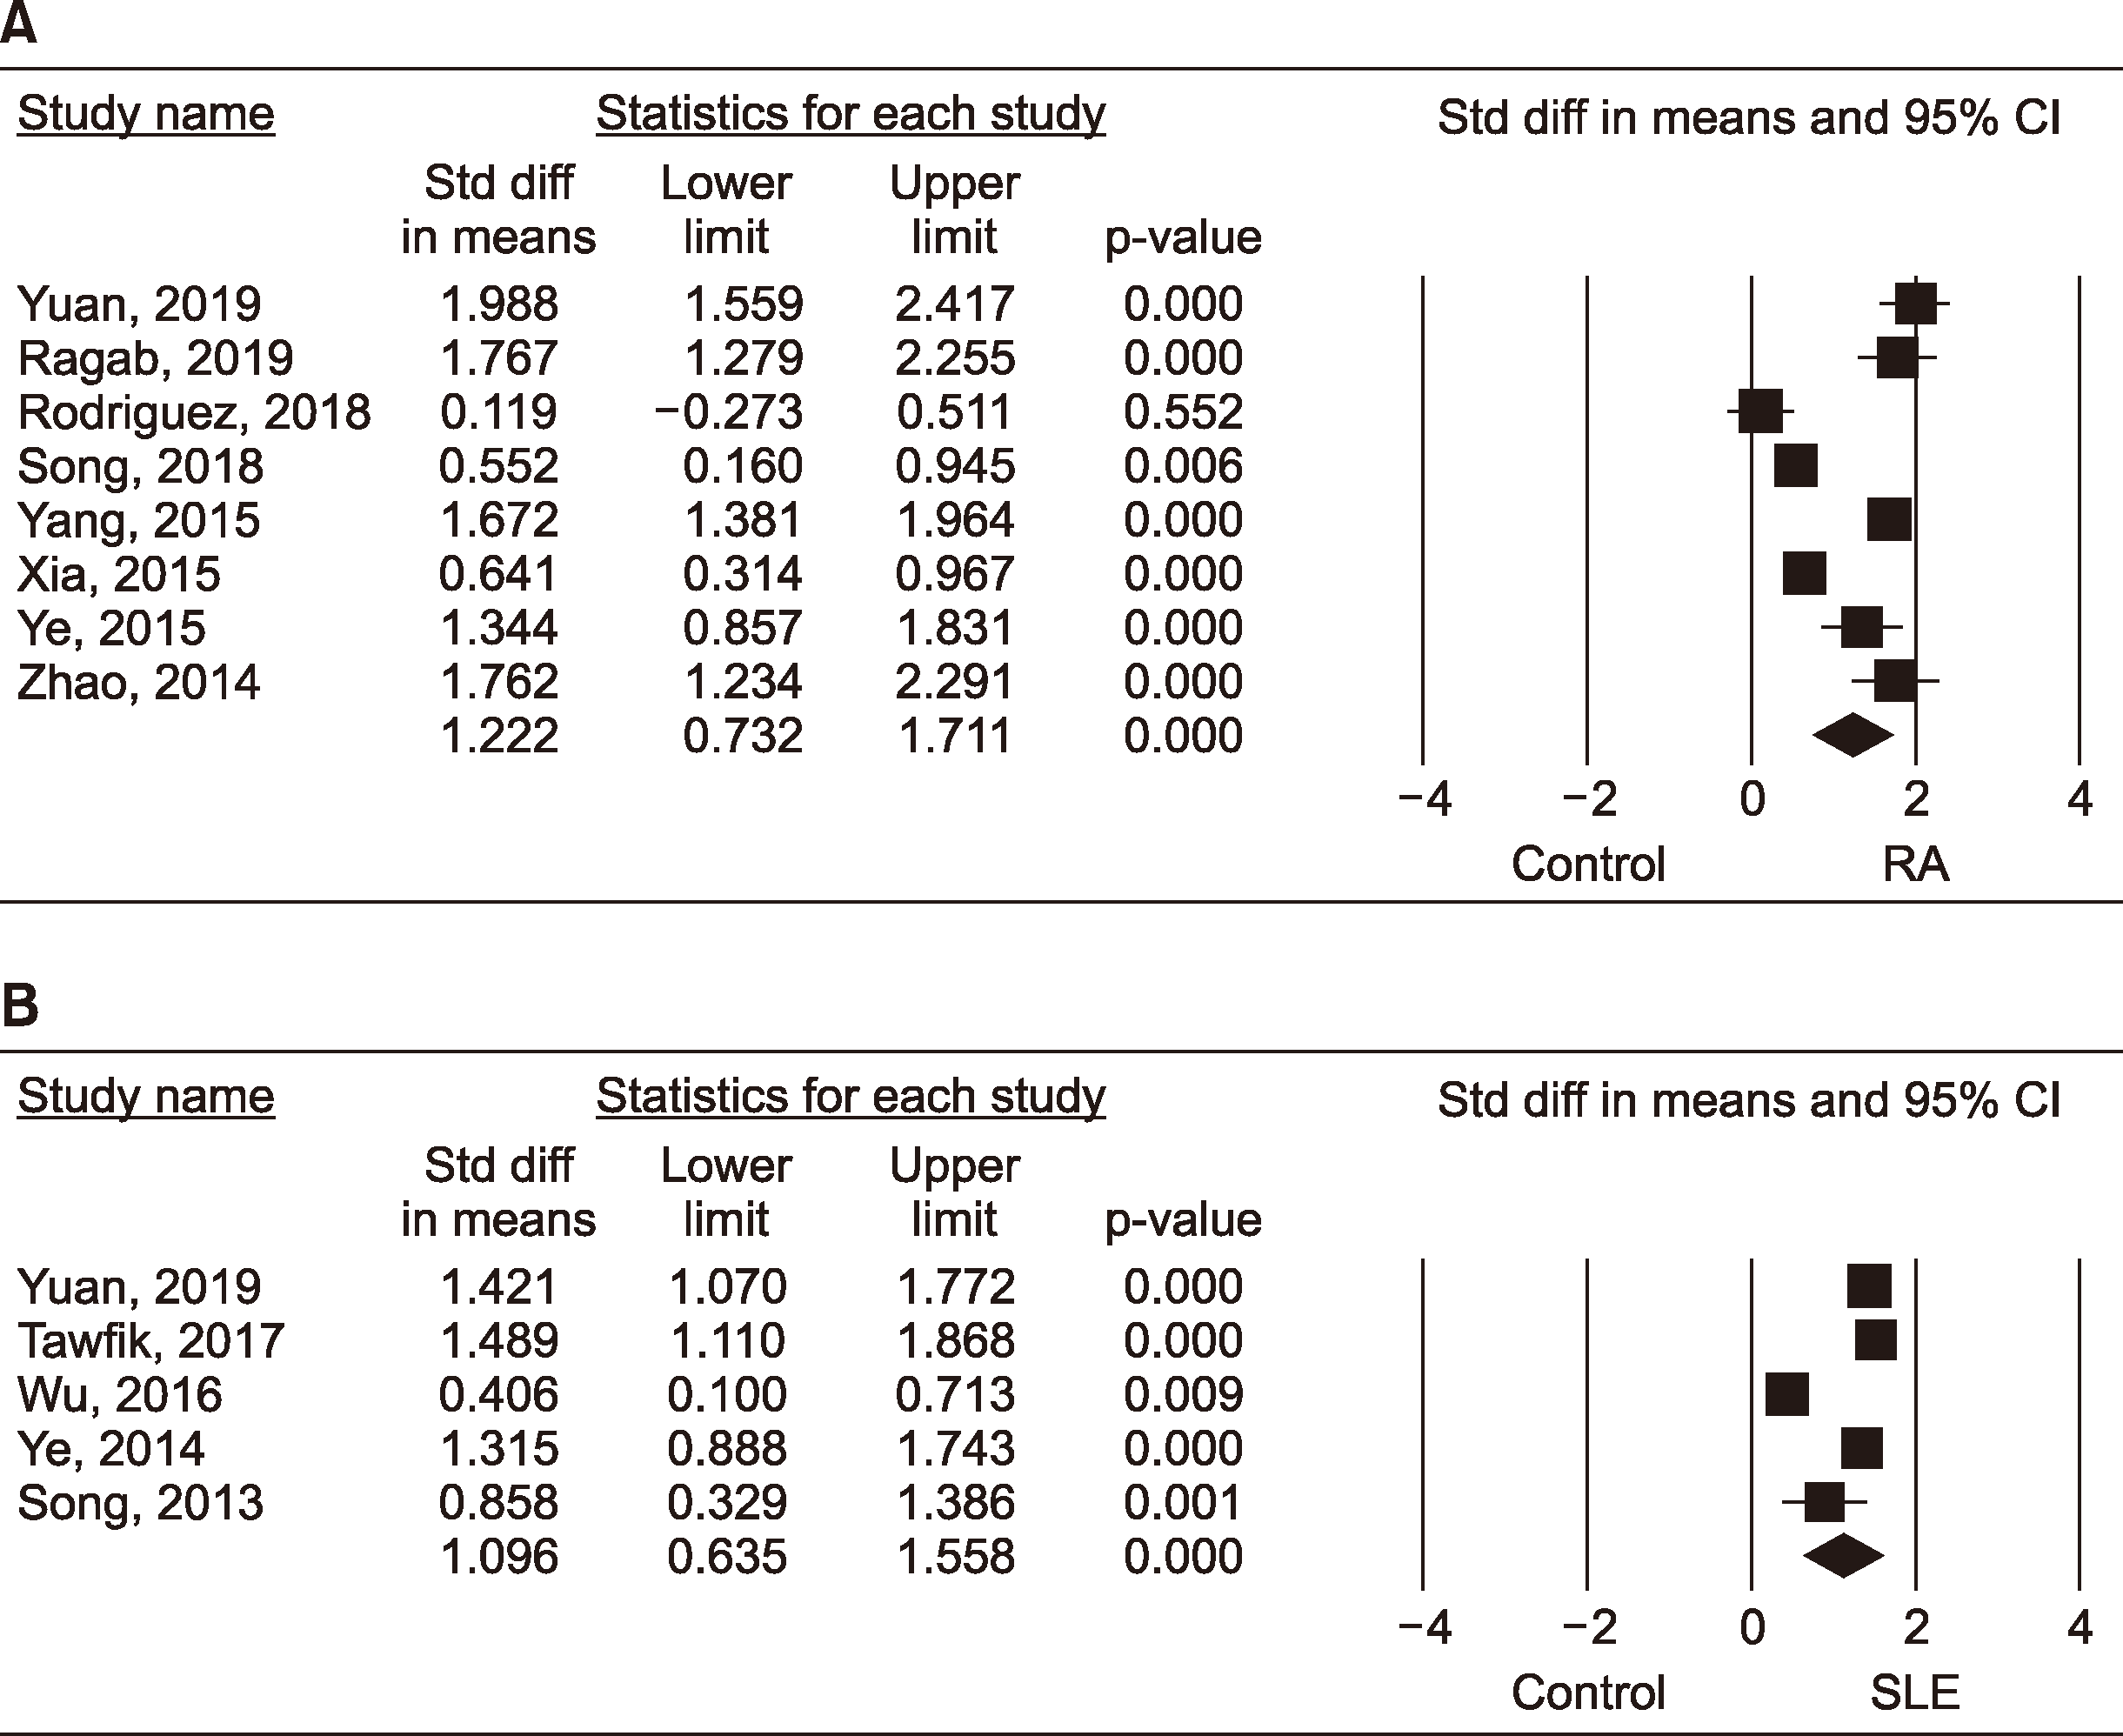
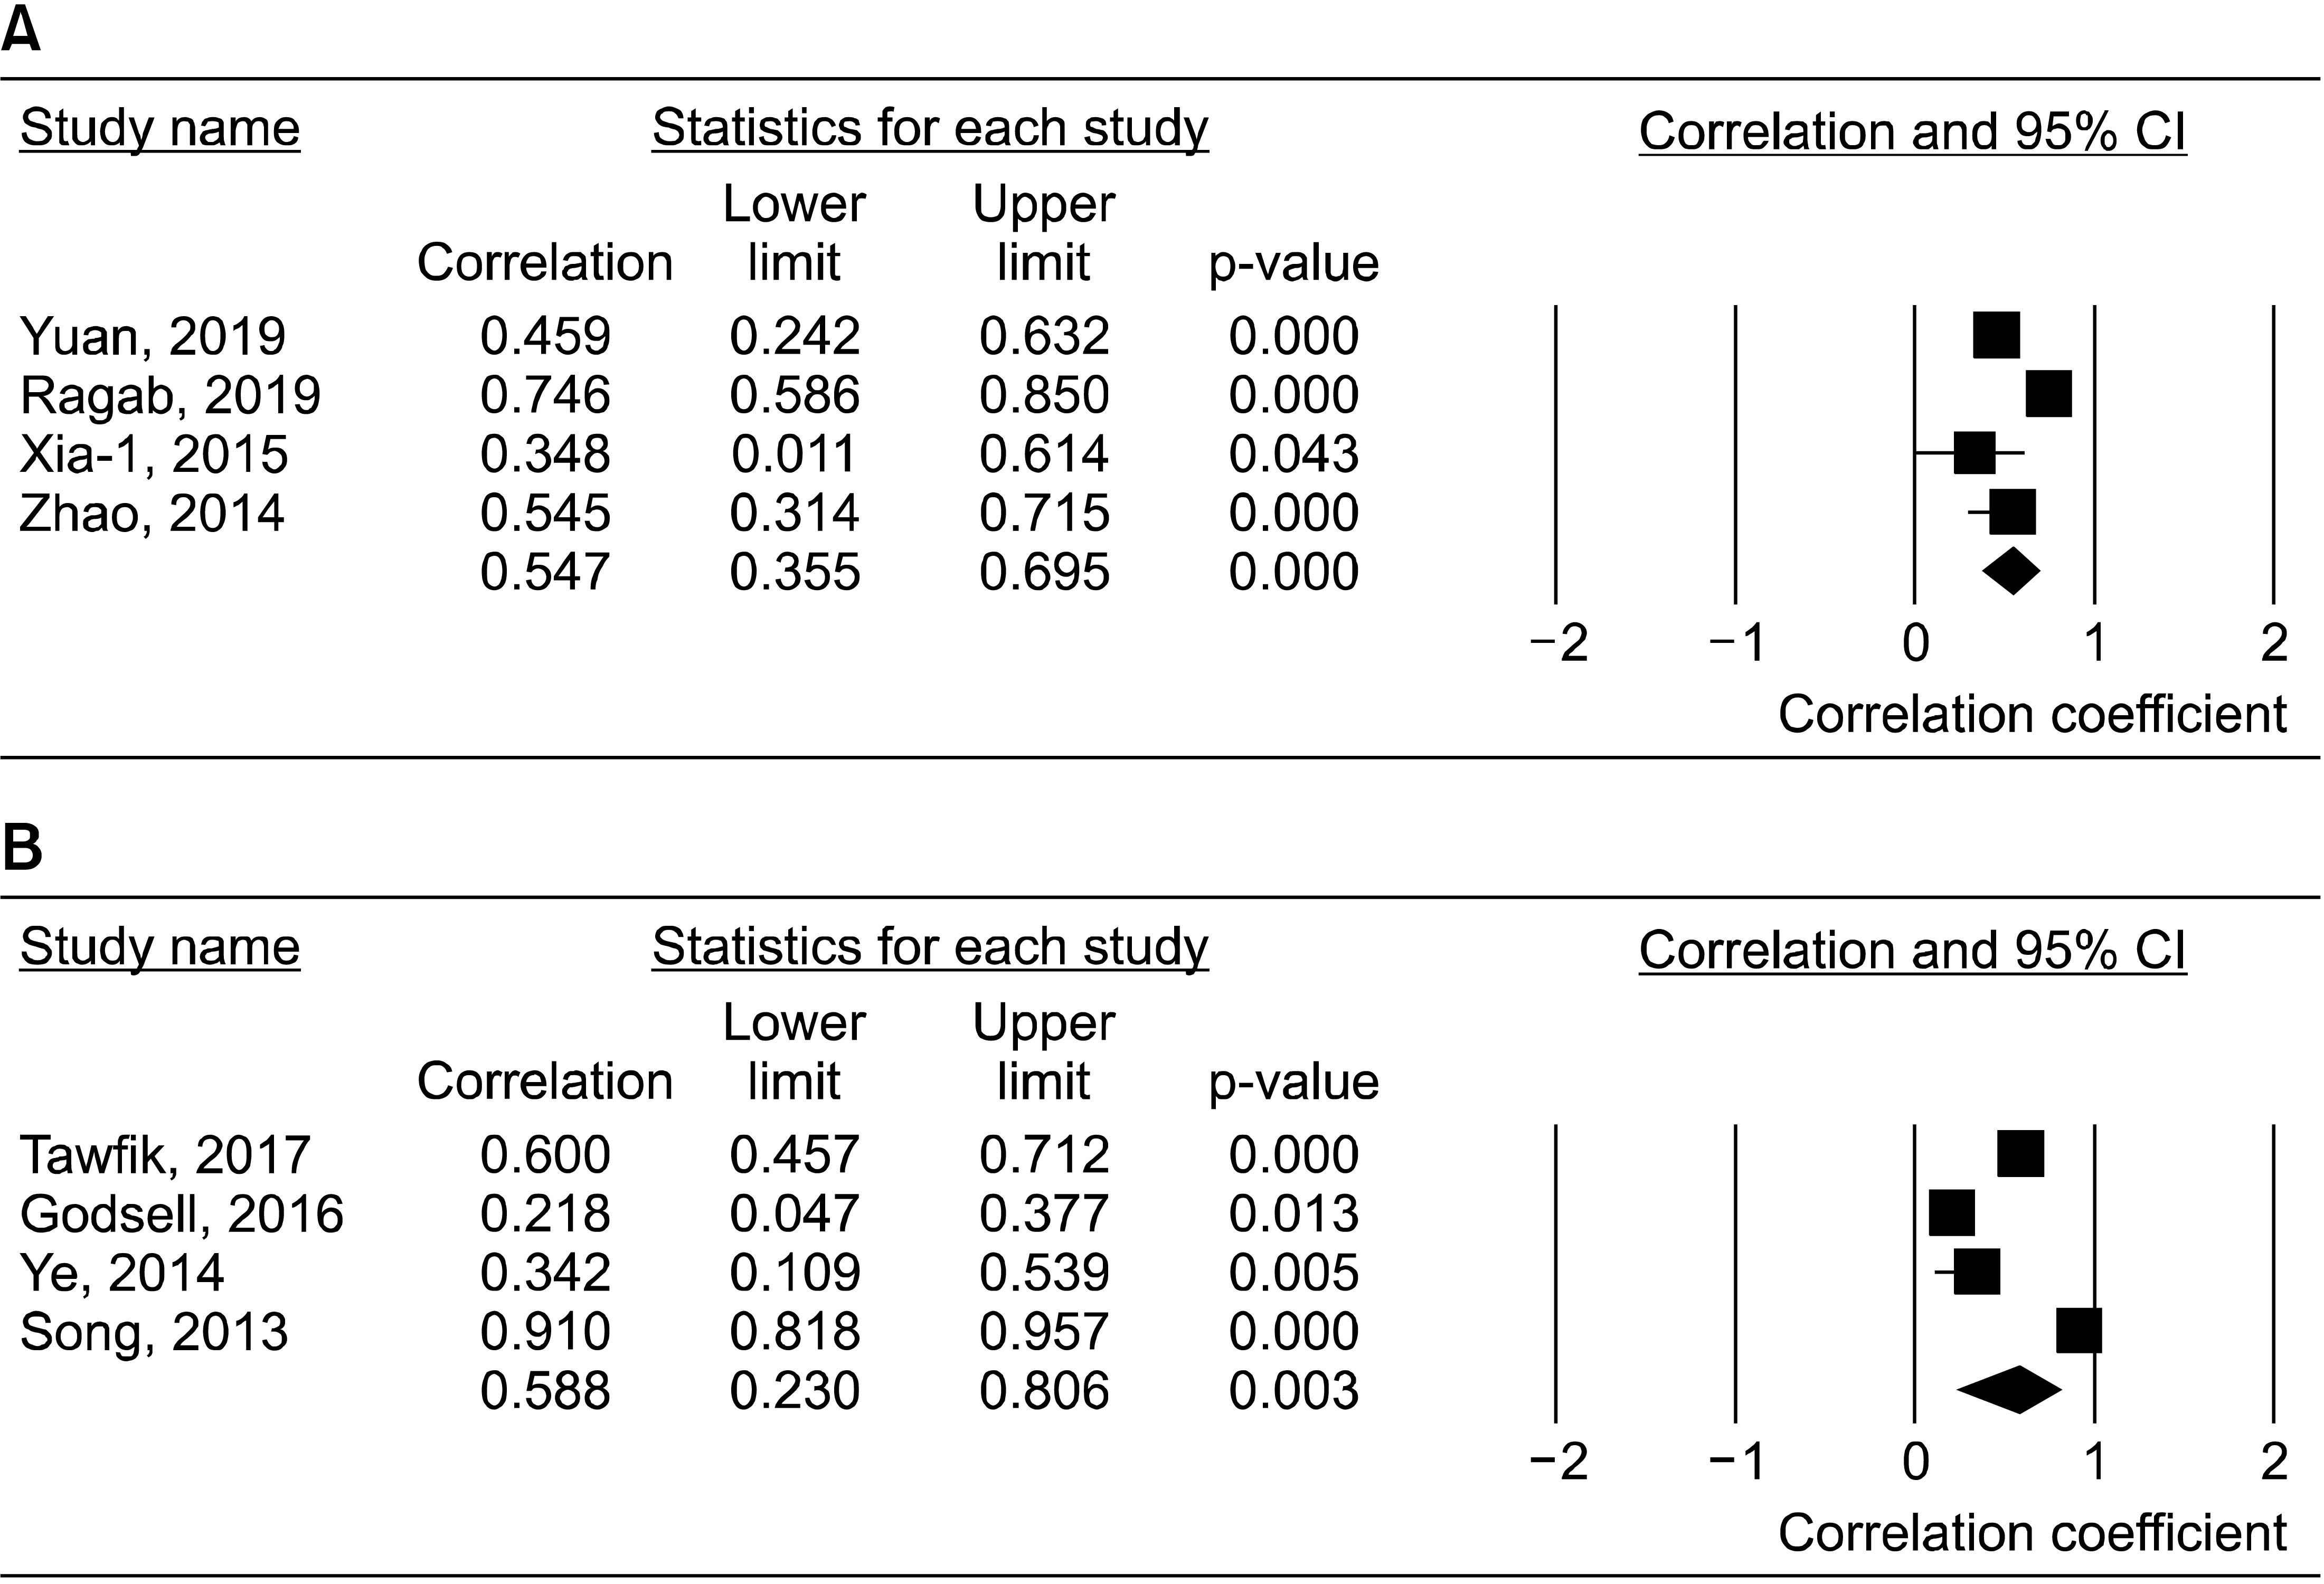
1. Mellado M, Martínez-Muñoz L, Cascio G, Lucas P, Pablos JL, Rodríguez-Frade JM. 2015; T cell migration in rheumatoid arthritis. Front Immunol. 6:384. DOI:
10.3389/fimmu.2015.00384. PMID:
26284069. PMCID:
PMC4515597.

3. Mateen S, Zafar A, Moin S, Khan AQ, Zubair S. 2016; Understanding the role of cytokines in the pathogenesis of rheumatoid arthritis. Clin Chim Acta. 455:161–71. DOI:
10.1016/j.cca.2016.02.010. PMID:
26883280.

4. Boraschi D, Lucchesi D, Hainzl S, Leitner M, Maier E, Mangelberger D, et al. 2011; IL-37: a new anti-inflammatory cytokine of the IL-1 family. Eur Cytokine Netw. 22:127–47. DOI:
10.1684/ecn.2011.0288. PMID:
22047735.

5. Dinarello CA. 2018; Overview of the IL-1 family in innate inflammation and acquired immunity. Immunol Rev. 281:8–27. DOI:
10.1111/imr.12621. PMID:
29247995. PMCID:
PMC5756628.

6. Jia H, Liu J, Han B. 2018; Reviews of interleukin-37: functions, receptors, and roles in diseases. Biomed Res Int. 2018:3058640. DOI:
10.1155/2018/3058640. PMID:
29805973. PMCID:
PMC5899839.

7. Zhao M, Li Y, Guo C, Wang L, Chu H, Zhu F, et al. 2018; IL-37 isoform D downregulates pro-inflammatory cytokines expression in a Smad3-dependent manner. Cell Death Dis. 9:582. DOI:
10.1038/s41419-018-0664-0. PMID:
29789615. PMCID:
PMC5964144.

9. Yuan ZC, Wang JM, Huang AF, Su LC, Li SJ, Xu WD. 2019; Elevated expression of interleukin-37 in patients with rheumatoid arthritis. Int J Rheum Dis. 22:1123–9. DOI:
10.1111/1756-185X.13539. PMID:
30843355.

10. Ragab D, Mobasher S, Shabaan E. 2019; Elevated levels of IL-37 correlate with T cell activation status in rheumatoid arthritis patients. Cytokine. 113:305–10. DOI:
10.1016/j.cyto.2018.07.027. PMID:
30077546.

11. Song L, Wang Y, Sui Y, Sun J, Li D, Li G, et al. 2018; High interleukin-37 (IL-37) expression and increased mucin-domain containing-3 (TIM-3) on peripheral T cells in patients with rheumatoid arthritis. Med Sci Monit. 24:5660–7. DOI:
10.12659/MSM.909254. PMID:
30106887. PMCID:
PMC6104553.

12. Yang L, Zhang J, Tao J, Lu T. 2015; Elevated serum levels of Interleukin-37 are associated with inflammatory cytokines and disease activity in rheumatoid arthritis. APMIS. 123:1025–31. DOI:
10.1111/apm.12467. PMID:
26547368.

13. Ye L, Jiang B, Deng J, Du J, Xiong W, Guan Y, et al. 2015; IL-37 alleviates rheumatoid arthritis by suppressing IL-17 and IL-17-triggering cytokine production and limiting Th17 cell proliferation. J Immunol. 194:5110–9. DOI:
10.4049/jimmunol.1401810. PMID:
25917106.

14. Xia T, Zheng XF, Qian BH, Fang H, Wang JJ, Zhang LL, et al. 2015; Plasma interleukin-37 is elevated in patients with rheumatoid arthritis: its correlation with disease activity and Th1/Th2/Th17-related cytokines. Dis Markers. 2015:795043. DOI:
10.1155/2015/795043. PMID:
26435567. PMCID:
PMC4578832.

15. Zhao PW, Jiang WG, Wang L, Jiang ZY, Shan YX, Jiang YF. 2014; Plasma levels of IL-37 and correlation with TNF-
α, IL-17A, and disease activity during DMARD treatment of rheumatoid arthritis. PLoS One. 9:e95346. DOI:
10.1371/journal.pone.0095346. PMID:
24788826. PMCID:
PMC4006923.
16. Tawfik MG, Nasef SI, Omar HH, Ghaly MS. 2017; Serum interleukin-37: a new player in lupus nephritis? Int J Rheum Dis. 20:996–1001. DOI:
10.1111/1756-185X.13122. PMID:
28627005.

17. Godsell J, Rudloff I, Kandane-Rathnayake R, Hoi A, Nold MF, Morand EF, et al. 2016; Clinical associations of IL-10 and IL-37 in systemic lupus erythematosus. Sci Rep. 6:34604. DOI:
10.1038/srep34604. PMID:
27708376. PMCID:
PMC5052569.

18. Wu GC, Li HM, Wang JB, Leng RX, Wang DG, Ye DQ. 2016; Elevated plasma interleukin-37 levels in systemic lupus erythematosus patients. Lupus. 25:1377–80. DOI:
10.1177/0961203316646462. PMID:
27125292.

19. Ye L, Ji L, Wen Z, Zhou Y, Hu D, Li Y, et al. 2014; IL-37 inhibits the production of inflammatory cytokines in peripheral blood mononuclear cells of patients with systemic lupus erythematosus: its correlation with disease activity. J Transl Med. 12:69. DOI:
10.1186/1479-5876-12-69. PMID:
24629023. PMCID:
PMC4003851.

20. Song L, Qiu F, Fan Y, Ding F, Liu H, Shu Q, et al. 2013; Glucocorticoid regulates interleukin-37 in systemic lupus erythematosus. J Clin Immunol. 33:111–7. DOI:
10.1007/s10875-012-9791-z. PMID:
22961070.

21. Xia L, Shen H, Lu J. 2015; Elevated serum and synovial fluid levels of interleukin-37 in patients with rheumatoid arthritis: attenuated the production of inflammatory cytokines. Cytokine. 76:553–7. DOI:
10.1016/j.cyto.2015.06.005. PMID:
26159110.

22. Rodríguez-Carrio J, Alperi-López M, López P, Ballina-García FJ, Suárez A. 2018; Profiling of B-cell factors and their decoy receptors in rheumatoid arthritis: association with clinical features and treatment outcomes. Front Immunol. 9:2351. DOI:
10.3389/fimmu.2018.02351. PMID:
30369929. PMCID:
PMC6194314.

23. Moher D, Liberati A, Tetzlaff J, Altman DG. PRISMA Group. 2009; Preferred reporting items for systematic reviews and meta-analyses: the PRISMA statement. PLoS Med. 6:e1000097. DOI:
10.1371/journal.pmed.1000097. PMID:
19621072. PMCID:
PMC2707599.

24. Hozo SP, Djulbegovic B, Hozo I. 2005; Estimating the mean and variance from the median, range, and the size of a sample. BMC Med Res Methodol. 5:13. DOI:
10.1186/1471-2288-5-13. PMID:
15840177. PMCID:
PMC1097734.

26. Cohen J. 1988. Statistical power analysis for the behavioral sciences. 2nd ed. Lawrence Erlbaum;Hillsdale (NJ):
29. Higgins JP, Thompson SG. 2002; Quantifying heterogeneity in a meta-analysis. Stat Med. 21:1539–58. DOI:
10.1002/sim.1186. PMID:
12111919.

32. Cavalli G, Koenders M, Kalabokis V, Kim J, Tan AC, Garlanda C, et al. 2016; Treating experimental arthritis with the innate immune inhibitor interleukin-37 reduces joint and systemic inflammation. Rheumatology (Oxford). 55:2220–9. DOI:
10.1093/rheumatology/kew325. PMID:
27567100. PMCID:
PMC5144668.


 PDF
PDF Citation
 Print
Print


 XML Download