Introduction
Aim
Materials and Methods
Animals and study design
Drugs and chemicals
Experimental protocol
Samples collection
Histopathologic examination
Ultrastructure examination
Assessment of oxidative stress biomarkers
Statistical analysis
Results
General observation
Body weight, heart weight, and heart weight/body weight ratio
Table 1
| Animal group (number=6 rats) | Initial BW | Pre-ADR BW | Final BW | HW | HW/BW % | Mortality % |
|---|---|---|---|---|---|---|
| Control | 204.8±5.9 | 213.8±5.90 | 228.0±6.7a,b,d) | 1.33±0.04** | 0.59±0.02 | 0 |
| AGE | 198.4±5.6 | 205.6±4.20 | 219.2±4.2a,b,c,d) | 1.29±0.30** | 0.58±0.03 | 0 |
| ADR | 211.6±4.8 | 223.4±7.02 | 201.6±4.2a,b,c) | 0.99±0.13* | 0.51±0.06* | 16.7 |
| AGE+ADR | 211.8±5.5 | 219.4±5.98 | 203.0±5.8a,b,c) | 1.10±0.12 * | 0.55±0.04 | 0 |
| ADR+AGE | 203.4±6.5 | 218.2±2.90 | 206.8±4.7b,c) | 1.14±0.04*,** | 0.48±0.11* | 0 |
| AGE+ADR+AGE | 209.4±4.3 | 222.4±5.03 | 215.0±3.5a,b,c,d) | 1.18±0.09*,** | 0.55±0.04* | 0 |
Values are presented as mean±SD (n=6). AGE, aged garlic extract; ADR, adriamycin; BW, body weight; HW, heart weight; Pre-ADR BW, the BW before injection of ADR. a)Significant difference (P<0.05) between the final and initial BW of same group; b)Significant difference (P<0.01) between the BW at the date of ADR-injection and final BW of the same group; c)Significant difference (P<0.05) from the final BW of the control group; d)Significant difference (P<0.05) from the final BW of the ADR-treated group. *Significant difference (P<0.05) from the HW of control groups. **Significant difference (P<0.05) from HW of ADR-treated rats. One-way ANOVA followed by Tukey’s post-hoc test.
Serum level of the cardiac enzymes
Table 2
| Animal group | CK (U/l) | LDH (U/l) | ALP (U/l) |
|---|---|---|---|
| Control | 100.3±7.8b) | 391.7±61.8b) | 143.5±8.9b) |
| AGE-treated | 100.8±7.4b) | 395.5±62.2b) | 144.8±7.7b) |
| ADR-treated | 721.7±65.6a) | 1090±132.8a) | 49.3±8.6a) |
| AGE pre ADR-treated | 421.7±56.4a,b) | 723.3±72.3a,b) | 79.2±7.9a,b) |
| AGE post ADR-treatment | 375±52.1a,b) | 628.3±83.8a,b) | 91.8±9.9a,b) |
| AGE pre- and post ADR-treated | 265±53.2a,b) | 536.7±85.0a,b) | 111.5±10.2a,b) |
Values are presented as mean±SD (n=6). AGE, aged garlic extract; ADR, adriamycin; CK, total creatine kinase; LDH, lactic dehydrogenase; ALP, alkaline phosphatase enzymes. a)Significant difference (P<0.05) vs. control group; b)Significant difference (P<0.05) vs. ADR-treated group. One-way ANOVA with post-hoc Tukey multiple comparison test was used.
Tissue oxidant/antioxidant biomarkers
Table 3
| Animal group (number=6 rats) | MDA (nmol/g) | GSH (mmol/g) | GSH-Px (U/mg) | CAT (U/mg) | SOD (U/mg) |
|---|---|---|---|---|---|
| Control | 75.7±6.5e) | 1.20±0.30e) | 6.6±0.88e) | 52.7±3.6e) | 55.8±2.9e) |
| AGEa) | 72.8±7.5e) | 1.20±0.20e) | 6.4±0.91e) | 53.3±2.9e) | 55.3±3.1e) |
| ADRb) | 111.0±12.7d) | 0.84±0.15a) | 3.4±0.73d) | 37.5±3.5a) | 43.2±3.8d) |
| AGE+ADRc) | 96.2±8.2d,e) | 0.95±0.16 | 4.0±0.64d) | 41.5±3.7a) | 50±3.2d,e) |
| ADR+AGE | 93.0±8.8d,e) | 1.00±0.18 | 4.3±0.86d) | 44.3±3.4d,e) | 52.8±3.1e) |
| AGE+ADR+AGE | 87.8±8.1d,e) | 1.10±0.18e) | 5.6±0.84e) | 50.3±3.8e) | 54.2±2.9e) |
Values are presented as mean±SD (n=6). AGE, aged garlic extract; ADR, adriamycin; MDA, malondialdehyde; GSH, glutathione; GSH-Px, glutathione-peroxidase; CAT, catalase; SOD, superoxide dismutase. a)Aged garlic extract-treated group; b)Adriamycin-treated group; c)The combined AGE and ADR-treated groups. d)P<0.05 vs. control; e)P<0.5 vs. ADR-treatedgroup. Analyzed by one-way ANOVA followed by Tukey’s post-hoc test.
Histopathological findings
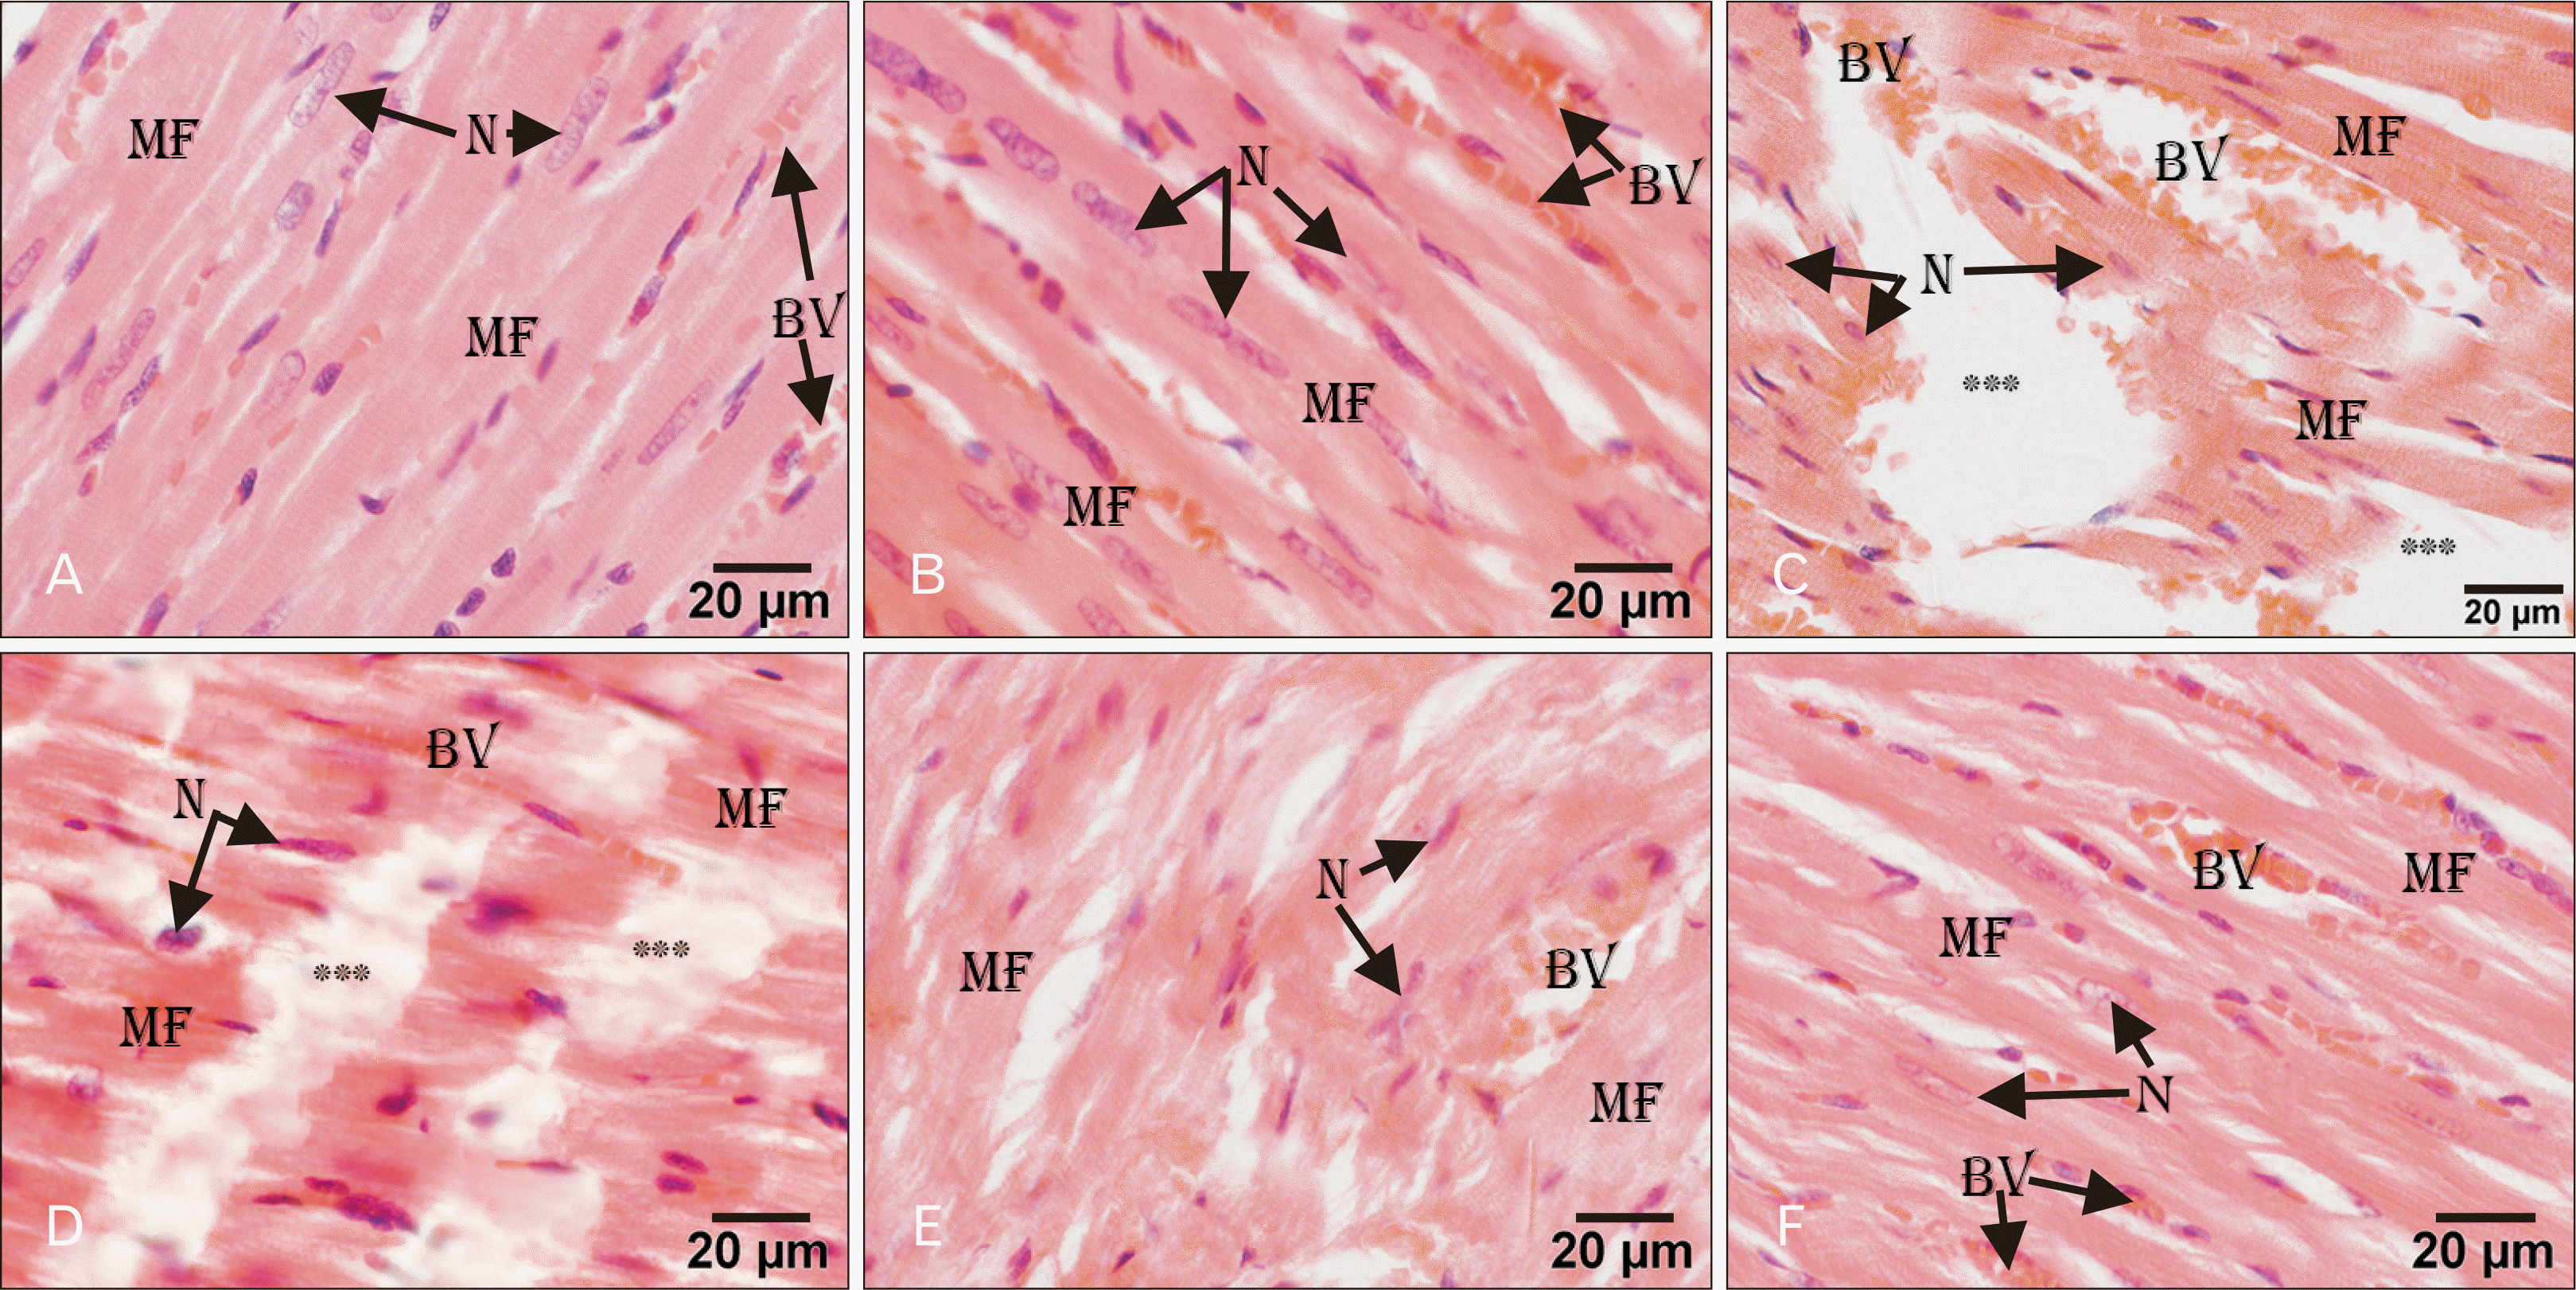 | Fig. 1Light micrographs of rat heart. (A, B) Control and AGE-treated group showing normal organization of the heart structure of branching MF, with myocytes having central elongated N, and numerous BV in-between. (C) ADR-treated showing marked tissue necrosis (***), disorganized degenerated MF, apoptotic N, interstitial edema, and dilated congested BV. (D) AGE pre-treated group showing areas of tissue necrosis (***), degenerated MF, and BV. (E) AGE post-treated group showing minimal myofibrillar degeneration (MF) with the wavy organization and congested BV. (F) Combined pre- and post-AGE treated group showing normally organized MF, myocytes with central elongated N and vascular congestion (BV) in-between. H&E stain, Scale bars=20 µm (A–F). ADR, adriamycin; AGE, aged garlic extract; BV, blood vessels; MF, myofibrils; N, nuclei. |
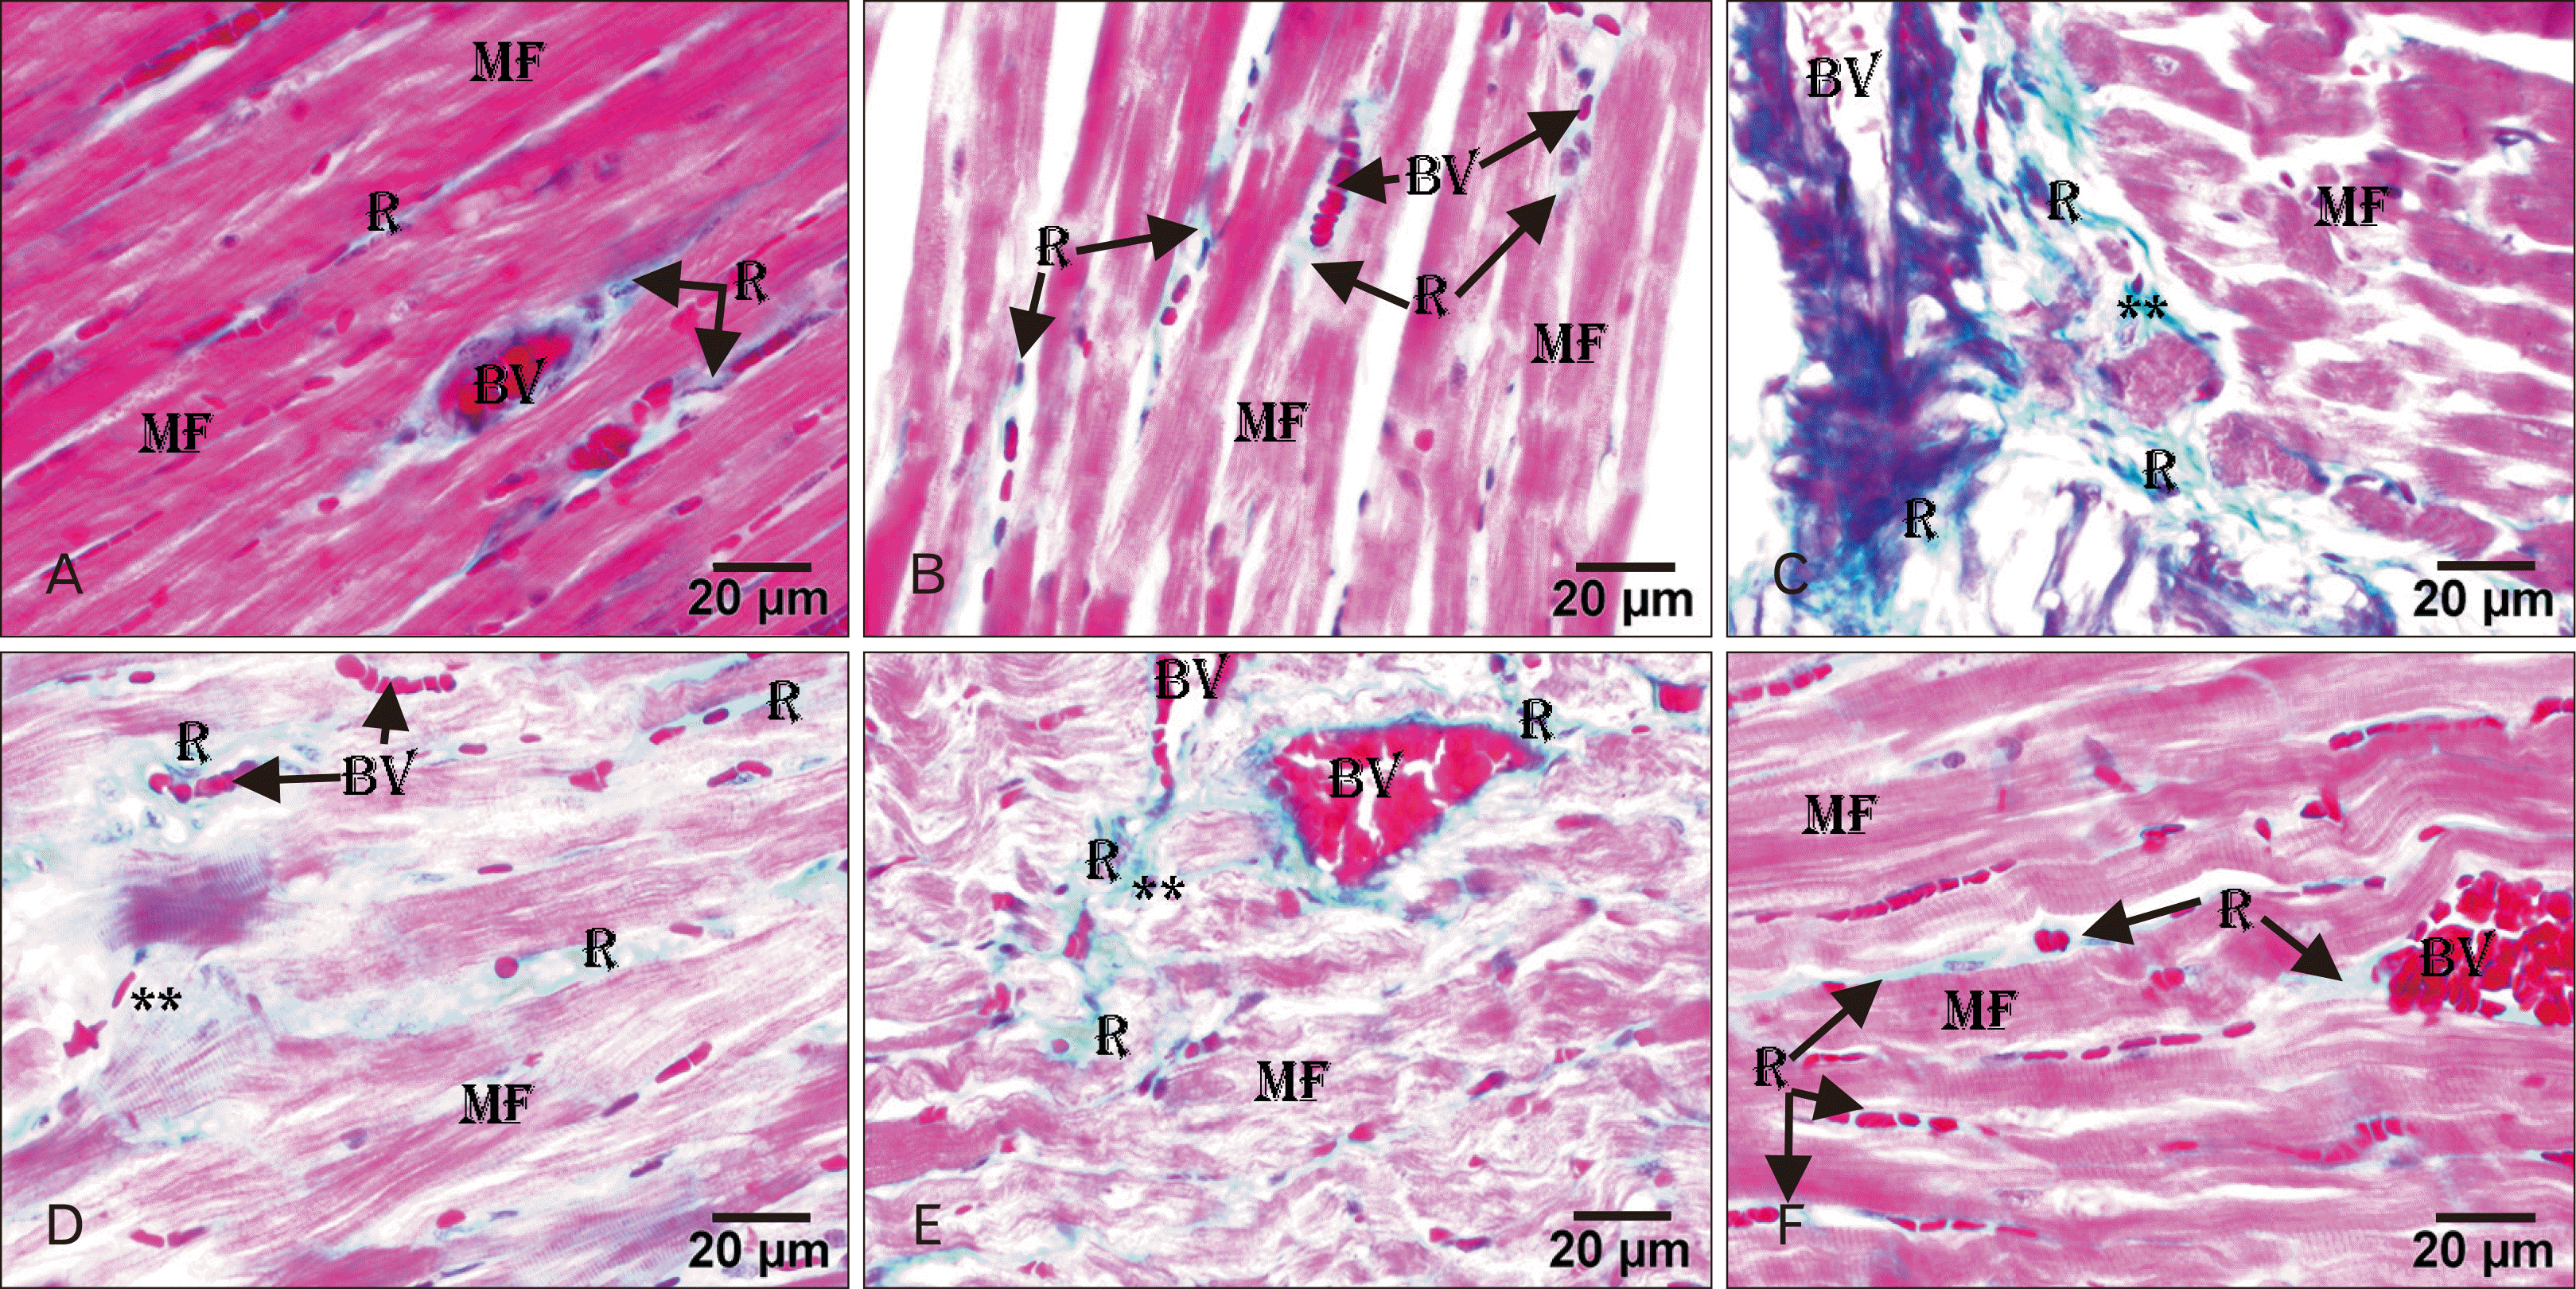 | Fig. 2Light micrographs of rat heart. (A) Control group showing little collagen fibers (R) between the MF and around the BV. (B) AGE-treated group showing minimal collagen fibers (R) between the MF and around the BV. (C) ADR-treated group showing an excessive amount of collagen fibers (R) around the congested BV and between the MF. (D) AGE pre-treated group showing an excessive amount of collagen fibers (R) between the MF and around the BV. (E) AGE post-treated group showing minimal collagen fibers (R) between the cardiac MF and around the BV. (C–E) Symbol ** represent the degenerated area of myocardium. (F) AGE combined pre- and post-treated group showing a minimal amount of collagen fibers (R) between the MF and around the BV. Masson trichrome stain, Scale bars=20 µm (A–F). ADR, adriamycin; AGE, aged garlic extract; BV, blood vessels; MF, myofibrils; R, positive PAS reaction. |
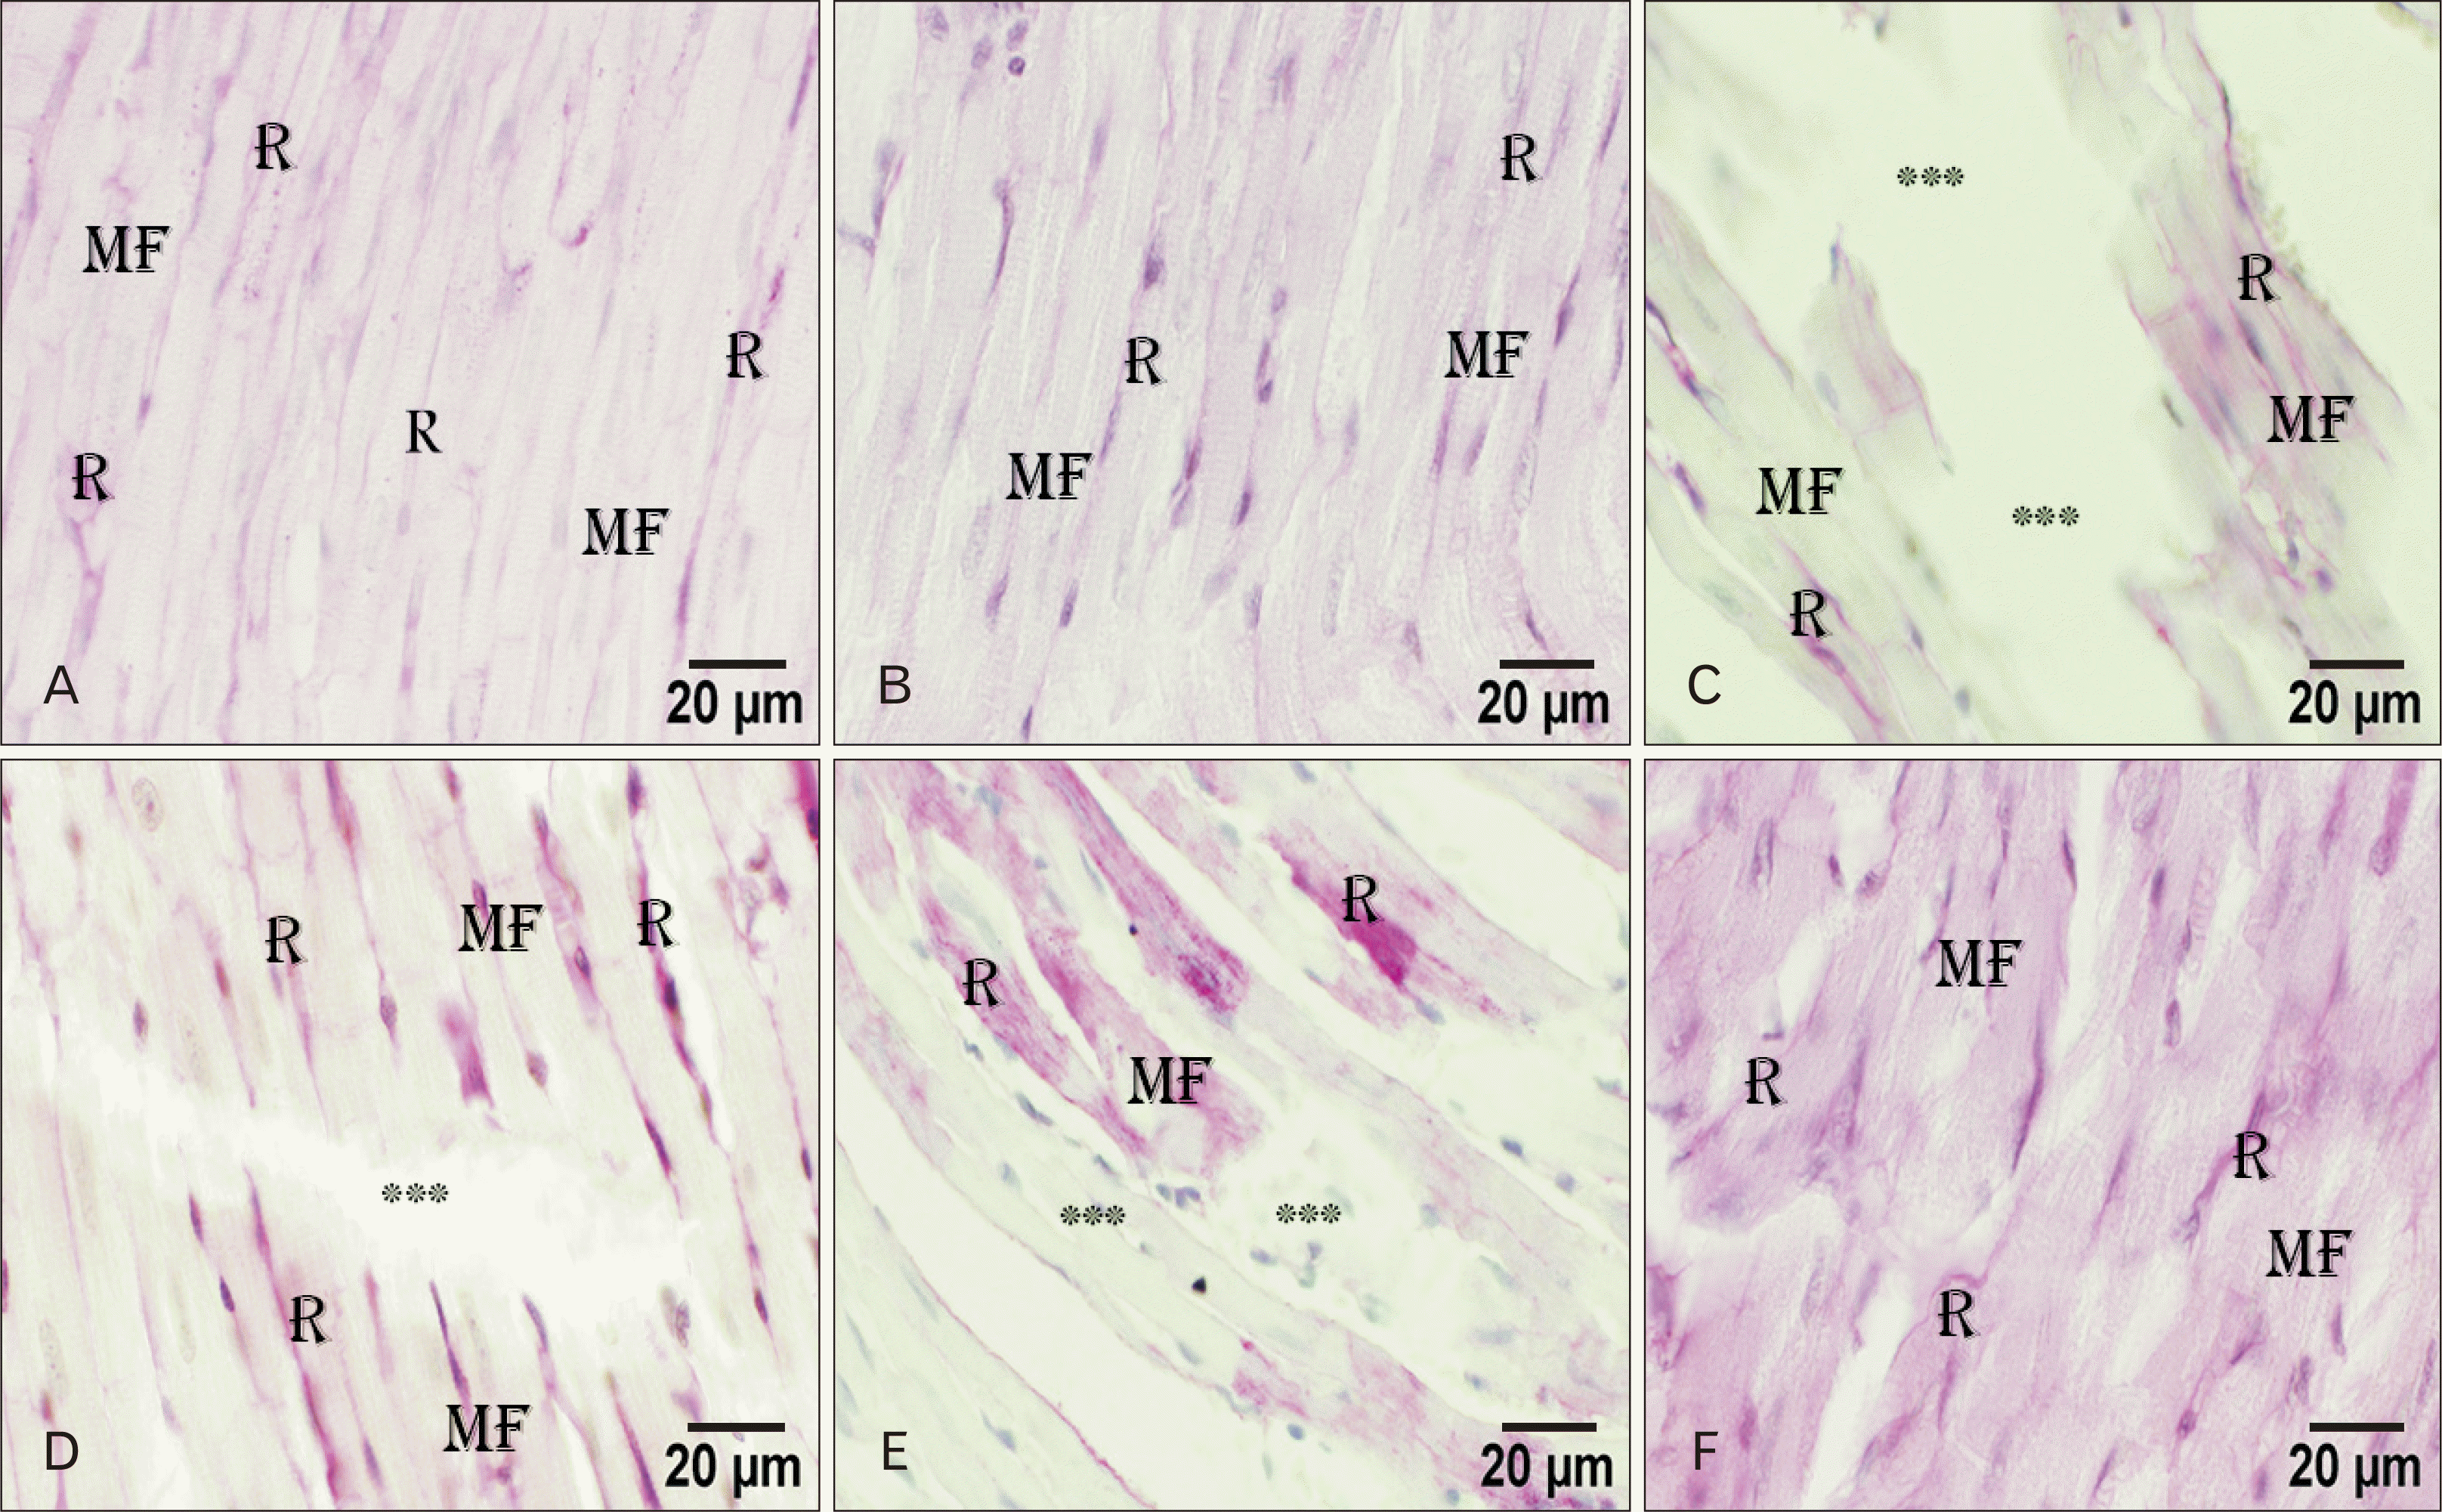 | Fig. 3Light micrographs of the rat heart. (A) Control group showing a R at the perimysium of the MF. (B) AGE-treated group showing a minimal R at the perimysium of the MF. (C) ADR-treated group showing minimal R at the perimysium of the remaining MF. (D) AGE pre-treated group showing a R at the perimysium between the MF. (E) AGE post-treated group showing a R at the perimysium between the MF. (C–E) Symbol *** represent the degenerated area of myocardium. (F) AGE combined pre- and post-treated group showing an excessive R at the perimysium between the MF. PAS stain, Scale bars=20 µm (A–F). ADR, adriamycin; AGE, aged garlic extract; MF, myofibrils; PAS, periodic acid Schiff’s; R, positive PAS reaction. |
Electron microscopic findings
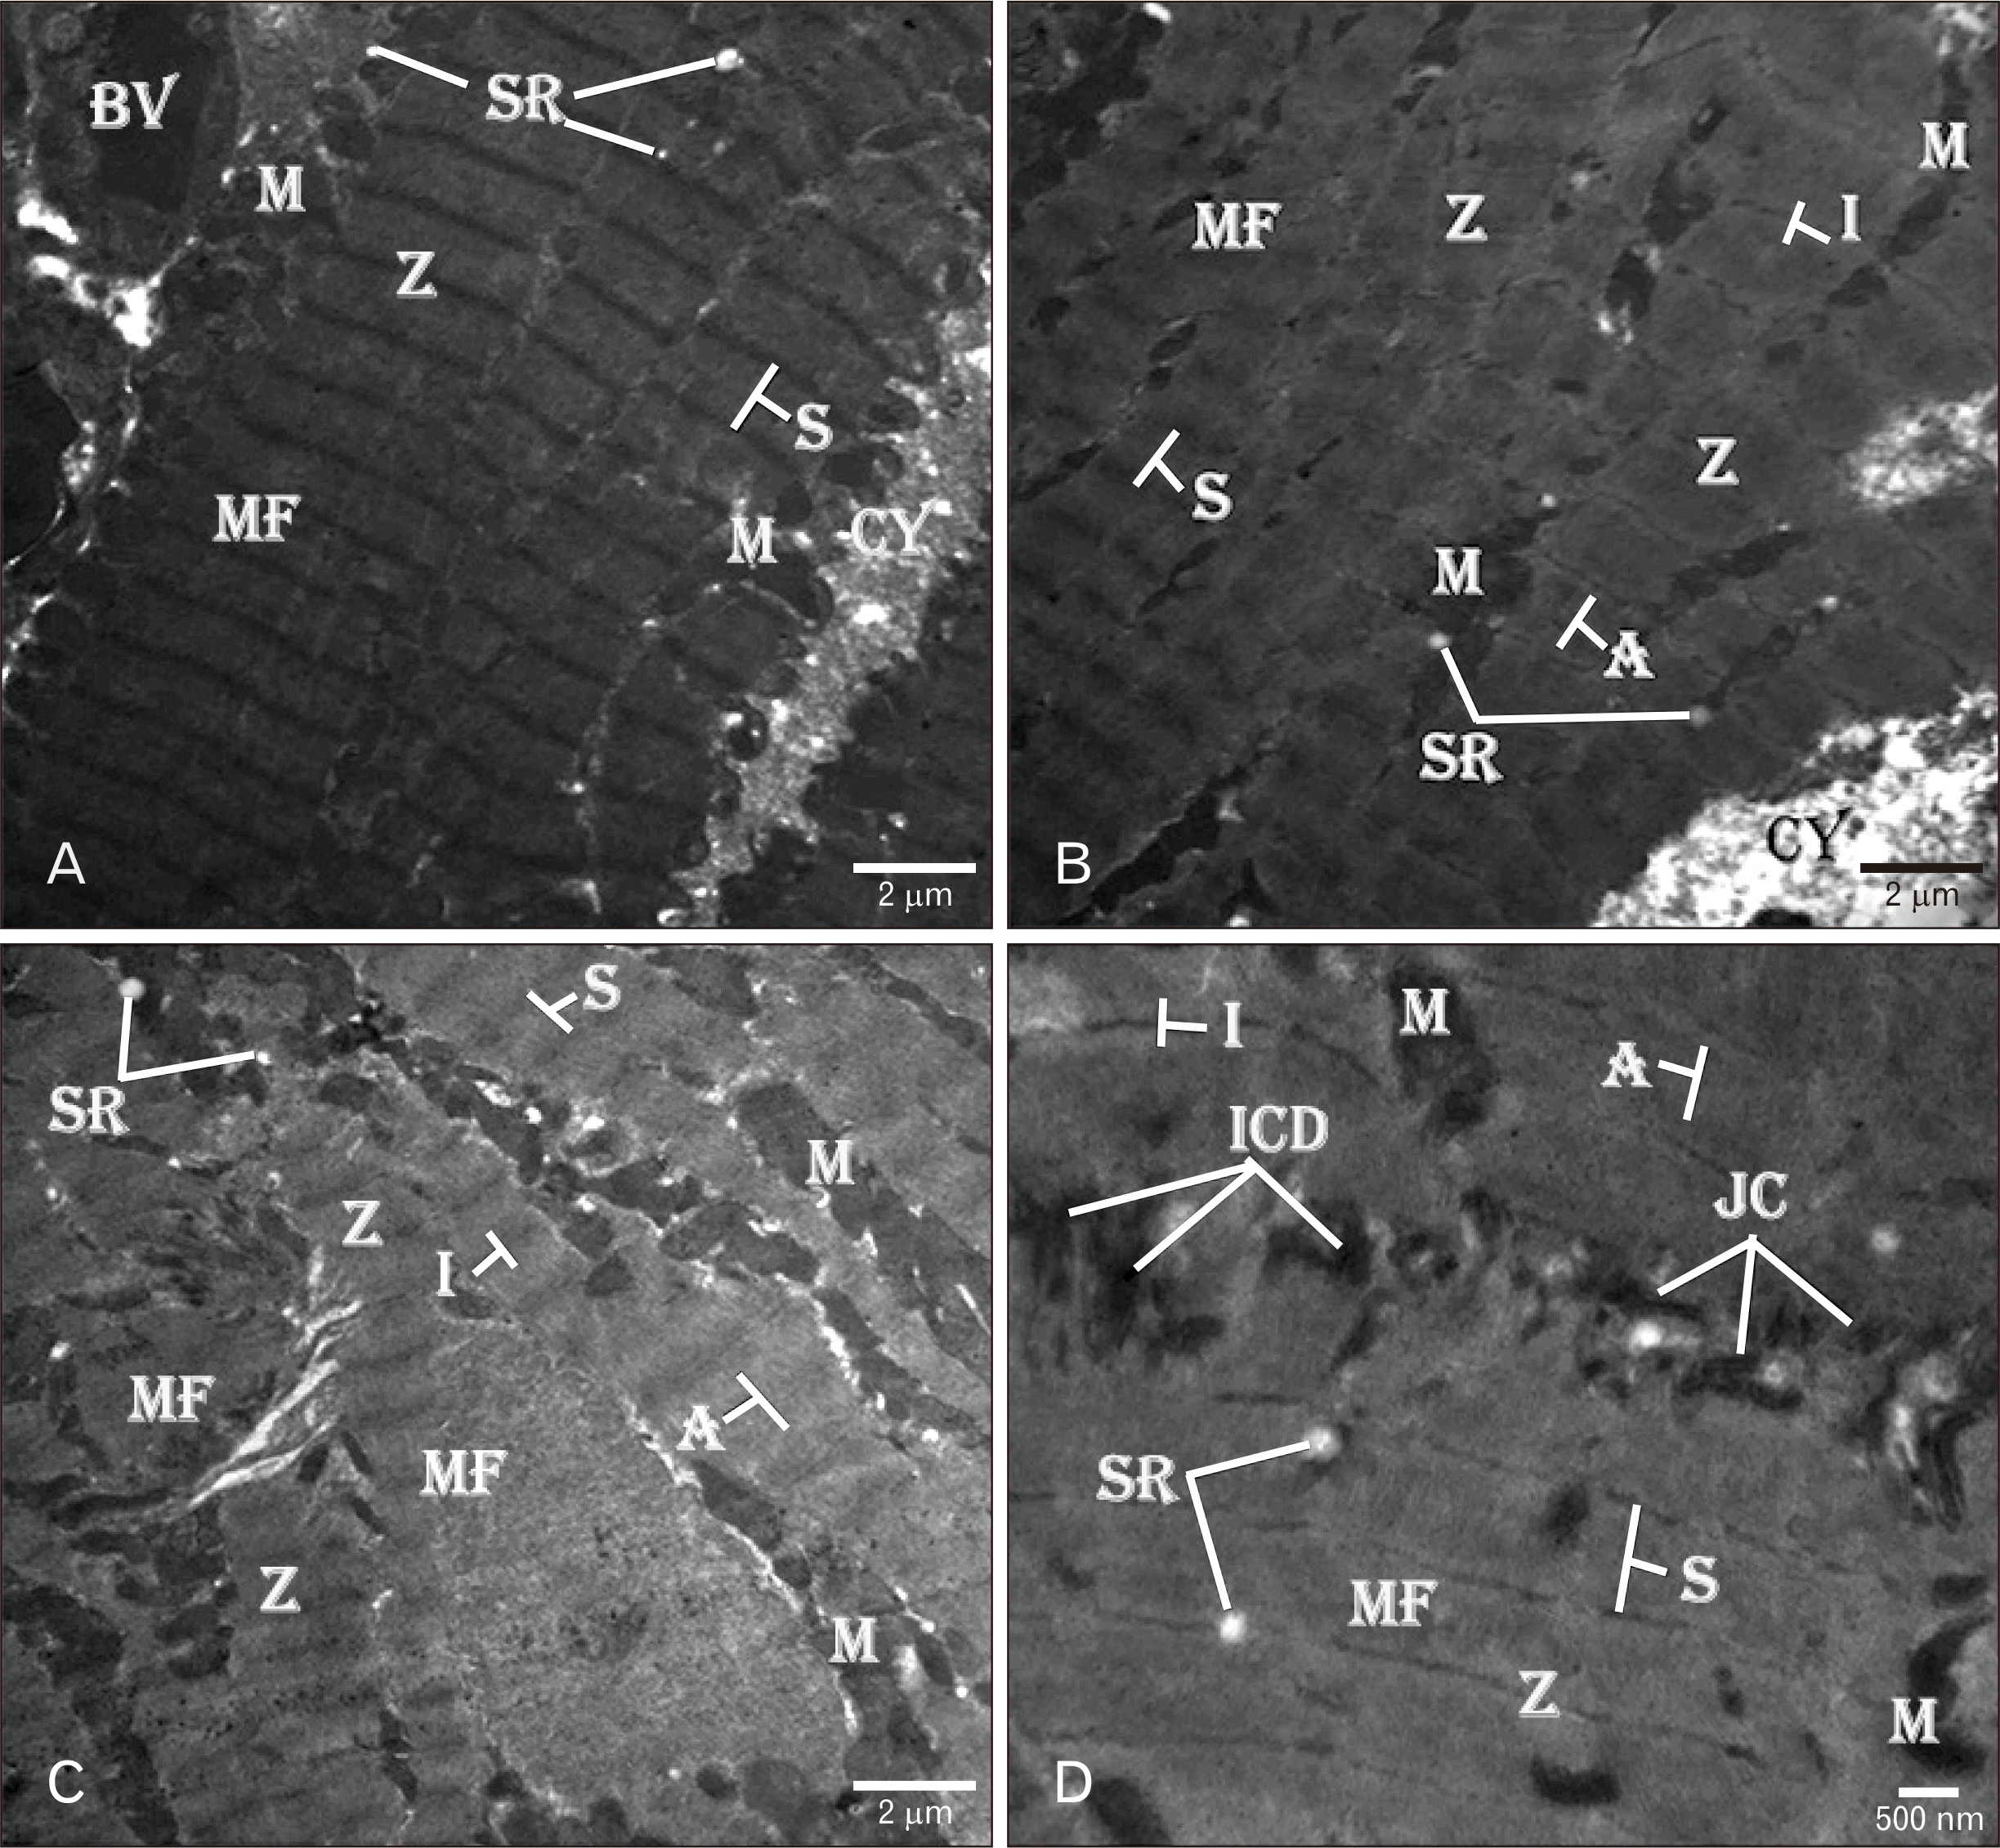 | Fig. 4Electron micrograph of control rat heart showing (A–C) normal organization of branching MF with cross striations. Regular S extends between the two Z. White filament (I-band) surrounds the Z and the dark filaments (A-band) in-between. Columns of M are present between the MF and around the N. Tubular SR is present between the MF near to Z. (D) The ICD is present between two myocytes. The disc consists of different types of JC. TEM osmium tetraoxide-Silver nitrate stains (A–D). Scale bars=2 µm (A–C), 500 nm (D). BV, blood vessels; CY, cytoplasm; ICD, intercalated disc; JC, junctional complexes; M, mitochondria; MF, myofibrils; N, nucleus; S, sarcomere; SR, sarcoplasmic reticulum; Z, Z-line. |
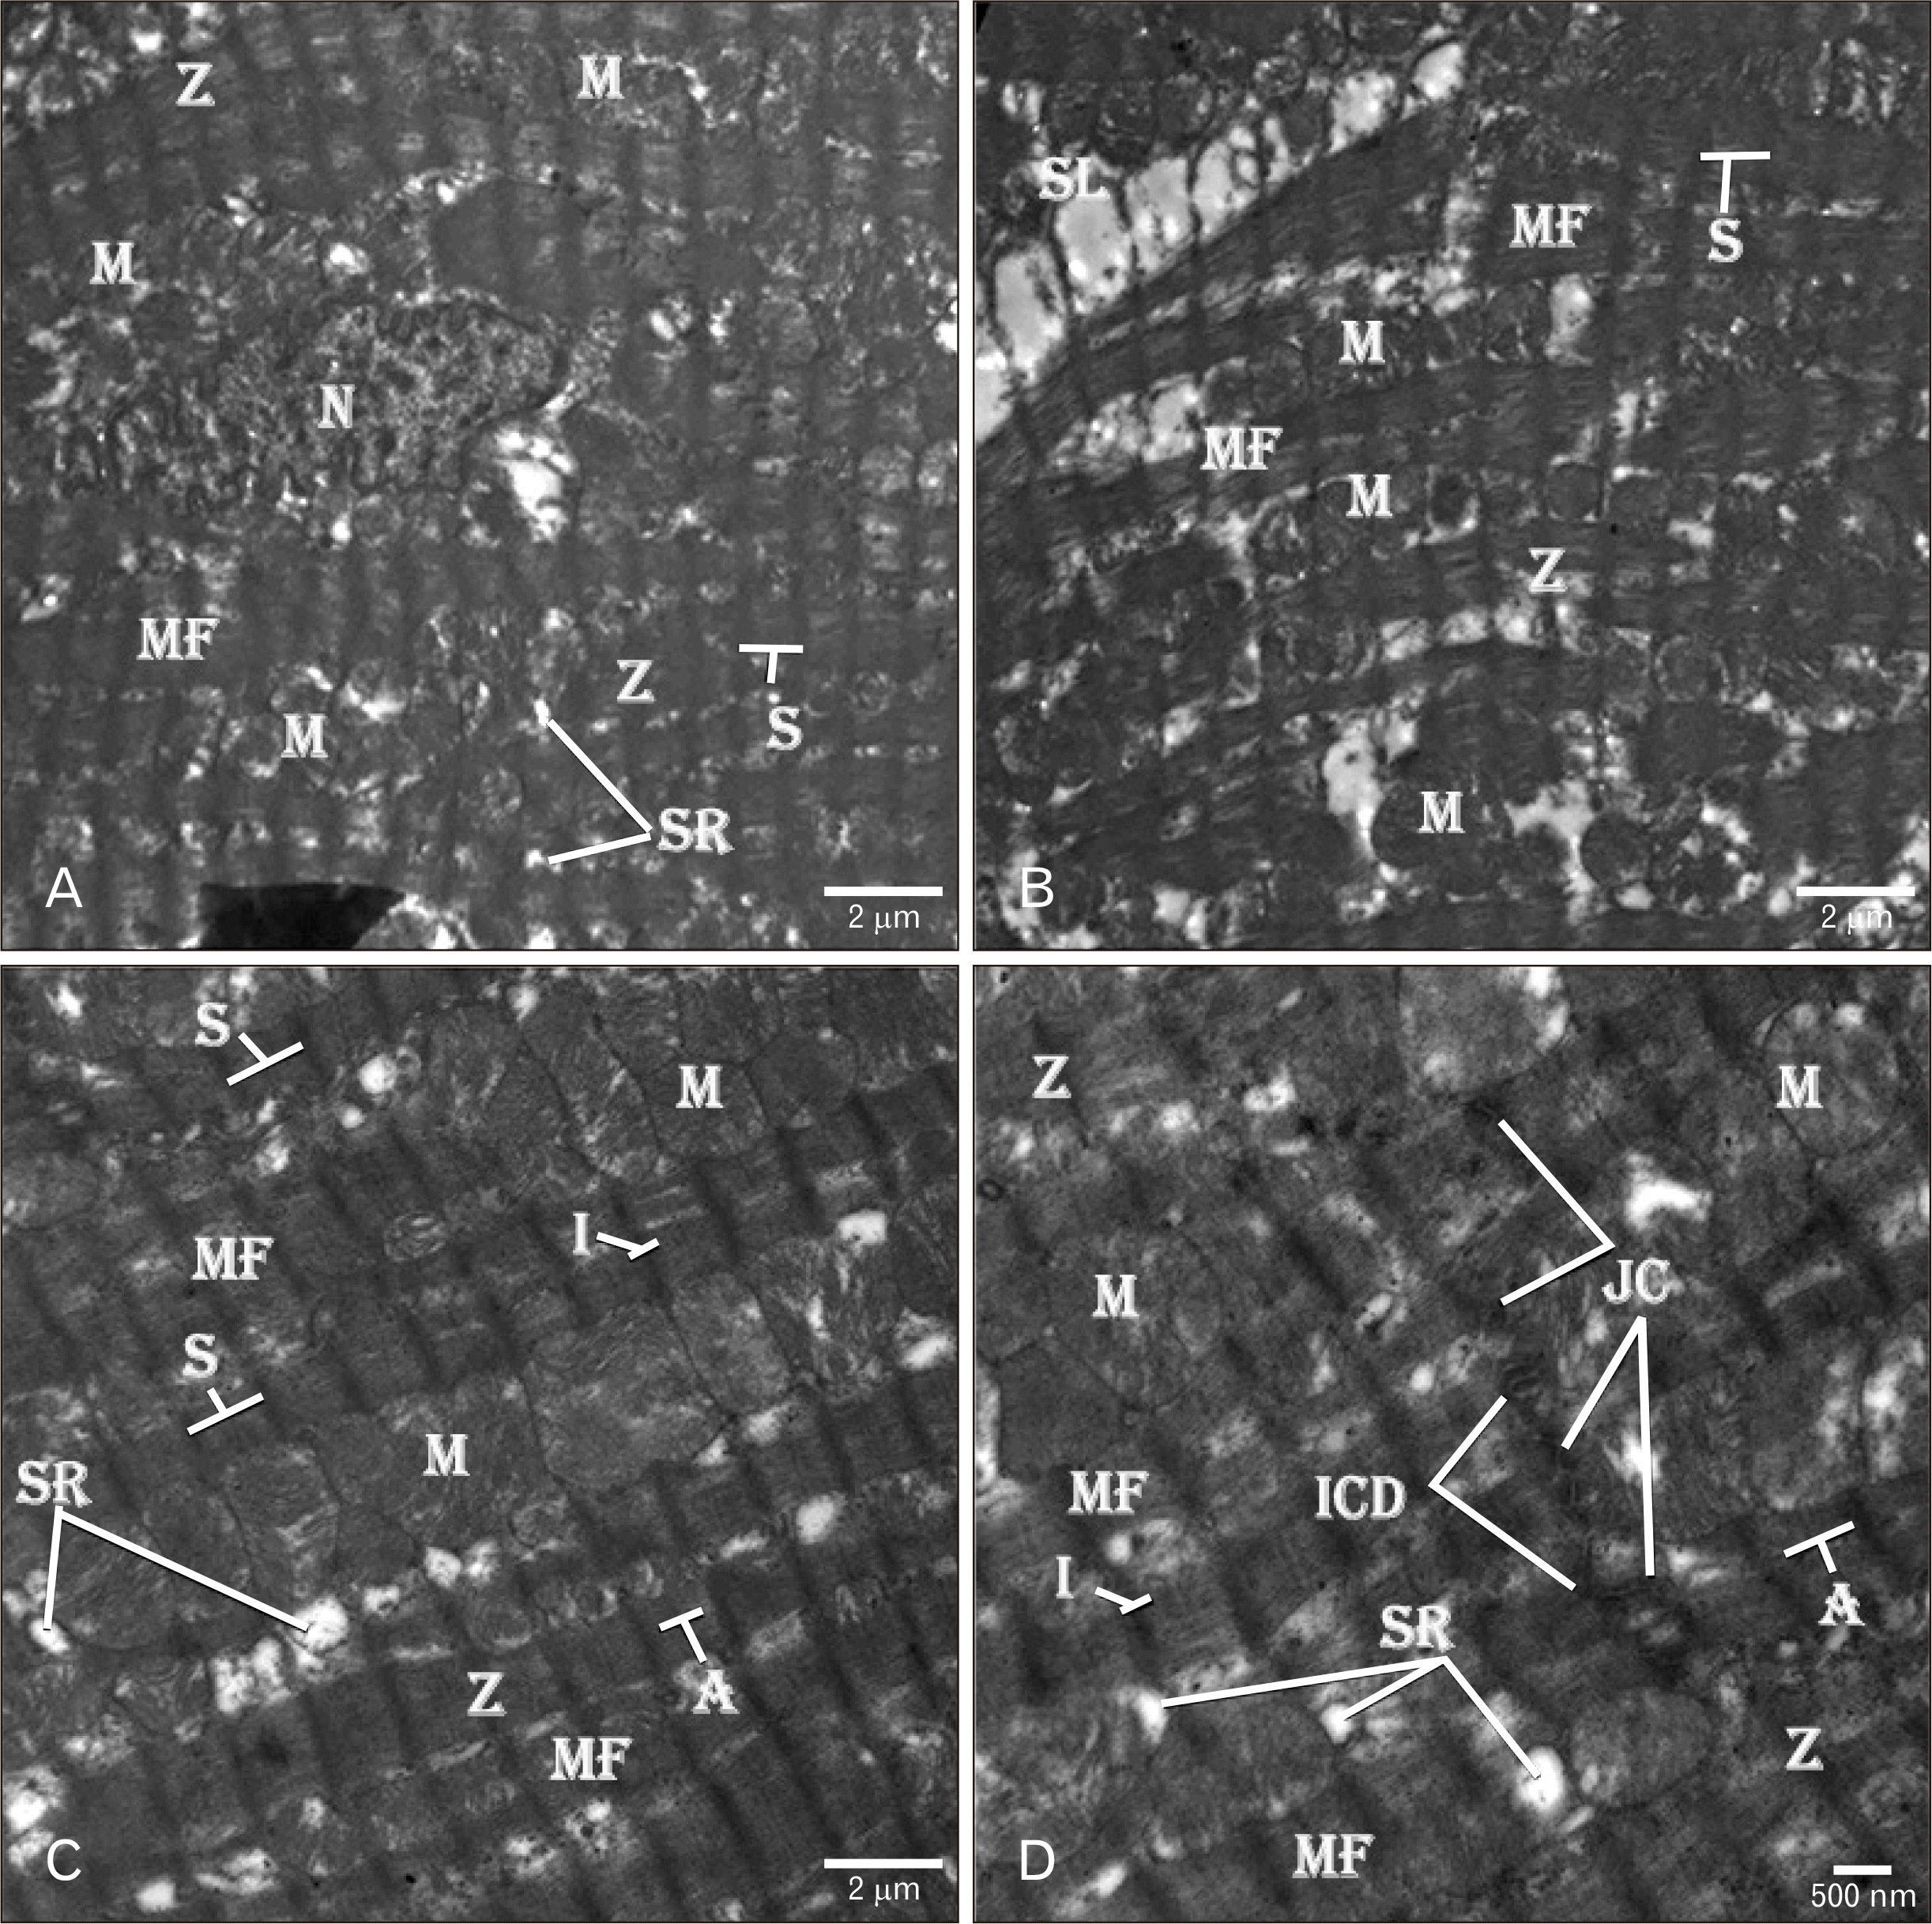 | Fig. 5Electron micrographs of rat heart treated with AGE showing (A–D) normal organization of MF with columns of round M in-between. The MF have cross striations with numerous S between the Z, white filaments (I-band) around the Z and dark filaments (A-band) between the white filaments. The myocyte has a regular SL with subsarcolemmal space (S) underneath. (B) The myocytes have central elongated regular heterochromatic N. Scattered tubular SR is seen between the MF near to the Z. (D) Complex ICD composing of multiple JC are present between the neighboring myocytes. TEM osmium tetraoxide-Silver nitrate stains (A–D). Scale bars=2 µm (A–C), 500 nm (D). AGE, aged garlic extract; ICD, intercalated disc; JC, junctional complexes; M, mitochondria; MF, myofibrils; N, nucleus; S, sarcomere; SL, sarcolemmal membrane; SR, sarcoplasmic reticulum; Z, Z-line. |
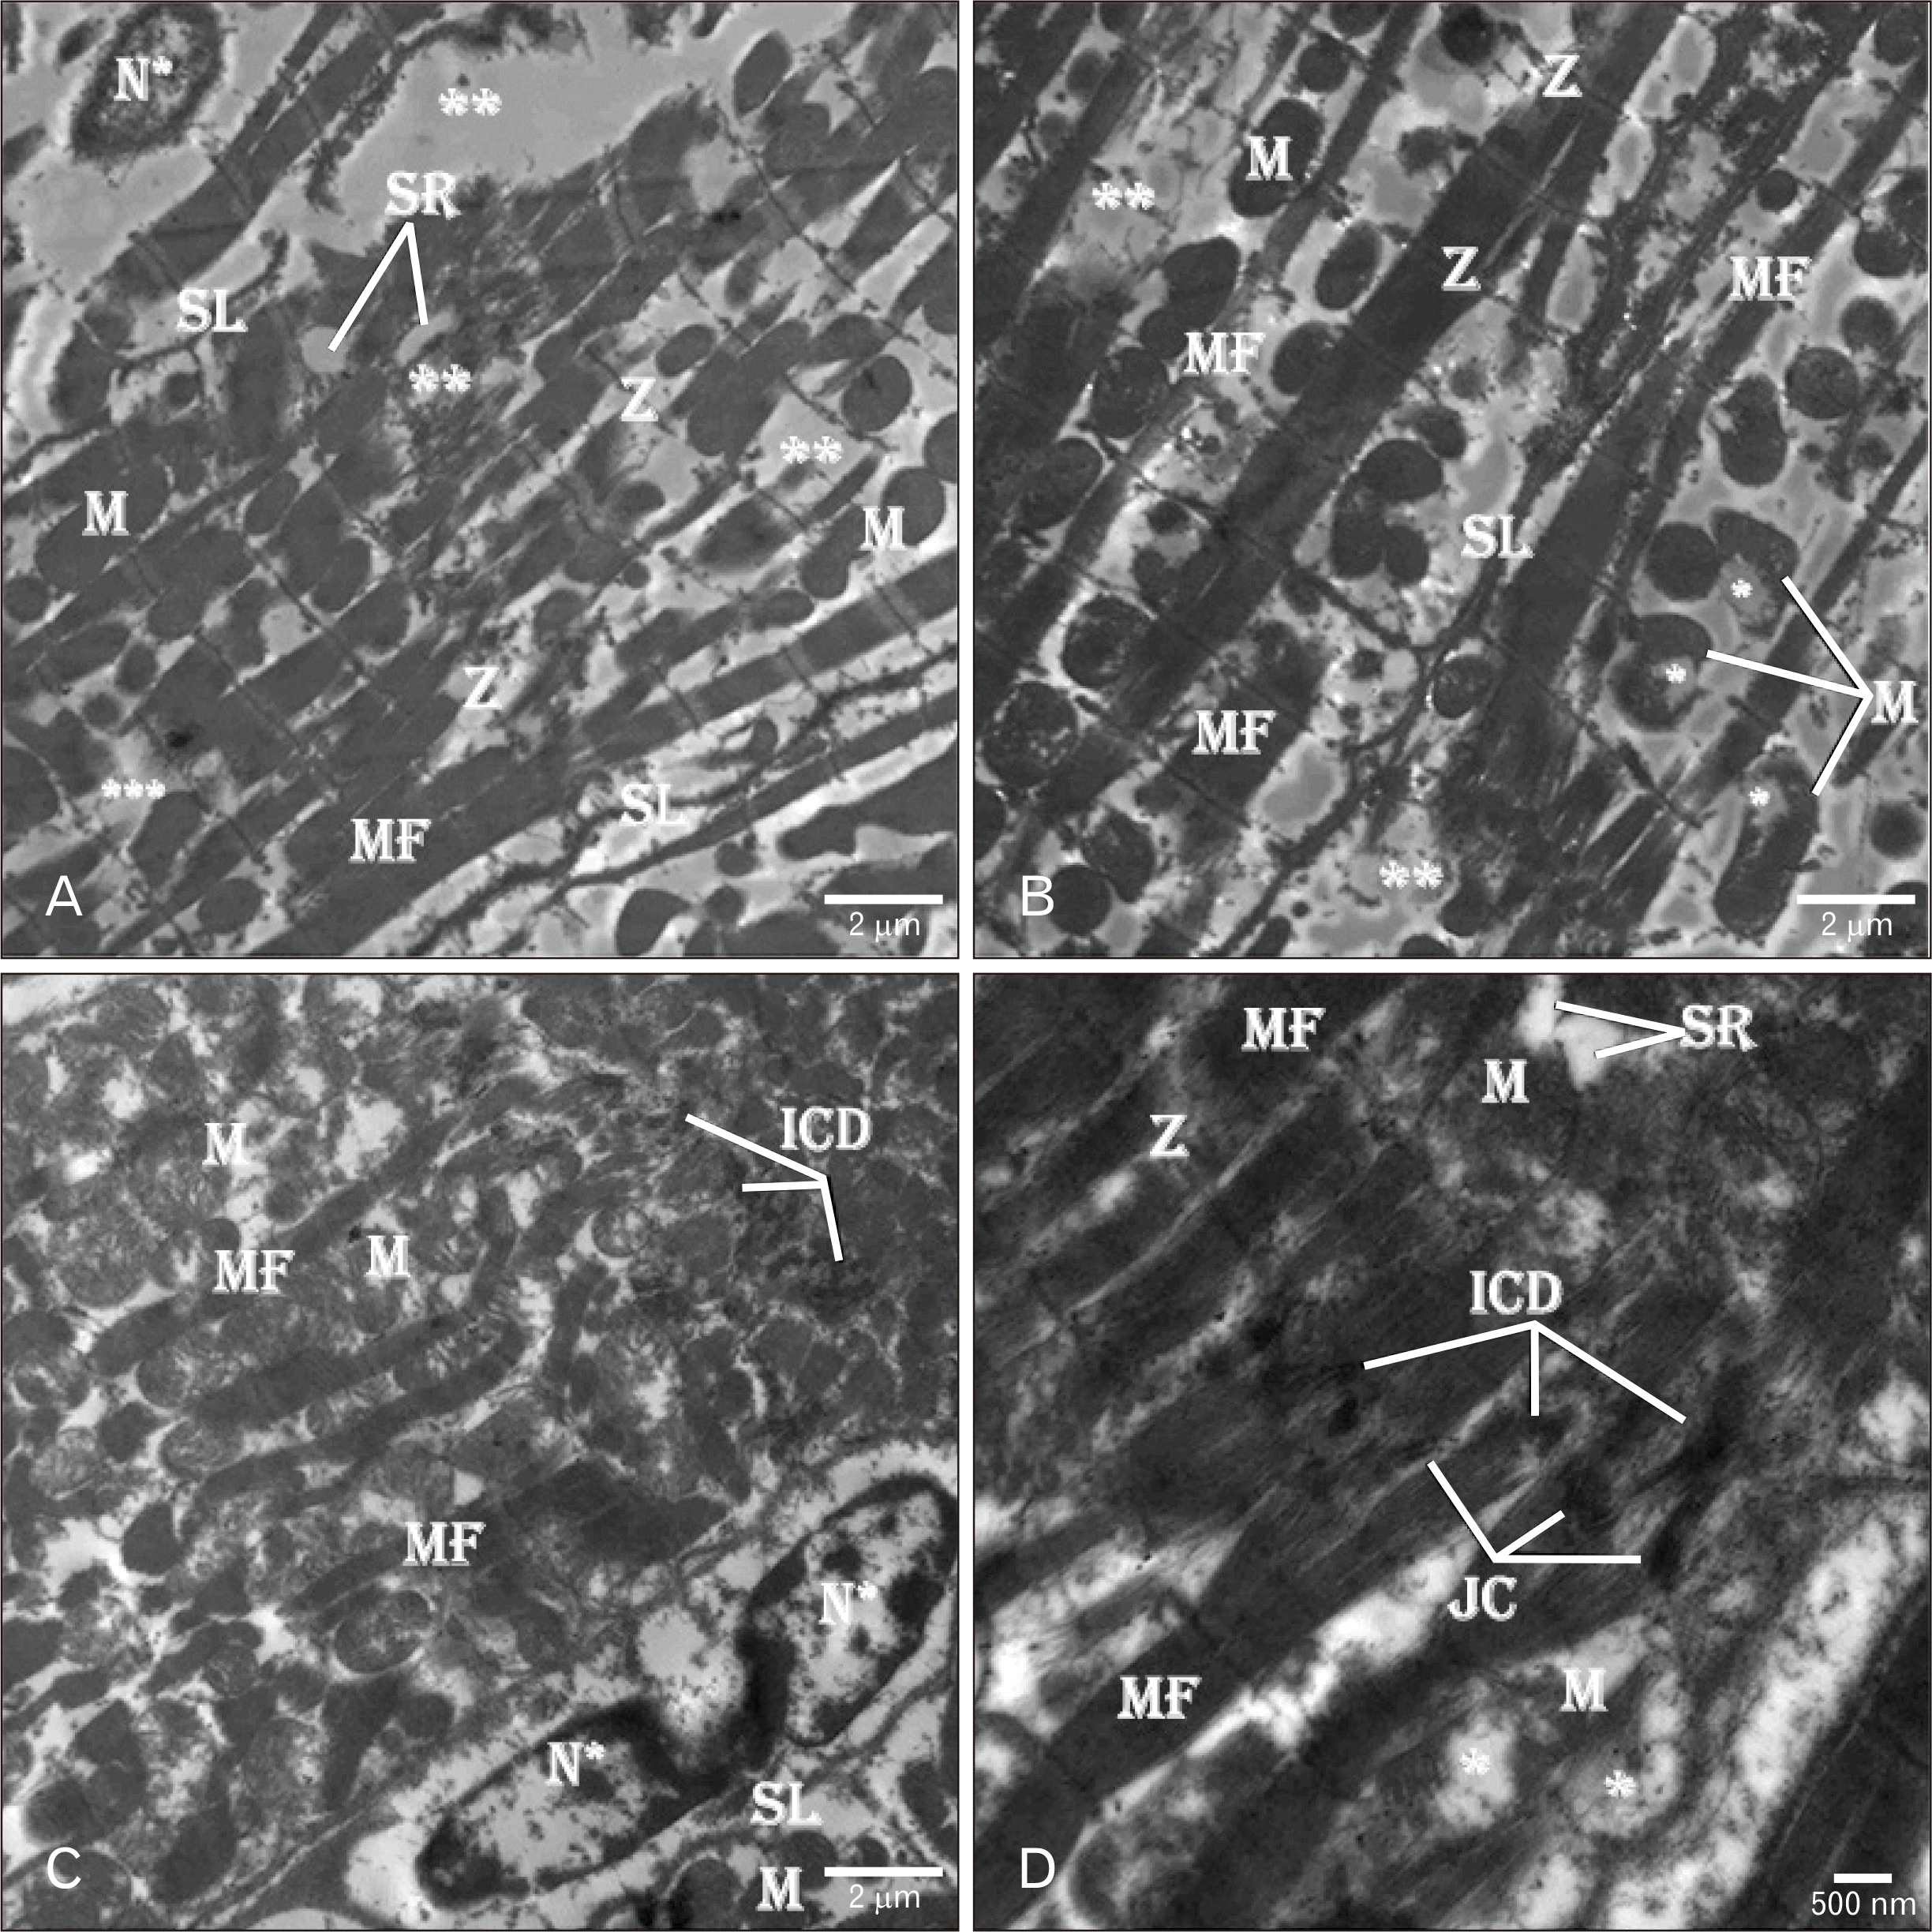 | Fig. 6Electron micrographs of ADR-treated rat heart showing (A–C) marked tissue degeneration and necrosis (**) with MF disorganization. Irregular interrupted Z and SL are seen with cardiac tissue. The myocytes have apoptotic N* with wide electron-lucent perinuclear space. Scattered pleomorphic degenerated M are seen between the atrophic MF. The M show irregular outline, moth-eaten degeneration (*), condensed electron-dense matrix and loss of their cristae. Irregular discontinuing SL is seen limiting the myocytes. (C) Segmented apoptotic N* with peripheral condensed heterochromatin is seen within the myocyte. (C, D) Fragmented ICD composed of loose JC are seen between the myocytes. (D) Short contracted MF and degenerated (*) M are present between the myocytes. TEM osmium tetraoxide-Silver nitrate stains (A–D). Scale bars=2 µm (A–C), 500 nm (D). ADR, adriamycin; ICD, intercalated disc; JC, junctional complexes; M, mitochondria; MF, myofibrils; N, nucleus; SL, sarcolemmal membrane; SR, sarcoplasmic reticulum; Z, Z-line. |
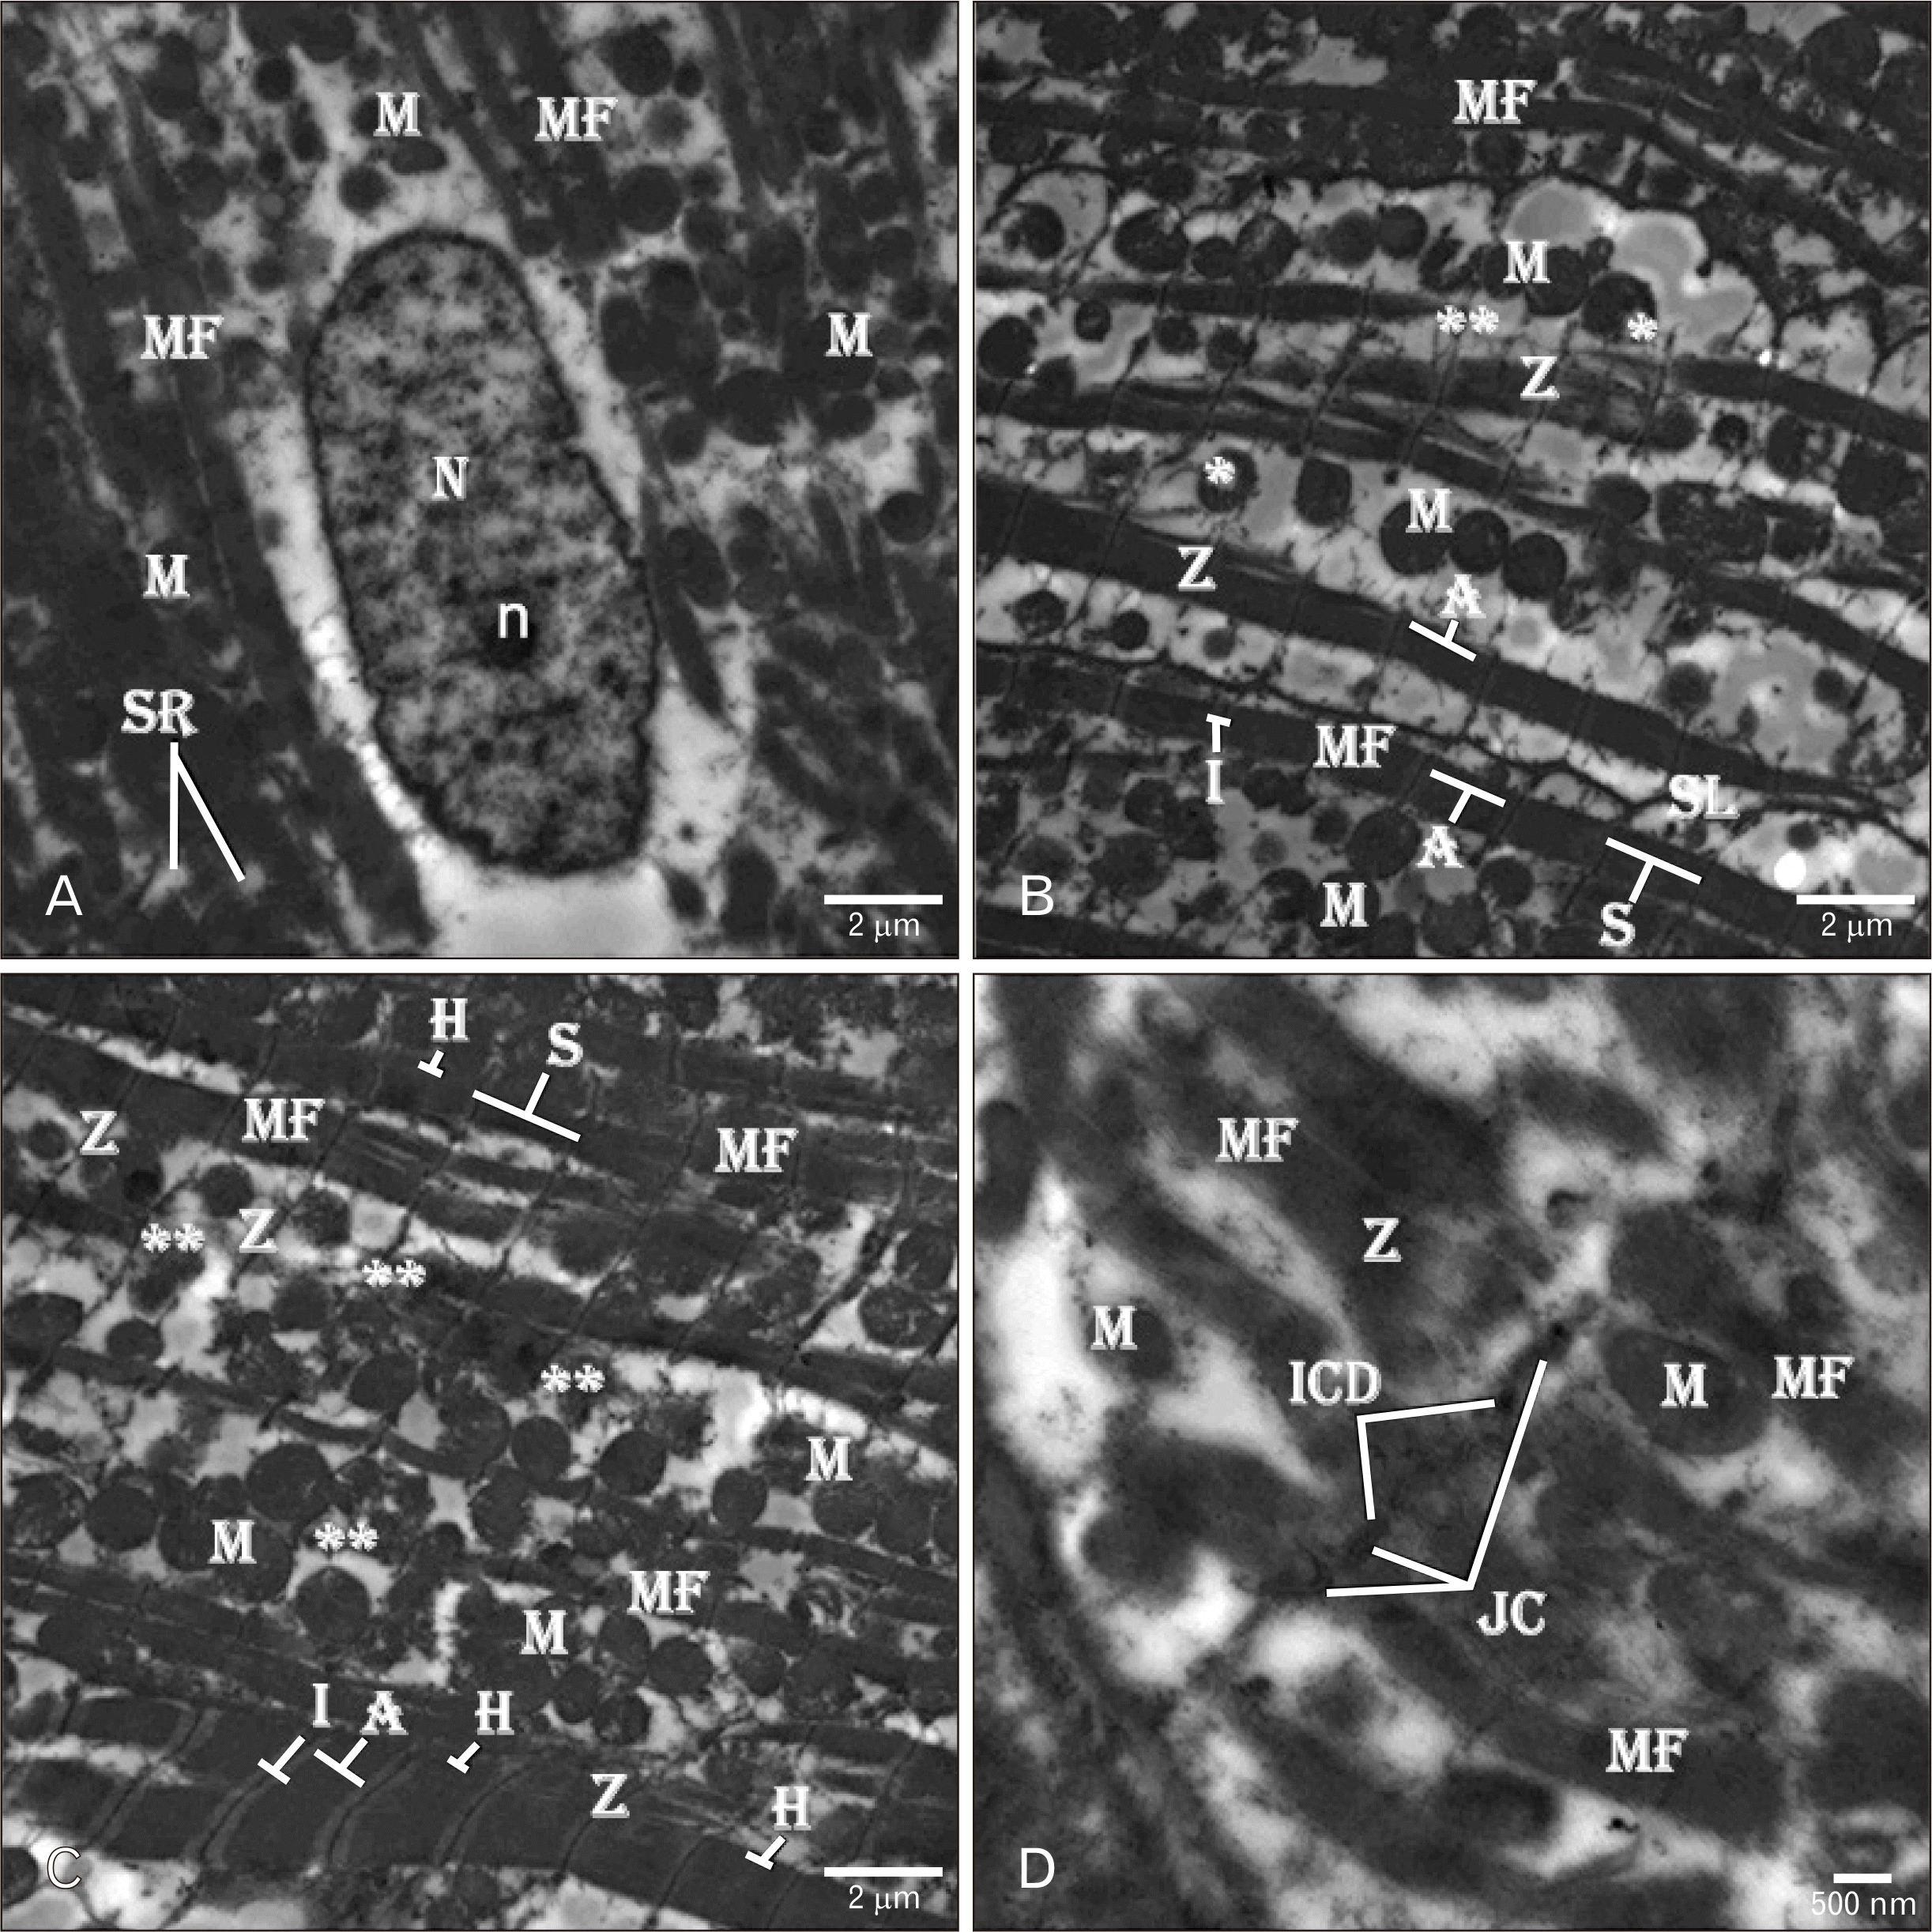 | Fig. 7Electron micrographs of the rats’ hearts treated with AGE for one week before ADR injection (AGE pre-treated group) showing (A–C) organized MF with cross striations, well-formed Z, white (I-band) and dark (A-band and H-band) filaments. Symbol * represent the moth-eaten degenerated mitochondria. Scattered area of tissue necrosis (**) is present within the cardiac tissue. Many degenerated M with loss of its cristae are seen between the MF. (A) The myocyte exhibits regular central oblong heterochromatic N with electron-dense n and intended nuclear envelope. (D) An ICD with loose JC is seen between the myocytes. Contracted short myofilaments (MF) are seen around the ICD. TEM osmium tetraoxide-Silver nitrate stains (A–D). Scale bars=2 µm (A–C), 500 nm (D). ADR, adriamycin; AGE, aged garlic extract; ICD, intercalated disc; M, mitochondria; MF, myofibrils; N, nucleus; n, nucleolus; SR, sarcoplasmic reticulum; Z, Z-line. |
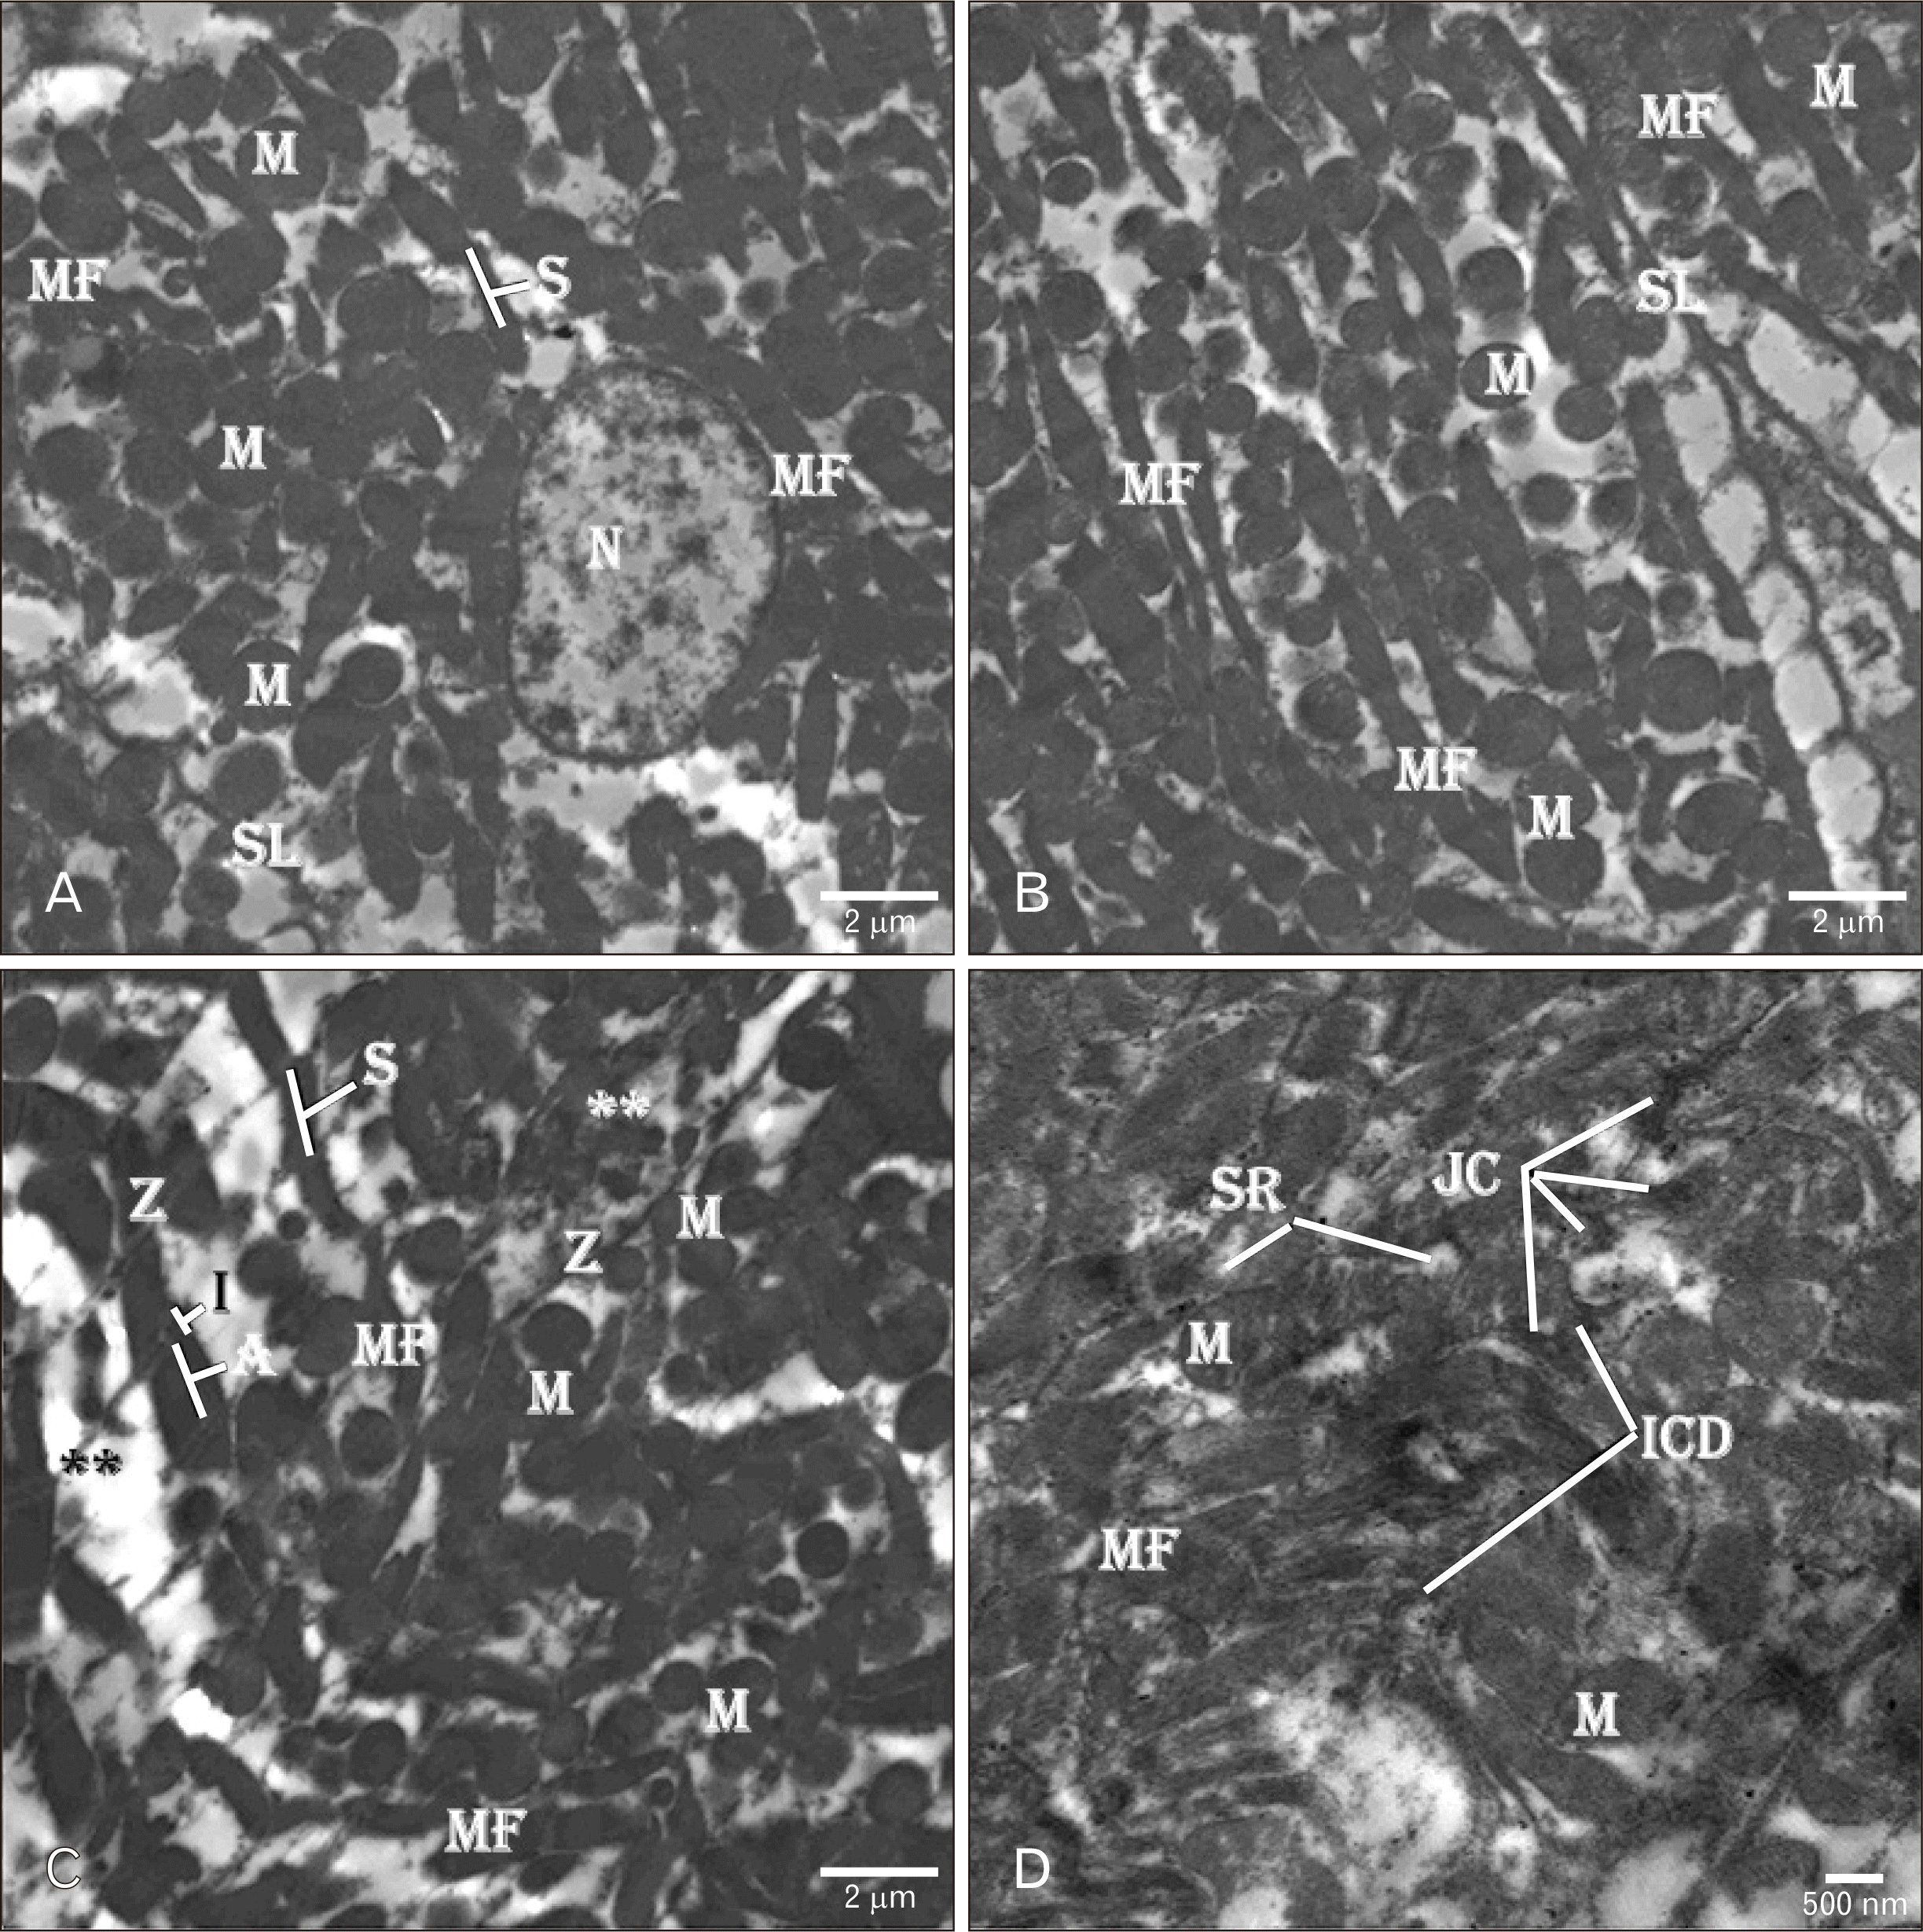 | Fig. 8Electron micrographs of the rats’ hearts treated with AGE for one week after ADR injection (AGE post-treated group) showing (A–C) organized branching MF with columns of compact M in-between. The S are present between the regular Z with white filaments (I-band) around and dark filaments (A-band) in-between. H-bands are present at the centre of the dark filaments (A-band). (B) Regular elongated heterochromatic N with wide electron-lucent perinuclear space. Few degenerated M with loss transverse cristae are observed between the MF. (C) Area of myocardium degeneration (**). (D) An ICD consisting of multiple JC is present between the neighboring myocytes. TEM osmium tetraoxide-Silver nitrate stains (A–D). Scale bars=2 µm (A–C), 500 nm (D). ADR, adriamycin; AGE, aged garlic extract; ICD, intercalated disc; JC, junctional complexes; M, mitochondria; MF, myofibrils; N, nucleus; S, sarcomere; SL, sarcolemmal membrane; SR, sarcoplasmic reticulum; Z, Z-line. |
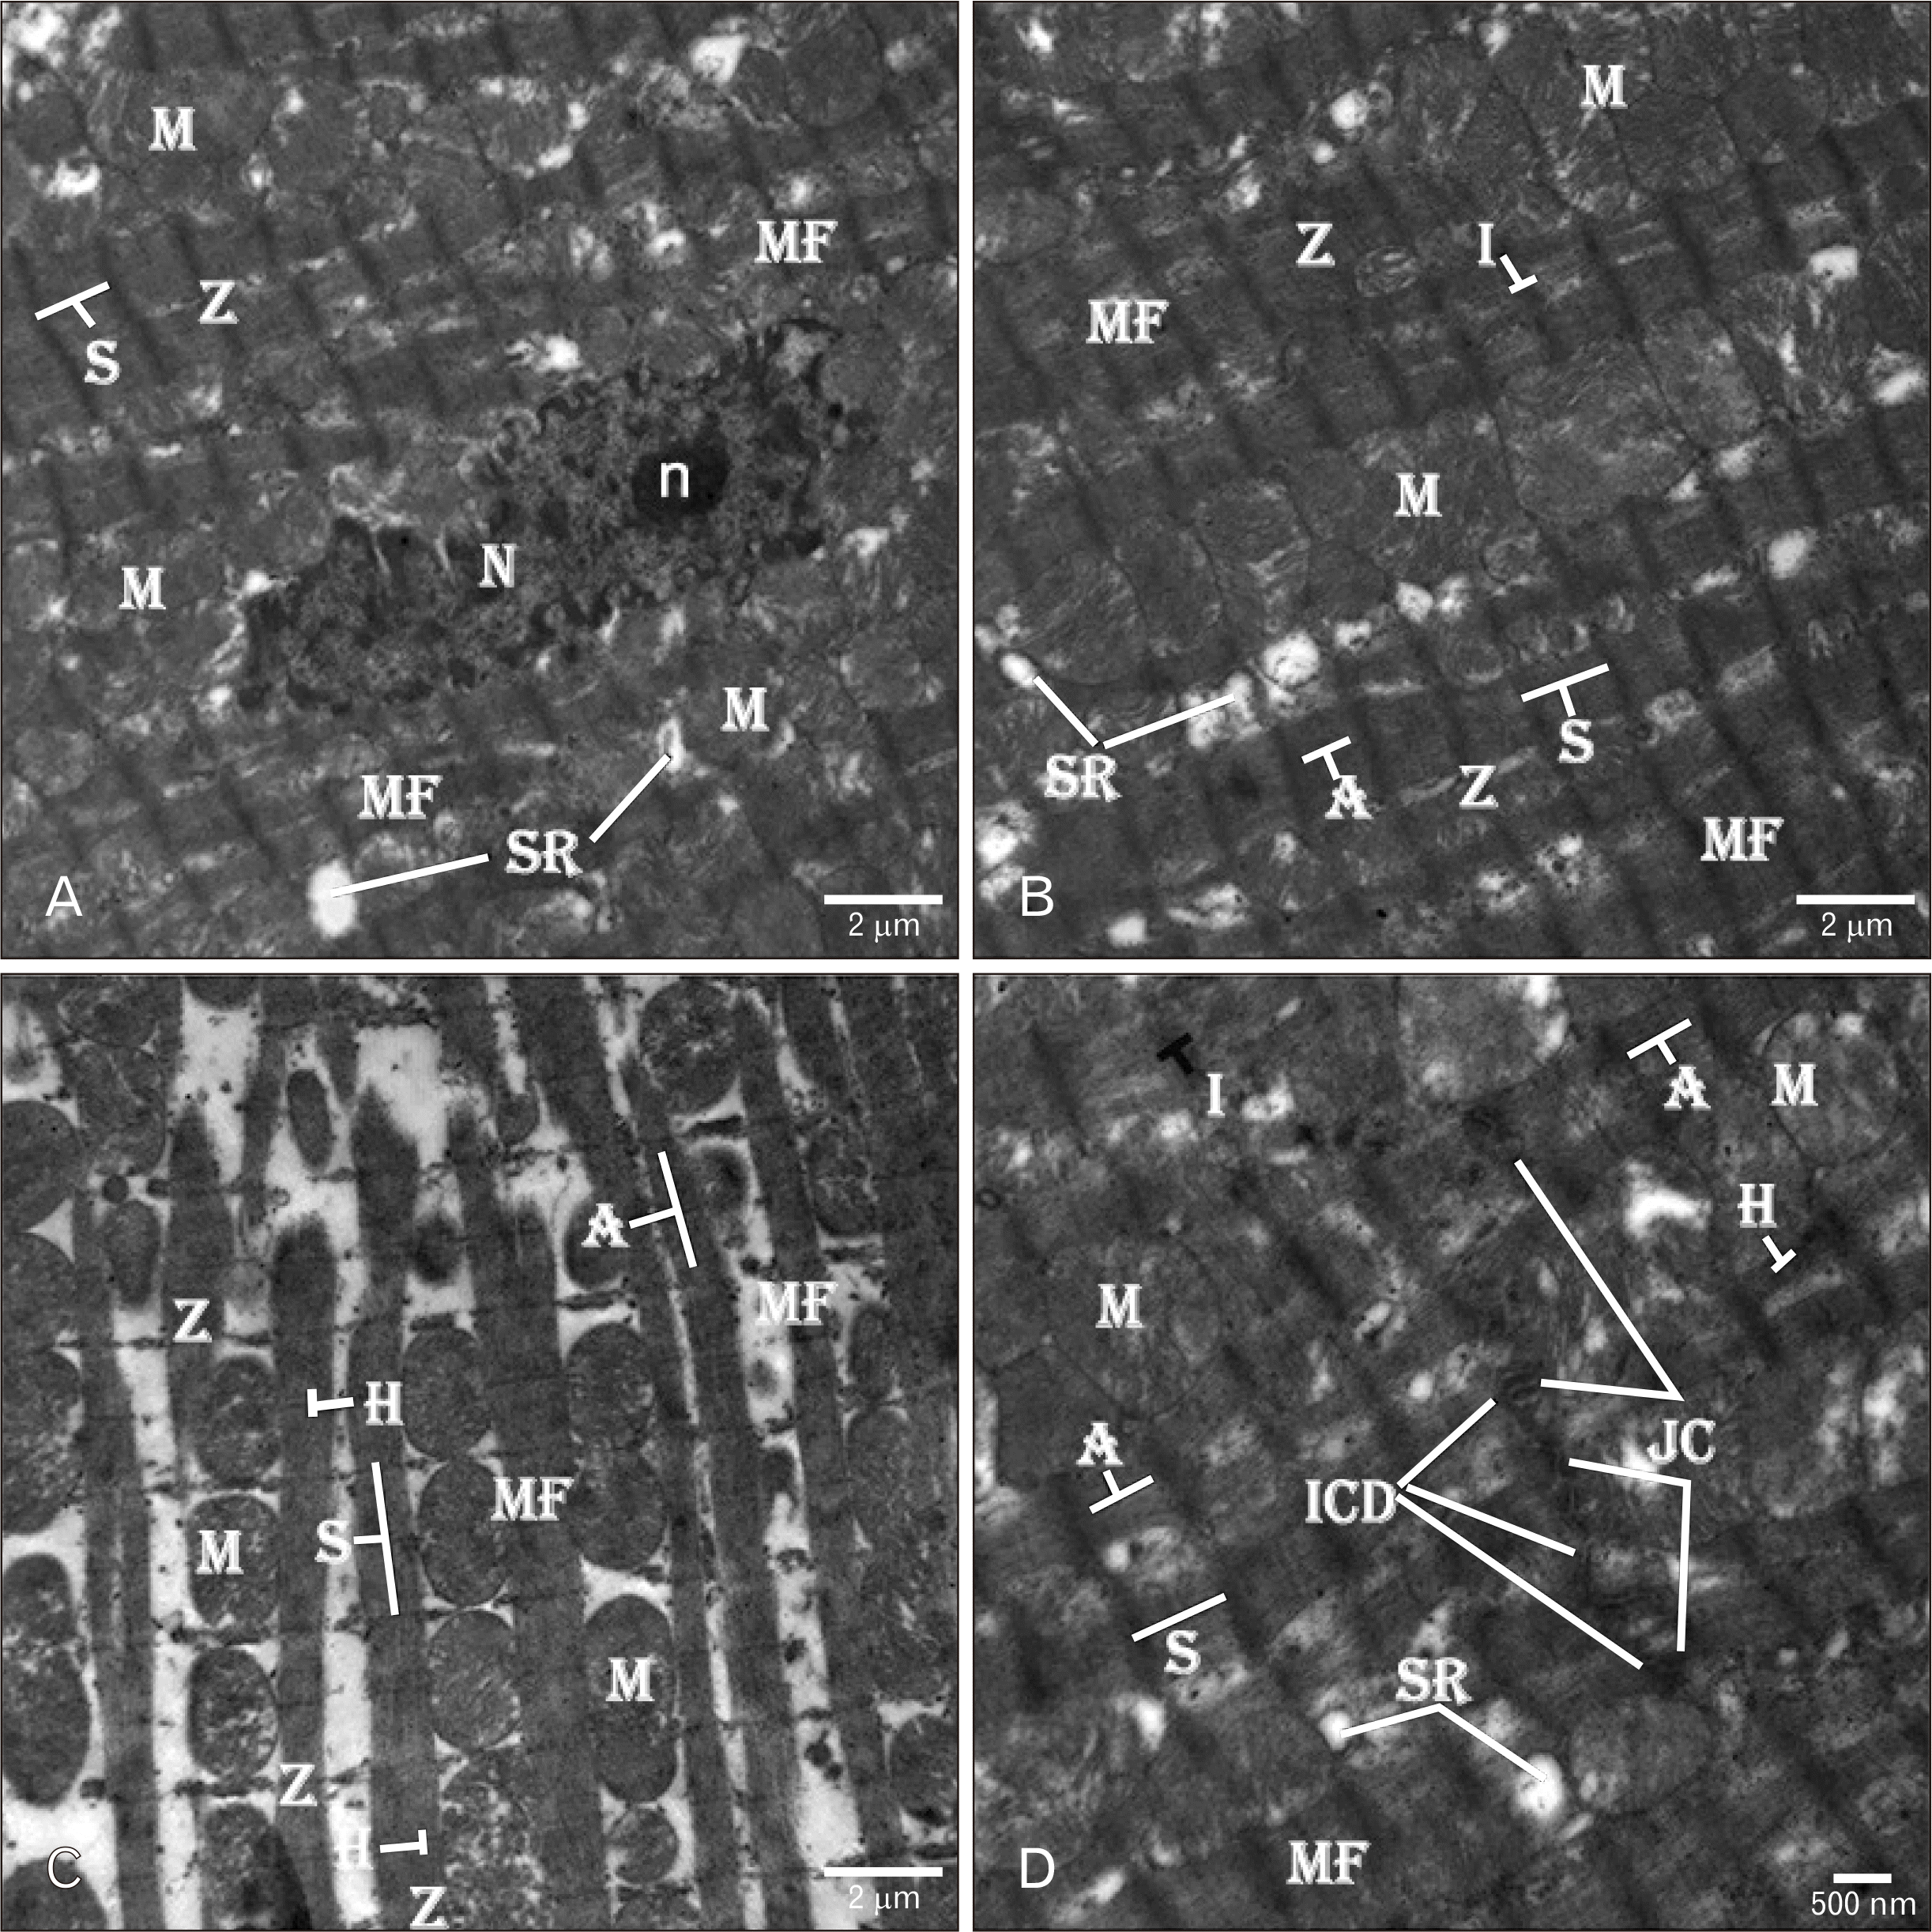 | Fig. 9Electron micrographs of the rats’ hearts treated with AGE for one week before and one week after ADR injection (combined AGE pre- and post-treated group) showing (A–D) normal well-organized MF having transverse striations and columns of large-sized regular normal M. The MF have normal white (I-band) and dark (A-band and A-band) filaments. Scattered tubular SR is seen between the MF near to the regular Z. (B) The myocytes have central elongated heterochromatic N with electron-dense small n within its nucleoplasm and an intended regular nuclear envelope. The N is surrounded by groups of rounded-shape normal M and tubular SR. (D) Well-formed ICD with different types of the JC are seen between the adjacent myocytes. The ICD are surrounded by well-organized normal MF with light (I-band) and dark (A-band and H-band) filaments. TEM osmium tetraoxide-Silver nitrate stains (A–D). Scale bars=2 µm (A–C), 500 nm (D). ADR, adriamycin; AGE, aged garlic extract; ICD, intercalated disc; JC, junctional complexes; M, mitochondria; MF, myofibrils; N, nucleus; n, nucleolus; S, sarcomere; SR, sarcoplasmic reticulum; Z, Z-line. |


 PDF
PDF Citation
 Print
Print


 XML Download