

 PDF
PDF Citation
 Print
Print


INTRODUCTION
Electroencephalography (EEG) produces time-series data of the electrical field generated by neuronal activities within the brain.1 Since synaptic activity is the main source of extracellular current flow, the summated excitatory and inhibitory postsynaptic potentials of cortical pyramidal neurons are the main contributors to the field potentials measured by EEG.2 The field potentials recorded using EEG exhibit oscillations that reflect rhythmic fluctuations in the excitability of neurons. The frequency of neural oscillations typically ranges from 0.05 Hz to 500 Hz,3 and the physiological mechanisms and functional implications underlying these oscillations vary with the frequency band.4 The EEG power spectral density reflects the distribution of energy in different frequency bands. Spectral analysis can be used to determine whether neural oscillations within a certain frequency range are associated with particular cognitive processes or brain dysfunction.5
Communication within the brain network requires neuronal synchronization or functional connectivity, which refers to the statistical interdependency between neural oscillations over time.6 The concept of the brain as a complex network has been fundamental to understanding normal brain functions as well as the pathophysiologies underlying various neurological disorders.7 In this paper, we first discuss the methodology for EEG analysis, and then review previous EEG studies of neurological disorders, with a focus on the characterization of brain networks.
Go to : 
METHODS
EEG preprocessing
EEG recordings are frequently contaminated with physiological and nonphysiological artifacts. The physiological artifacts include electrical potentials generated by biological activities, which are largely generated by eye movements, muscle and cardiac activities, and sweat. The nonphysiological artifacts can originate from anywhere near the EEG recording system, such as the electrode-scalp interface, devices, and adjacent environment. Identifying discriminative features by analyzing the EEG signals requires the artifacts to be removed. Below we introduce some techniques for cleaning EEG signals that can remove these artifacts.
Filtering
Unfiltered EEG signals are usually contaminated with artifacts such as 60-Hz line noise, muscle activities, background noise, and very-low-frequency noise. These contaminants tend to predominate within specific frequency bands, and so they can be effectively reduced by applying appropriate band-pass filtering.
The bandwidths of filters applied to EEG signals need to reflect the artifact-specific frequency ranges. For example, highpass filters (e.g., >0.1 Hz) are applied to remove low-frequency drifts, while lowpass filters (e.g., <50 Hz) are applied to remove high-frequency noise such as that due to muscle activity. A notch filter is commonly used to eliminate power line noise, since is only present within a very narrow frequency band. In addition to the frequency bands of artifacts, the frequency range of the signals of interest should be considered when selecting the filters, such as slow oscillations (0.3-1 Hz) in non-REM (rapid eye movement) sleep and high-frequency oscillations (>80 Hz) in epilepsy.
Reject of bad EEG segments
Bad EEG segments are those that are extremely contaminated with artifacts in the entire channel, and they should be removed from the raw EEG signals. For example, excessive electromyography bursts that are widely spread over 20 Hz and instantaneous popping bursts with relatively large amplitudes around the forehead, ears, and neck are considered as bad segments. The common approach to remove bad segments is the manual inspection of individual segments by well-trained experts. Another common approach is to use automatic rejection criteria, such as when the peak-to-peak amplitude exceeds a certain threshold.
Independent components analysis for artifact removal
Independent components analysis (ICA) is a source-separation technique that attempts to identify independent sources of variance.8,9 Applying ICA to multichannel EEG data involves breaking down the EEG time-series data into a set of independent components (ICs), which include brain, eye, cardiac, and muscle activities. Artifacts can be rejected with minimal loss of the actual brain activity by subtracting artifact-related ICs from EEG signals.10,11 Artifact-related ICs can be identified based on their topographic characteristics, across-trial temporal distributions, and frequency distributions. Artifact-embedded ICs can be distinguished from brain-related ICs either manually or automatically. After artifact-embedded ICs have been removed, the remaining ICs are reorganized into artifact-removed EEG data.
Spectral analysis
A frequency-domain analysis is important for characterizing specific rhythmic or oscillating patterns of neural activity. Spectral density estimations can quantify brain oscillations in the form of the signal power or energy distribution across frequency. The Fourier transform is used to identify the frequency components in a temporal signal. Welch’s method is the most-popular method for estimating the spectral density in EEG analysis.12 This method first divides the signal of N samples into K data segments of length M overlapping by D points. The periodogram of each segment is then calculated by computing the discrete Fourier transform. Finally, the spectral density is estimated by averaging the periodograms of all segments.
Some aspects need to be considered when applying Welch’s method to EEG data. The EEG segments should be long enough to provide the required frequency resolution. The appropriate length of the overlapping samples, which subsequently influences K and the variance of the spectral estimate, should also be considered. Choosing the appropriate window function is crucial for optimizing spectral estimation. A rectangular window provides the best ability to resolve adjacent sinusoids (i.e., high resolution), but its wideness might mask important details even at lower levels (i.e., low dynamic range). Nonrectangular windows such as the Hamming and Hann windows can redistribute the spectral leakage to places where it causes the least harm (i.e., high dynamic range), at the expense of increasing this leakage in the vicinity of the original component (i.e., low resolution).
Connectivity analysis
One of the most-informative features of EEG data is the functional connectivity underlying the interregional neural interactions in the brain. EEG connectivity analysis can provide important evidence of functional interactions between the neural systems operating in each frequency band. Below we introduce several promising connectivity measures used in EEG data analysis.
Coherence
A coherence analysis can assess the linear relationship between two time series within each frequency bin.13 Assume that X(t) and Y(t) represent the EEG signals measured by electrodes X and Y, respectively. Time-domain signals X(t) and Y(t) are first converted into the frequency domain using the fast Fourier transform or wavelet transform. For each frequency bin f, the individual spectral power density Sxx(f) and Syy(f) and their cross-spectrum power density Sxy(f) are then estimated. Coherency function Kxy(f) is calculated as the ratio between the cross-spectrum power density and the individual spectral power density of the two signals:
Finally, the coherence in frequency bin f is computed as
The coherence value ranges from 0 to 1, where a value of 0 indicates no linear dependence between X(t) and Y(t) at frequency f, and a higher coherence value indicates the presence of greater statistical dependence between the two signals.
Coherence has been widely used in EEG connectivity studies, but it has some limitations: 1) it can only assess the linear dependence between two signals, and hence any nonlinearity in the relationship is ignored, 2) it is significantly influenced by the signal amplitudes, and 3) it cannot dissociate volume conduction from true interactions between the brain regions.
Phase-locking value
Phase-synchronization-based measures utilize the phase components of EEG signals within a given frequency band. If two oscillatory activities are synchronized with a constant phase difference, it can be assumed that phase synchronization exists. Among the various connectivity methods, the phase-locking value (PLV) is the most commonly used measure of phase synchronization.14,15 To analyze the PLV, bandpass filtering is applied to transform EEG signals into narrowband signals within specific frequency bands. The instantaneous phase at each time point is calculated from the narrowband signal and its Hilbert transform as follows:
To quantify the degree of phase synchronization, the PLV between two electrodes j and k is calculated for each time point t by averaging the phase difference over N segments as follows:
Where N represents the total number of segments, n denotes a specific segment, and ϕj denotes the phase of signals of electrode j at time t of the nth segment. It is then determined whether the PLVs between two specific electrodes indicate the presence of significant phase synchronization. This involves checking whether the PLV change under investigation is meaningful with respect to the PLVs of surrogate data (obtained by randomly shuffling the segments). The level of significance is determined using the distribution of the PLVs calculated from the surrogate data.14,15 The significance cutoff is generally set at 1%, which means that the phase synchronization is significantly increased if it is higher than the first percentile of the PLV values from surrogate data.
Weighted phase-lag index
Long-range phase synchronizations between EEG signals can be calculated using the weighted phase-lag index (wPLI), which is based on the imaginary component of the cross-spectrum between a pair of EEG signals and is known to be minimally affected by volume conduction.16 A shorttime Fourier transform is used to extract the instantaneous phase perturbation of the oscillations in EEG signals. The cross-spectrum between EEGs from electrodes i and j (designated as Xi,j) is calculated using the extracted complex-valued Fourier spectra vector Z as follows:
The wPLI between two electrodes is calculated as follows:
where J{Xi,j}is the imaginary part of cross-spectrum X between signals i and j, and sgn(∙) denotes the sign function. wPLI ranges from 0 to 1, where 0 indicates no coupling and 1 indicates perfect phase synchrony between the two signals (Fig. 1).
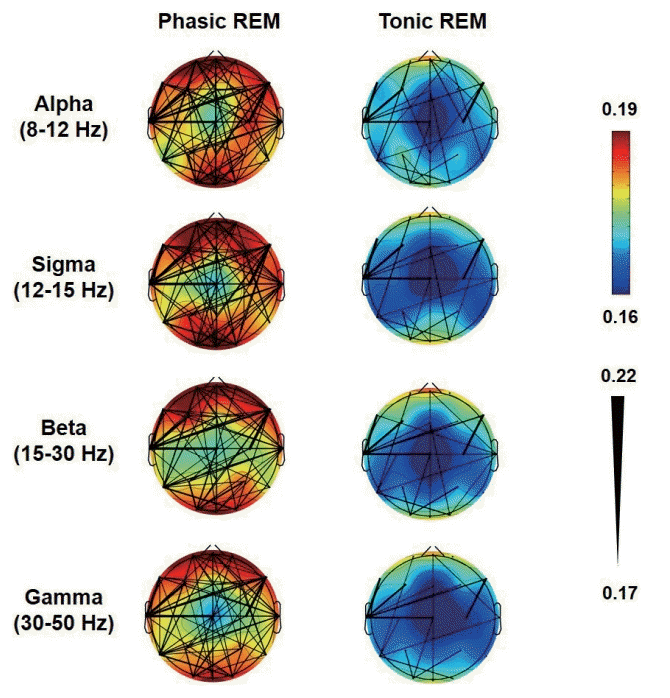 | Fig. 1.Functional connectivity maps in patients with idiopathic rapid eye movement (REM) sleep behavior disorder. The weighted phaselag index (wPLI) values during phasic and tonic REM sleep are depicted. The color scale indicates the connectivity strengths as quantified by the mean wPLI values of the nodes (electrodes), and the thicknesses of the black lines indicate the wPLI values of the edges (connections).
|
Graph-theory analysis
A network is defined as a set of nodes (vertices) and edges (connections), where the edge between two vertices represents some kind of interaction or connection between them (Fig. 2). Graph theory is a mathematics technique that can be used to understand the topological properties of complex brain networks, such as their modularity, hierarchy, and centrality, and the distribution of network hubs. There is a wide variety of graph-theory measures, among which the essential ones are the degree distribution, clustering coefficient, and path length.17 First, the degree refers to the number of connections that link a node to the rest of the network, and its distribution is defined as likelihood p(k) that a randomly chosen vertex will have degree k. Random networks have a symmetrically centered degree distribution, whereas complex networks generally have non-Gaussian distributions with a long tail toward high degree values. Second, clustering coefficient C is a measure of the clustering of local networks. When the nearest neighbors of a vertex are directly connected to each other, they can be considered to form a cluster. Clustering coefficient Ci is therefore defined as the ratio of the number of real edges between neighbors of a vertex i to the maximum possible number of edges. Random networks have low clustering coefficients, whereas regular and complex networks are characterized by high clustering coefficients. Third, the characteristic path length is a graph measure to characterize the global network structure. It is defined as the minimum number of edges that have to be traveled between two vertices, which indicates how easily (or efficiently) information is transferred within the network.
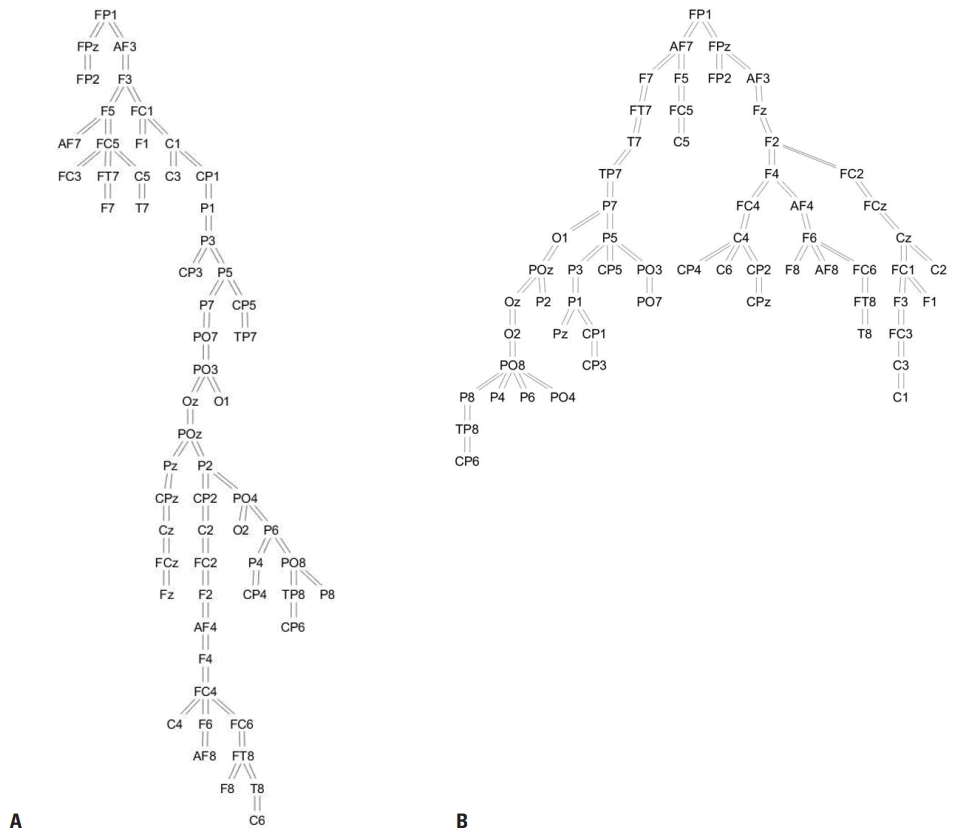 | Fig. 2.Network topology in patients with idiopathic rapid eye movement sleep behavior disorder (A) and controls (B). Resting-state electroencephalography functional connectivity in the theta band was measured by the phase-lag index, and the network structures were determined using the minimum spanning tree algorithm.
|
Further information on other graph-theory measures can be found in the literature.18 It is important to choose an appropriate graph-theory measure that reflects the network characteristics of interest. The network measures can be calculated and the differences between groups or conditions can be compared to assess whether and how the network structure has changed, such as in pathological conditions.
Go to :
EEG ANALYSIS IN EPILEPSY
Epilepsy is a chronic condition of the brain characterized by an enduring predisposition to the generation of recurrent and unprovoked seizures.19 Epileptic seizures are characterized by excessive synchronous neuronal activities in the brain that result in the transient occurrence of various signs and symptoms, such as abnormal sensations, behavior arrest, and tonic and clonic movements. EEG has played an important role in the diagnosis of epilepsy, classification of seizure types, localization of the epileptogenic focus, and treatment follow-up of patients with epilepsy.
There is increasing evidence that epilepsy is a network disease.20 Multiple brain regions and their abnormal connections are involved in the generation of seizures and the maintenance of epileptogenicity. Previous stereo-EEG (SEEG) studies investigated ictal and interictal functional connectivities in patients with mesial temporal lobe epilepsy (mTLE).21,22 A nonlinear correlation coefficient was measured for estimating the functional connectivity between two regions of interest within the mesial temporal lobe. The functional connectivity between the limbic structures was found to increase significantly during the preictal period, which might represent a synchronized condition required for the initiation of seizure activity.21 During the interictal period, patients with mTLE showed higher functional connectivity within the mesial temporal lobe structures in the theta, alpha, beta, and gamma frequency bands compared with patients with non-mTLE.22 This finding suggests that functional connectivity during the interictal period is also enhanced in the epileptogenic zone (EZ).
Previous imaging studies of patients with epilepsy have shown that the disruption of structural and functional networks is widely distributed beyond the EZ.23 Furthermore, the degree of functional connectivity has been found to be associated with postsurgical outcomes in patients with epilepsy. Patients with mTLE who were not free of seizures after surgery showed a higher connectivity between structures involving not only the ipsilateral temporal lobe but also the extratemporal and contralateral lobes.24 Since complete resection of the EZ is a major prognostic factor, an increased extent and strength of functional connectivity around the resection area might be associated with the poor seizure outcome. Another SEEG study investigated functional connectivity in the EZ, propagation zone (PZ), and noninvolved zone (NIZ) in patients with malformation of cortical development,25 and found that connectivity was stronger in both the EZ and PZ than in the NIZ. Compared with seizure-free patients, not-seizure-free patients exhibited increased functional connectivity both within the NIZ and between the NIZ and PZ. These findings suggest that a wider extent of the epileptogenic brain network is associated with a worse surgical outcome, and that the boundaries of the EZ cannot be determined based only on the presence of interictal epileptiform discharges and ictal activity.
A graph-theory approach has been used to examine changes in structural and functional connectivity, and to understand the pathophysiology of epilepsy. The network topology can be quantitatively measured and characterized from the perspective of global and regional networks. A scalp EEG study found that patients with epilepsy showed significant increases in both the clustering coefficient and characteristic path length compared with controls, suggesting decreased global integration and increased local connectivity in the epileptic brain network.26 In agreement with this, a higher clustering coefficient with a more-regular network structure in the theta band was found in patients with temporal lobe epilepsy (TLE) compared with controls.27 Graph-theory measures were also applied to evaluate the brain network changes in intracranial EEG recordings. Betweenness centrality is a measure of the importance of a node as a hub, and this was found to decrease during ictal propagation, indicating that the epileptic network architecture is becoming more regular.28 Among the frequency bands, the gamma-band betweenness centrality network showed the greatest amount of overlap with the seizure-onset zone. Furthermore, seizure-free patients had larger numbers of activated nodes in the gamma band resected during epilepsy surgery compared with not-seizure-free patients. This finding might indicate that the gamma-band activity in the epileptic brain network plays a significant role in the generation and propagation of seizures.
While several previous studies have attempted to localize the epileptic focus using functional connectivity analysis, there is no consensus regarding how the connectivity measures can be used to determine the EZ and the resection margin for epilepsy surgery. Further studies utilizing functional connectivity data are therefore necessary to localize the EZ. Understanding the network characteristics of epilepsy might offer an opportunity to improve the probability of achieving seizure freedom after epilepsy surgery.
Go to :
EEG ANALYSIS IN NEURODEGENERATIVE DISEASES
Most cognitive functions of the brain are based on interactions between the neural populations in different brain regions. There is increasing evidence that cognitive dysfunctions in neurodegenerative diseases are associated with abnormal neural synchronization. Alzheimer’s disease (AD) is the most-common cause of dementia in older adults, and is characterized by a progressive decline in the cognitive functions, and it typically begins with memory impairment.29 Previous studies applying spectral analyses to EEG data have found EEG slowing in patients with AD, which is characterized by increases in the delta- and theta-band powers and decreases in the alpha- and beta-band powers compared with controls.30 A strong correlation was found between EEG slowing and cognitive deficits, suggesting that dysfunction of information processing in the cerebral cortex contributes to the cognitive decline in patients with AD.
The presence of reduced EEG functional connectivity in AD has been established by previous studies. Patients with AD showed a significant loss of EEG synchrony in the alpha and beta bands compared with both patients with mild cognitive impairment and healthy controls.31,32 The loss of beta-band synchronization was also associated with lower cognitive scores, which suggests the importance of the beta-band activity in the pathophysiology of AD. A graph-theory analysis of beta-band synchronization demonstrated that the characteristic path length was significantly longer in AD patients than in controls, whereas the cluster coefficient did not differ between these two groups.33 A longer characteristic path length was associated with lower cognitive scores. These findings suggest that the brain network of AD patients is characterized by the loss of small-worldness and suboptimal organization. A magnetoencephalography (MEG) study produced similar results, wherein the phase-lag index in the lower alpha and beta bands was significantly lower in AD patients than in controls.34 A topographic analysis found that short-distance connectivity was decreased mainly in the frontal regions, while reduced long-distance connections were found in the bilateral frontoparietal and frontal interhemispheric connections in patients with AD. Network modeling indicated that functional connectivity was preferentially lost at high-degree nodes, suggesting that the network hubs are preferentially affected by the pathogenesis of AD.
Dementia with Lewy bodies (DLB) is one of the most-common types of dementia after AD and vascular dementia. It is characterized by progressive cognitive decline along with fluctuations in attention and cognition, visual hallucinations, parkinsonism, and REM sleep behavior disorder (RBD).35 EEG abnormalities in patients with DLB include the loss of alpha-band activity as the posterior dominant rhythm and the presence of slow wave transients in the temporal lobe.36 Dominant frequencies were significantly lower in DLB patients than AD patients, while the variability in dominant frequencies was greater in DLB patients.37 Cognitive fluctuations have been associated with variability in EEG activities. An EEG functional connectivity study revealed that the connectivity strength was lower in patients with DLB than in patients with AD and healthy controls, especially in the alpha band.38 A graph-theory analysis of alpha-band network topology showed decreases in degree and betweenness centrality, and increases in the diameter and eccentricity in patients with DLB. These findings suggest that the brain network of DLB patients is characterized by a loss of hub nodes along with decreased global efficiency.
DLB is a neurodegenerative disease exhibiting α-synucleinopathy; that is, it is characterized by the abnormal accumulation of α-synuclein deposits.39 The main α-synucleinopathy phenotypes include Parkinson’s disease, multiple system atrophy, and DLB. One of the main clinical characteristics of α-synucleinopathies is RBD, which is a REM-sleep parasomnia characterized by dream-enacting behaviors during sleep and the loss of REM-sleep atonia.40 It has been established that idiopathic RBD (iRBD)—defined as RBD without any neurological disorders or triggering factors—is a prodromal stage of neurodegenerative α-synucleinopathy.41 More than 70% of the patients with iRBD eventually developed parkinsonism or dementia after a 12-year follow-up. Previous EEG studies showed that patients with iRBD had higher theta-band power and lower beta-band power during wakefulness compared with healthy controls.42 Moreover, iRBD patients with abnormal EEG slowing were more likely to subsequently develop overt neurodegenerative diseases.43 A resting-state EEG functional connectivity study revealed that iRBD patients had decreased delta-band connections in frontal areas.44 A loss of delta-band functional connectivity was associated with decreased verbal fluency. This is consistent with a MEG study finding that patients with early and untreated Parkinson’s disease had lower delta-band connectivity compared with controls.45 The results obtained in iRBD studies support the existence of brain network dysfunction at the prodromal stage of α-synucleinopathy, and that the pattern of network changes differ from those seen in other neurodegenerative diseases such as AD.
Go to :
CONCLUSIONS
Changes in brain networks are likely to play a pivotal role in the disease mechanisms underlying various neurological disorders. The patterns of altered networks are mostly associated with deviations from the optimal pattern. Local and global networks can be differentially affected according to the pathogenesis of the underlying disease. EEG produces time-series data on neural oscillations, whose analysis can provide useful information noninvasively and with a good temporal resolution. However, the low spatial resolution and inability to measure neural activities from deep brain structures are limitations of scalp EEG. Researchers should be aware of both the strengths and weaknesses of EEG and analyze EEG data using appropriate methodologies when attempting to improve the understanding of mysterious brain networks.
Go to :
 XML Download