Journal List > Kosin Med J > v.35(2) > 1145385

Jang, Choi, Lee, Sim, Kim, and Jeong: Usefulness of Psoas Muscle Cross-Sectional Area in Evaluating Physical Performance in Patients with Liver Cirrhosis

Abstract

Objectives

To investigate the relationship between the psoas muscle cross-sectional area and physical performance in patients with liver cirrhosis.

Methods

This study analyzed ambulatory patients with liver cirrhosis aged < 65 years, who underwent abdominal computed tomography (CT) and Short Physical Performance Battery (SPPB) tests from December 2018 to December 2019. A total of 46 patients (36 men, 10 women) were included. In abdominal CT scans, the psoas muscle cross-sectional area (mm2) was measured at the distal end-plate level of the L4 vertebral body and normalized by dividing by height (m). Physical performance was evaluated using SPPB. A correlation analysis between the psoas muscle cross-sectional area and SPPB was performed. Kruskal-Wallis test was used to determine differences in the psoas muscle cross-sectional area and SPPB according to the Child-Pugh classification. Multiple regression analysis was performed to determine factors affecting SPPB.

Results

The correlation coefficient between the psoas muscle cross-sectional area and SPPB was 0.459 at the P < 0.01 level. No difference was observed in the psoas muscle cross-sectional area and SPPB according to the Child-Pugh classification. The psoas muscle cross-sectional area was a factor affecting SPPB in multiple regression analysis.

Conclusions

Abdominal CT is an essential diagnostic tool in patients with liver cirrhosis. Ambulatory patients with liver cirrhosis aged < 65 years could have reduced physical performance. In this study, the psoas muscle cross-sectional area was correlated with physical performance and was a factor affecting physical performance. The psoas muscle cross-sectional area and physical performance should be evaluated in patients with liver cirrhosis.

Liver cirrhosis is a representative disease causing inadequate nutrition and protein depletion, with a chronic disease course.1 In patients with liver cirrhosis, micronutrient deficiency and increased leptin and pro-inflammatory cytokines lead to a decrease in taste acuity and appetite. Moreover, reduced intestinal absorption results in hypermetabolic conditions, which are associated with increased energy consumption and high protein catabolism. As a result, skeletal muscle loss and reduced physical performance occur.2 Therefore, it is important to evaluate skeletal muscle and physical performance in patients with liver cirrhosis. Several studies have evaluated skeletal muscle mass using computed tomography (CT). Kalafateli et al. and Kim and Jang evaluated skeletal muscle mass using cross-sectional muscle areas measured in CT scans.2,3
Among the various methods for evaluating skeletal muscle mass using CT scans, measurement of the psoas muscle has recently attracted attention. One previous study showed that the psoas muscle area significantly increased after the improvement of liver cirrhosis in patients who underwent a stent procedure.4 Another study reported a negative correlation between the psoas muscle area and posttransplant mortality.5 The psoas muscle has also been reported to be useful in estimating skeletal muscle mass in patients with liver cirrhosis, as well as for nutritional and metabolic status assessment.6 In another study, the psoas muscle thickness of patients with liver cirrhosis was highly correlated with the skeletal muscle index (SMI) and was reported to predict mortality in this patient population.7 Similarly, various other studies have demonstrated the clinical importance of the psoas muscle in patients with liver cirrhosis.
Physical performance is one of the important factors predicting the prognosis of liver diseases. In previous studies, higher physical performance was observed in nonhospitalized patients with liver cirrhosis than in hospitalized patients.8 Moreover, the Short Physical Performance Battery (SPPB) was found to be useful for the development of a frailty index for predicting mortality in patients with end-stage liver disease.9
The cross-sectional area of the psoas muscle can be easily obtained through abdominal CT, which is an essential imaging method in patients with liver cirrhosis. Assessing muscle mass using the psoas muscle cross-sectional area and analyzing its association with clinical parameters that can affect physical performance are useful. However, few studies have investigated the relationship between the psoas muscle cross-sectional area and physical performance in patients with liver cirrhosis. Moreover, few studies have been published on the difference of the psoas muscle cross-sectional area and physical performance according to the severity of liver cirrhosis.
The purpose of this study was to investigate the relationship between the psoas muscle cross-sectional area, which is a quantitative parameter of muscle mass determined using abdominal CT scans, and physical performance. Moreover, we also investigated the relationship between physical performance and other clinical parameters that can affect physical performance in liver cirrhosis, including SMI, grip strength, and serum albumin level.

MATERIALS AND METHODS

Patients

This study involved a retrospective review of medical charts of patients diagnosed with liver cirrhosis at OO university hospital between December 2018 and December 2019. The inclusion criteria were as follows: (1) an initial diagnosis of liver cirrhosis based on abdominal CT and liver biopsy results; (2) ability to ambulate; and (3) age < 65 years, to rule out low physical performance due to aging. The exclusion criteria were as follows: (1) advanced liver cancer at the time of liver cirrhosis diagnosis; (2) a history of neurologic disease that may affect physical performance; (3) active encephalopathy due to liver cirrhosis; and (4) inability to maintain a neutral anteroposterior position because of a spinal disease, such as scoliosis. The severity of liver cirrhosis was determined according to the Child-Pugh classification.10 The sample size was obtained using the correlation coefficient between the psoas muscle cross-sectional area and SPPB calculated with MedCalc (MedCalc Software, Ostend, Belgium), with a power of 0.80 and a significance of 0.01. This study was approved by the Institutional Review Board of OO university hospital.

Psoas muscle cross-sectional area

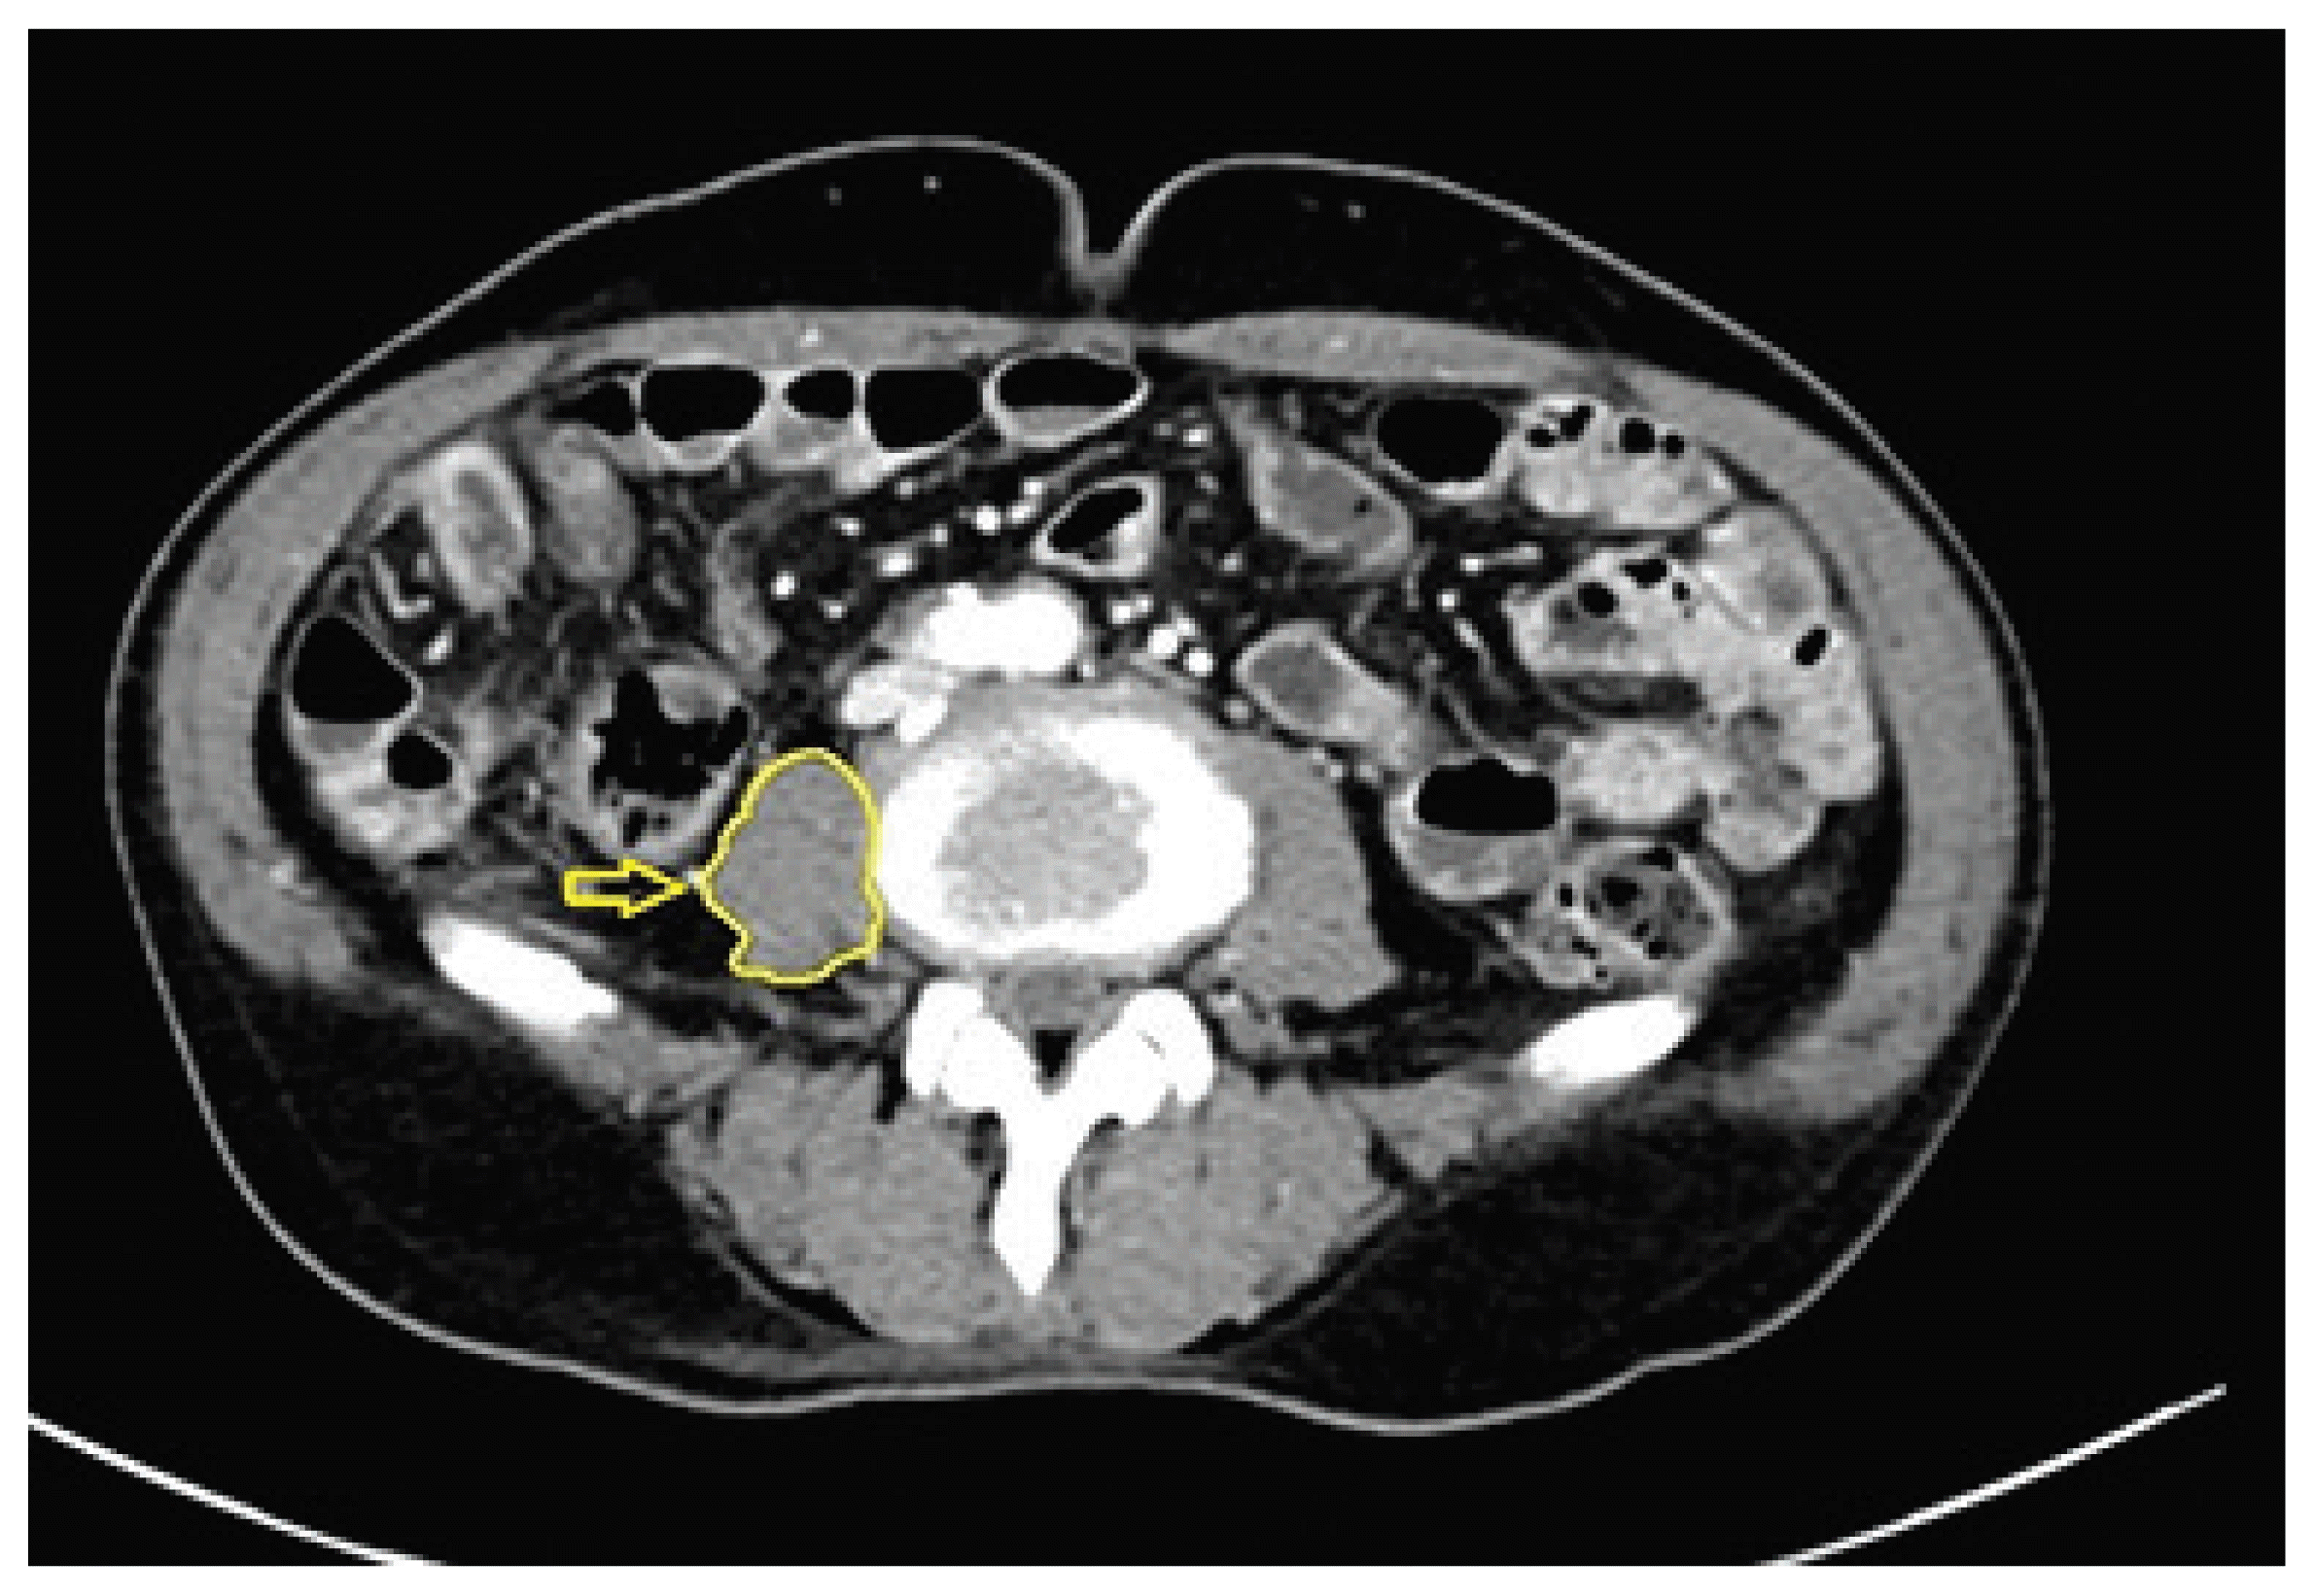
In this study, the abdominal CT scans of all patients, obtained using the same criteria and methods, were used to measure the psoas muscle cross-sectional area. In a study on the psoas muscle cross-sectional area, the psoas muscle at the L4/5 level had the largest cross-sectional area and showed the highest symmetry.11 In the current study, we measured the psoas muscle cross-sectional area at the distal end-plate level of the L4 vertebral body, which is close to the L4/5 intervertebral disc. The psoas muscle cross-sectional area on the right side was measured by two trained operators using FIJI/ImageJ software (Laboratory for Optical and Computational Instrumentation, University of Wisconsin-Madison, Madison, WI, USA) (Fig. 1). Finally, the average of the psoas muscle cross-sectional area measurements by the two operators was calculated and normalized by dividing by the patient’s height (m).

Skeletal muscle index

To obtain the SMI (kg/m2), the predicted skeletal muscle mass (kg) was divided by height squared (m2). As this was a prospective study, bioimpedance analysis (BIA) was selected to measure the predicted skeletal muscle mass because it is quick to perform, cost-effective, and safe compared with other evaluation methods. BIA was performed using an Inbody S10 machine (Inbody, Seoul, South Korea). When performing BIA, electrodes were attached to the first and third fingers, as well as to the ankles of the patient in the supine position. The SMI obtained using BIA is considered to indicate low muscle mass when the value is ≤ 8.87 kg/m2 in men and ≤ 6.42 kg/m2 in women, according to a representative study on SMI measurement using BIA.12

Muscle strength

Muscle strength (kg) was evaluated by measuring the isometric handgrip strength of the dominant hand using a Jamar hydraulic hand dynamometer (Jamar, Chicago, IL, USA). Tests were performed two times at 5-min intervals, and the higher value of the two tests was adopted for the analysis.

Physical performance

SPPB was used as a measure of physical performance. SPPB consists of balance, gait, strength, and endurance, assessed by examining a patient’s ability to stand with the feet together in side-by-side, semi-tandem, and tandem positions; the time to walk 4 m; and the time to rise from a chair and return to the seated position five times.12 SPPB uses the total score of balance, gait speed, strength, and endurance with a minimum of 0 points and maximum of 4 points in each component.

Nutritional status assessment

The biochemical parameters used for nutritional status assessment in patients with liver diseases are albumin, pre-albumin, retinol-binding protein, and serum total protein.13 In this study, we measured serum albumin, which is used as a criterion of liver cirrhosis severity and is commonly assessed in clinical practice. Serum albumin was considered abnormal when the level was < 3.5 g/dL, and the patients were divided into the normal and abnormal groups accordingly.

Statistical analysis

Reliability analysis was performed to check the inter-rater reliability of the psoas muscle cross-sectional area. Bivariate correlation analysis was performed to investigate the correlation between SPPB and serum albumin, age, body mass index, and SMI. The Mann-Whitney U-test was performed to determine the effect of sex and serum albumin on the SPPB test results. A Kruskal-Wallis test was performed to determine differences in the psoas muscle cross-sectional area, SMI, serum albumin, and SPPB according to the severity of liver cirrhosis. Univariate analysis was performed to select independent variables in multiple regression analysis. Finally, multiple regression analysis was performed to determine the factors affecting SPPB.

RESULTS

A total of 46 patients (36 men, 10 women) were finally included in this study (the sample size calculated by MedCalc was 50 patients). The number of patients with Child-Pugh class A, B, and C was 25, 8, and 13, respectively (Table 1). The inter-rater correlation coefficient was 0.959, with a P-value of 0.000. In bivariate correlation analysis, the psoas muscle cross-sectional area was significantly correlated with SPPB (r = 0.459, P < 0.01). SPPB had no significant correlation with SMI, age, or body mass index (Table 2). In the Mann Whitney U-test, SPPB had a significant difference according to serum albumin (P = 0.003) but showed no significant difference according to sex (Table 2). The mean value of serum albumin was statistically significant according to the severity of liver cirrhosis; however, the differences in the mean values of the psoas muscle cross-sectional area, SMI, and SPPB according to liver cirrhosis severity were not statistically significant in the Kruskal-Wallis test (Table 3). The psoas muscle cross-sectional area, grip strength, and serum albumin showed significance in univariate analysis. In multiple regression analysis, all independent variables were entered into the equation. The psoas muscle cross-sectional area, grip strength, and serum albumin were identified as factors affecting SPPB (Table 4).

DISCUSSION

In this study, the psoas muscle cross-sectional area showed a statistical correlation with SPPB, and was also identified as a factor affecting physical performance in patients with liver cirrhosis in multiple regression analysis. In addition, the psoas muscle cross-sectional area was a statistically more obvious factor than albumin. The SMI had no significant correlation with physical performance. Age, body mass index, and sex also had no significant correlation with physical performance. Therefore, the psoas muscle cross-sectional area is a useful parameter for evaluating physical performance in patients with liver cirrhosis.
Gu et al. previously suggested the clinical usefulness of the psoas muscle thickness for diagnosing sarcopenia in patients with liver cirrhosis, and Kim et al. reported that the psoas muscle thickness divided by the patient’s height is a useful factor for predicting long-term mortality in patients with liver cirrhosis with ascites.5,14 Therefore, various evaluations and predictions using the psoas muscle have been attempted in patients with liver cirrhosis. In the current study, the psoas muscle cross-sectional area was identified as a useful factor that was not associated with the severity of liver cirrhosis and was associated with physical performance. Previous studies have demonstrated that the psoas muscle cross-sectional area differs according to age and sex; however, in this study, no differences in the psoas muscle cross-sectional area were found according to age and sex when the area was normalized by the patient’s height.15 Few studies have considered the association between the psoas muscle cross-sectional area and physical performance in ambulatory patients with liver cirrhosis aged < 65 years. Therefore, this study is valuable as a basic preliminary study on this issue.
SPPB was used as a measure of physical performance. According to the Asian Working Group for Sarcopenia, the cutoff value of SPPB was 8 points, based on which nine patients in this study had low physical performance.16 All patients were aged < 65 years with no specific history that could affect physical performance. Low physical performance may be considered a characteristic sign in patients with liver cirrhosis, raising the importance of physical performance assessment in patients with liver cirrhosis and suggesting that the psoas muscle cross-sectional area is a clinically useful factor for evaluating physical performance.
Further studies are needed in setting the cutoff value of the psoas muscle cross-sectional area normalized by the individual’s height depending on age and sex, which can be a clinically useful indicator of physical performance in ambulatory patients with liver cirrhosis aged < 65 years.
In this study, the SMI was obtained using BIA and had no significant correlation with physical performance. In addition, all patients showed a normal SMI, although some patients had low handgrip strength and low physical performance. Prior studies have shown that muscle mass was not associated with physical performance in weak older adults and that handgrip strength was clinically more important.17 This study found that muscle mass was not associated with physical performance in patients with liver cirrhosis aged < 65 years.
In this study, nutrition represented by serum albumin was found to affect physical performance. Montano-Loza suggested using the psoas muscle cross-sectional image for nutritional and metabolic assessment in patients with liver cirrhosis and sarcopenia.6 In this study, the psoas muscle cross-sectional area had no significant association with serum albumin. Several possible reasons for this result can be suggested. First, all patients had no sarcopenia. Second, as the rate of muscle mass loss is estimated to be 1–2% per year and the metabolism cycle of serum albumin is 25 days, there was a difference in the rate of change for these parameters.1820 Nevertheless, we suggest that there is a need to evaluate physical performance in cirrhotic patients with low serum albumin because serum albumin was an important factor affecting physical performance in this study.
Whereas previous studies have focused on predicting the SMI in patients with liver cirrhosis, the present study is a basic study on factors affecting physical performance and provides evidence on the clinical usefulness of the psoas muscle cross-sectional area.
This study had some limitations. First, the SMI is usually obtained using dual-energy x-ray absorptiometry (DEXA) and BIA; however, we used only BIA in this study. Previous studies have questioned the accuracy of BIA and indicated that DEXA has a higher accuracy than BIA.2123 Further studies evaluating the SMI using DEXA may provide clearer results about the correlation between the SMI and physical performance. Second, the value of the psoas muscle cross-sectional area could have been be overstated in this study. In bivariate correlation analysis, grip strength had a higher correlation coefficient with SPPB than the psoas muscle cross sectional area. Therefore, besides the psoas muscle cross-sectional area, focus should also be directed to the clinical importance of grip strength in evaluating physical performance in patients with liver cirrhosis.
Abdominal CT is an essential diagnostic tool in patients with liver cirrhosis. Therefore, the psoas muscle cross-sectional area can be easily obtained in these patients without additional examination and cost requirements. In this study, we found a correlation between the psoas muscle cross-sectional area and physical performance in ambulatory patients with liver cirrhosis aged < 65 years. Therefore, upon the first diagnosis of liver cirrhosis, evaluation of the psoas muscle cross-sectional area using abdominal CT is important. Furthermore, it is also important to evaluate physical performance in patients with liver cirrhosis with low psoas muscle cross-sectional area even if the SMI is normal. These evaluations may enable the early detection of deterioration of physical performance and allow planning immediate rehabilitation.

Notes

CONFLICT OF INTEREST

The authors report no potential conflicts of interest relevant to this article.

REFERENCES

1. Schuppand D, Afdhal NH. Liver cirrhosis. Lancet. 2008; 371:838–51.
2. Kalafateli M, Konstantakis C, Thomopoulos K, Triantos C. Impact of muscle wasting on survival in patients with liver cirrhosis. World J Gasteroenterol. 2015; 21:7357–61.
crossref
3. Kim HY, Jang JW. Sarcopenia in the prognosis of cirrhosis: Going beyond the MELD score. World J Gastroenterol. 2015; 21:7637–47.
crossref
4. Tsien C, Shah SN, McMullough AJ, Dasarathy S. Reversal of sarcopenia predicts survival after a transjugular intrahepatic portosystemic stent. Eur J Gastroenterol Hepatol. 2013; 25:85–93.
crossref
5. Englesbe MJ, Patel SP, He K, Lynch Rj, Schaubel DE, Harbaugh C, et al. Sarcopenia and Mortality After Liver Transplantation. J Am Coll Surg. 2010; 211:271–8.
crossref
6. Montano-Loza AJ. Clinical relevance of sarcopenia in patients with cirrhosis. World J Gasteroenterol. 2014; 20:8061–71.
crossref
7. Gu DH, Kim MY, Seo YS, Kim SG, Lee HA, Kim TH, et al. Clinical usefulness of psoas muscle thickness for the diagnosis of sarcopenia in patients with liver cirrhosis. Clinic Mol Hepatol. 2018; 24:319–30.
crossref
8. Marie S, Eduard P, Jennifer LD, Jennifer CL. Frailty is independently associated with increased hospitalisation days in patients on the liver transplant waitlist. World J Gastroenterol. 2017; 23:899–905.
9. Jennifer CL, Kenneth EC, Jennifer LD, John B, Dorry LS, John PR, et al. Development of a novel frailty index to predict mortality in patiens with end-stage liver disease. Hepatology. 2017; 66:564–74.
10. Durand F, Valla D. Assessment of prognosis of cirrhosis: Child-Pugh versus MELD. J Hepatol. 2005; 42:S100–7.
11. Reid JG, Livingston LA, Pearsall DJ. The geometry of the psoas muscle as determined by magnetic resonance imaging. Arch Phys Med Rehabil. 1994; 75:703–8.
crossref
12. Cruz-jentoft AJ, Baeyens JP, Bauer JM, Boirie Y, Cederholm T, Landi F, et al. Sarcopenia: European consensus on definition and diagnosis. Age Ageing. 2010; 39:412–23.
13. Silva M, Gomes S, Peixoto A, Ramalho PT, Cardoso H, Azevedo R, et al. Nutrition in chronic liver disease. GE Port J Gastroenterol. 2015; 22:268–76.
crossref
14. Kim TY, Kim MY, Sohn JH, Kim SM, Ryu JA, Lim SH, et al. Sarcopenia as a useful predictor for long term mortality in cirrhotic patients with ascites. J Korean Med Sci. 2014; 29:1253–9.
15. Imamura K, Ashida H, Ishikawa T, Fuiji M. Human major psoas muscle and sacrospinalis muscle in relation to age: a study by computed tomography. J Gereontol. 1983; 38:678–81.
crossref
16. Chen LK, Liu LK, Woo J, Assantachai P, Auyeung TW, Bahyah KS, et al. Sarcopenia in Asia: Consensus Report of the Asian Working Group for Sarcopenia. J Am Med Dir Assoc. 2014; 15:95–101.
crossref
17. Kim KE, Jang SN, Lim S, Park YJ, Paik NJ, Kim KW, et al. Relationship between muscle mass and physical performance: is it the same in older adults with weak muscle strength? Age Ageing. 2012; 41:799–803.
crossref
18. Haehling S, Morley JE, Anker SD. An overview of sarcopenia: facts and numbers on prevalence and clinical impact. J Cachexia Sarcopenia Muscle. 2010; 1:129–33.
crossref
19. Levitt DG, Levitt MD. Human serum albumin homeostasis: a new look at the roles of synthesis, catabolism, renal and gastrointestinal excretion, and the clinical value of serum albumin measurements. Int J Gen Med. 2016; 9:229–55.
crossref
20. Alber AB, Suter DM. Dynamics of protein synthesis and degradation through the cell cycle. Cell cycle. 2019; 18:784–94.
crossref
21. Huang SW, Hsieh FC, Lin LF, Liao CD, Ku JW, Hsiao DJ, et al. Correlation between Body Composition and Physical Performance in Aged People. Int J Gastroenterol. 2018; 12:186–90.
crossref
22. Mourtzakis M, Prado CMM, Lieffers JR, Reiman T, McCargar LJ, Baracos VE. A practical and precise approach to quantification of body composition in cancer patients using computed tomography images acquired during routine care. Appl Physiol Nutr Metab. 2008; 33:997–1006.
crossref
23. Antonio J, Kenyon M, Ellerbroek A, Carson C, Burgess V, Tyler-Palmer D, et al. Comparison of dual energy x-ray absorptiometry versus a multi frequency bioelectrical impedance device for body composition assessment after a 4-week hypoenergetic diet. Funct Morphol Kinesiol. 2019; 4:23.

Fig. 1
Measurement of the psoas muscle cross-sectional area (arrow) at the distal end-plate level of the L4 vertebral body.
kmj-35-2-133f1.gif
Table 1
Demographic and baseline clinical characteristics
Variable Value
Men (n = 36) Women (n = 10)
Psoas muscle cross-sectional area (mm2/m) 652 ± 126 456 ± 113
Skeletal muscle index (kg/m2) 11.59 ± 1.78 10.02 ± 1.08
Grip strength (kg) 31.5 ± 8.8 17.8 ± 4.2
Short Physical Performance Battery 10.9 ± 1.9 9.2 ± 2.6
Serum albumin (g/dL) 3.38 ± 0.72 3.11 ± 0.86
Body mass index 23.46 ± 3.67 25.74 ± 6.0
Age (years) 56.2 ± 6.2 55.8 ± 6.8
Child-Pugh classification
 Class A 21 (58%) 4 (40%)
 Class B 5 (14%) 3 (30%)
 Class C 10 (28%) 3 (30%)

Values are presented as mean ± standard deviation or number (%).

Table 2
Comparison of factors with SPPB
SPPB
Bivariate correlation analysis Correlation coefficient
 Psoas muscle cross-sectional area 0.459**
 Serum albumin 0.415**
 Grip strength 0.672**
 Age −0.710
 Body mass index −0.810
 Skeletal muscle index 0.018
Mann-Whitney U-test P-value
 Sex 0.093
 Serum albumin 0.003**

SPPB, Short Physical Performance Battery.

** P < 0.01.

Table 3
Comparison of factors according to liver cirrhosis severity
Child-Pugh classification P-value

Class A (n = 25) Class B (n = 8) Class C (n = 13) Across three groups Between two groups
PMCSA (mm2/m) 616 ± 141 579 ± 184 613 ± 146 0.674 A vs. B A vs. C B vs. C
SMI (kg/m2) 11.32 ± 1.89 10.62 ± 1.32 11.46 ± 1.80 0.370 A vs. B A vs. C B vs. C
Serum albumin (g/dL) 3.58 ± 0.72 2.90 ± 0.70 3.08 ± 0.73 0.042a) A vs. Bb) A vs. C B vs. C
Grip strength (kg) 29.9 ± 10.0 27.2 ± 12.0 26.6 ± 8.2 0.601 A vs. B A vs. C B vs. C
SPPB 10.56 ± 1.85 9.87 ± 2.74 9.84 ± 2.07 0.359 A vs. B A vs. C B vs. C

Values are presented as mean ± standard deviation.

a) P < 0.05

b) P < 0.05 by Kruskal-Wallis test for continuous variables and Mann-Whitney U-test for post-hoc analysis.

PMCSA, psoas muscle cross-sectional area; SMI, skeletal muscle index; SPPB, Short Physical Performance Battery.

Table 4
Multiple regression analysis of factors correlated with SPPB
Standardized β P-value Adjusted R2
Psoas muscle cross-sectional area 0.269 0.035* 0.463
Grip strength 0.335 0.016*
Serum albumin 0.300 0.021*

* P < 0.05 by multiple regression analysis.

TOOLS
Similar articles