

 PDF
PDF Citation
 Print
Print


INTRODUCTION
Anterior nares (AN), nasopharyngeal (NP), and oropharyngeal (OP) swabs are commonly used to diagnose upper respiratory tract infections. According to the US CDC, Korea Disease Control and Prevention Agency, and WHO recommendations for upper respiratory specimen collection and transport, it is recommended that NP and OP swabs be placed in the same transport tube (1, 2, 3). In other words, samples taken from the nose and throat to diagnose an upper respiratory infection are considered to be identical. However, it has been reported that there are differences between the diagnostic effectiveness of NP and OP swabs for some respiratory infections (4, 5). Thus, if diagnostic accuracy is sample location dependent, more detailed sampling site information is required to determine the specimen types that produce the most reliable results. Therefore, this study was conducted to develop a prediction model to identify sampling sites for previously obtained upper respiratory swab samples based on microbial community structures.
Go to : 
MATERIALS AND METHODS
Data acquisition and preprocessing
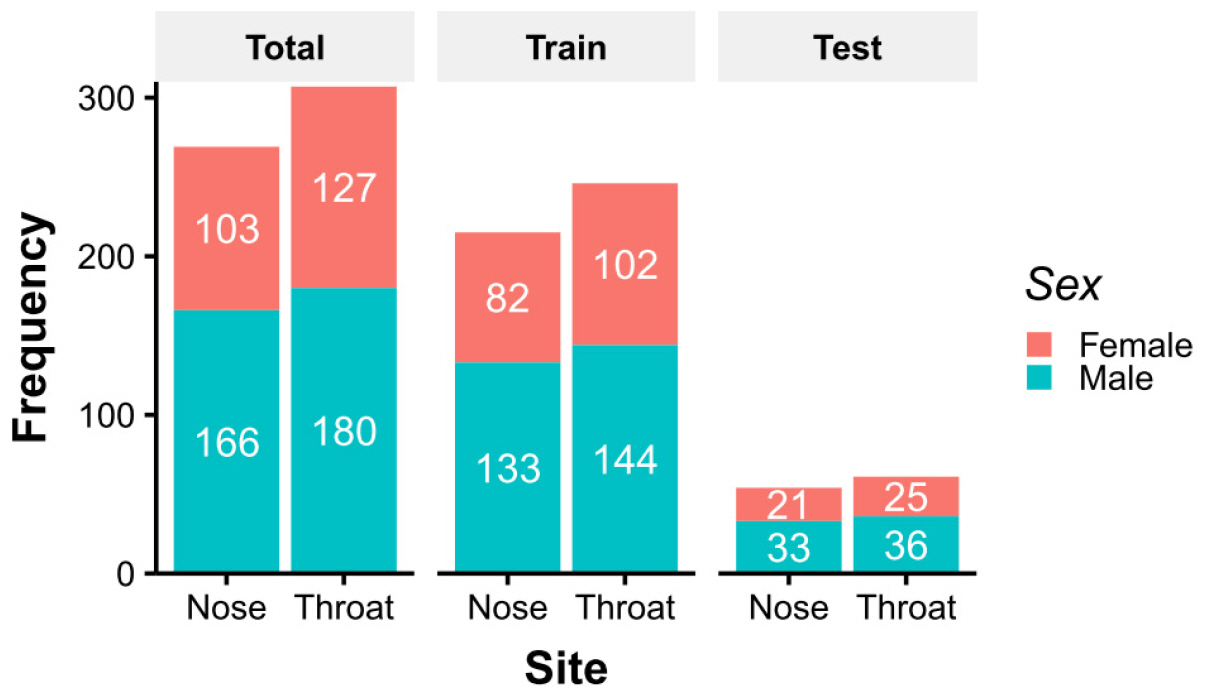
Operational taxonomic unit (OTU) count data were downloaded from the NIH Human Microbiome Project (HMP) website (6). The data used were de-identified and publicly available, and thus, Institutional Review Board approval was not required. Data was generated by 16S rRNA shotgun metagenome sequencing of bacterial V3–5 regions. Among downloaded data, 576 cases were selected sampled at ‘anterior_nares’ or ‘throat’. Since they were sampled from healthy volunteers, whose characteristics were shown in Fig. 1. To account for uneven numbers of sequence for each sample, OTU counts were converted to abundances associated with each taxon.
Comparison of taxon abundances in nose and throat sample
To compare taxon abundances, taxonomy tree-based visualizations of the microbiomes of nose and throat samples were performed using the metacoder package in R (7). The Wilcoxon’s rank-sum test was applied to differences in median bacterial abundances in nose and throat samples to identify the most statistically significant taxa. To address the multiple comparison problem, adjusted p-values were calculated using the Benjamini & Hochberg method. Only taxa with an adjusted p-value of < 0.05 were mapped onto the phylogenetic tree. Principal component analysis (PCA) was performed to assess sample clustering.
Supervised machine learning
For supervised learning and predicting sampling sites, nose and throat samples were divided into training and test sets by sex-stratified random sampling at a ratio of 4:1 (Fig. 1). The random forest (RF) method is most commonly used for applying a decision tree. The RF classifier was implemented using the randomForest package in R (8), and hyperparameters were tuned using the caret package in R (9). A 10-fold cross-validation was repeated 5 times to optimize model robustness. The variable importance of the final model, the effect of each taxa abundance on the decision model, was visualized in the taxonomic tree. To establish a simple prediction model, recursive partitioning and regression trees (RPART) were applied using the rpart package in R (10). A leave-group-out cross-validation was repeated 5 times for RPART.
Sampling site prediction and performance evaluation
Test sets were predicted using the RF-based and RPART-based models, respectively. The prediction performances of each model for the sampling site were evaluated based on accuracies, sensitivities, specificities, positive predictive values (PPVs), negative predictive values (NPVs), and balanced accuracies (an accuracy metric addresses class imbalance). Receiver Operating Characteristic (ROC) analysis and areas under curves (AUCs) were used to visualize model performances.
Statistical analysis
The analysis and determinations of the significances of differences were performed in R (11).
Go to :
RESULTS
The relative abundances of bacterial taxa in samples were shown in Fig. 2A and B. Nose and throat bacterial communities were dominated by Actinobacteria and Bacteroidetes, respectively. Firmicutes were abundant in both sites. Differentially abundant taxa at the two sampling sites were shown in Fig. 2C. Actinobacteria and Cyanobacteria were more abundant in nose samples, while Bacteroidetes, Fusobacteria, Tenericutes, and Spirochaetes were more abundant in throat samples. The PCA plot revealed distinctly different microbial compositions in nose and throat samples (Fig. 2D).
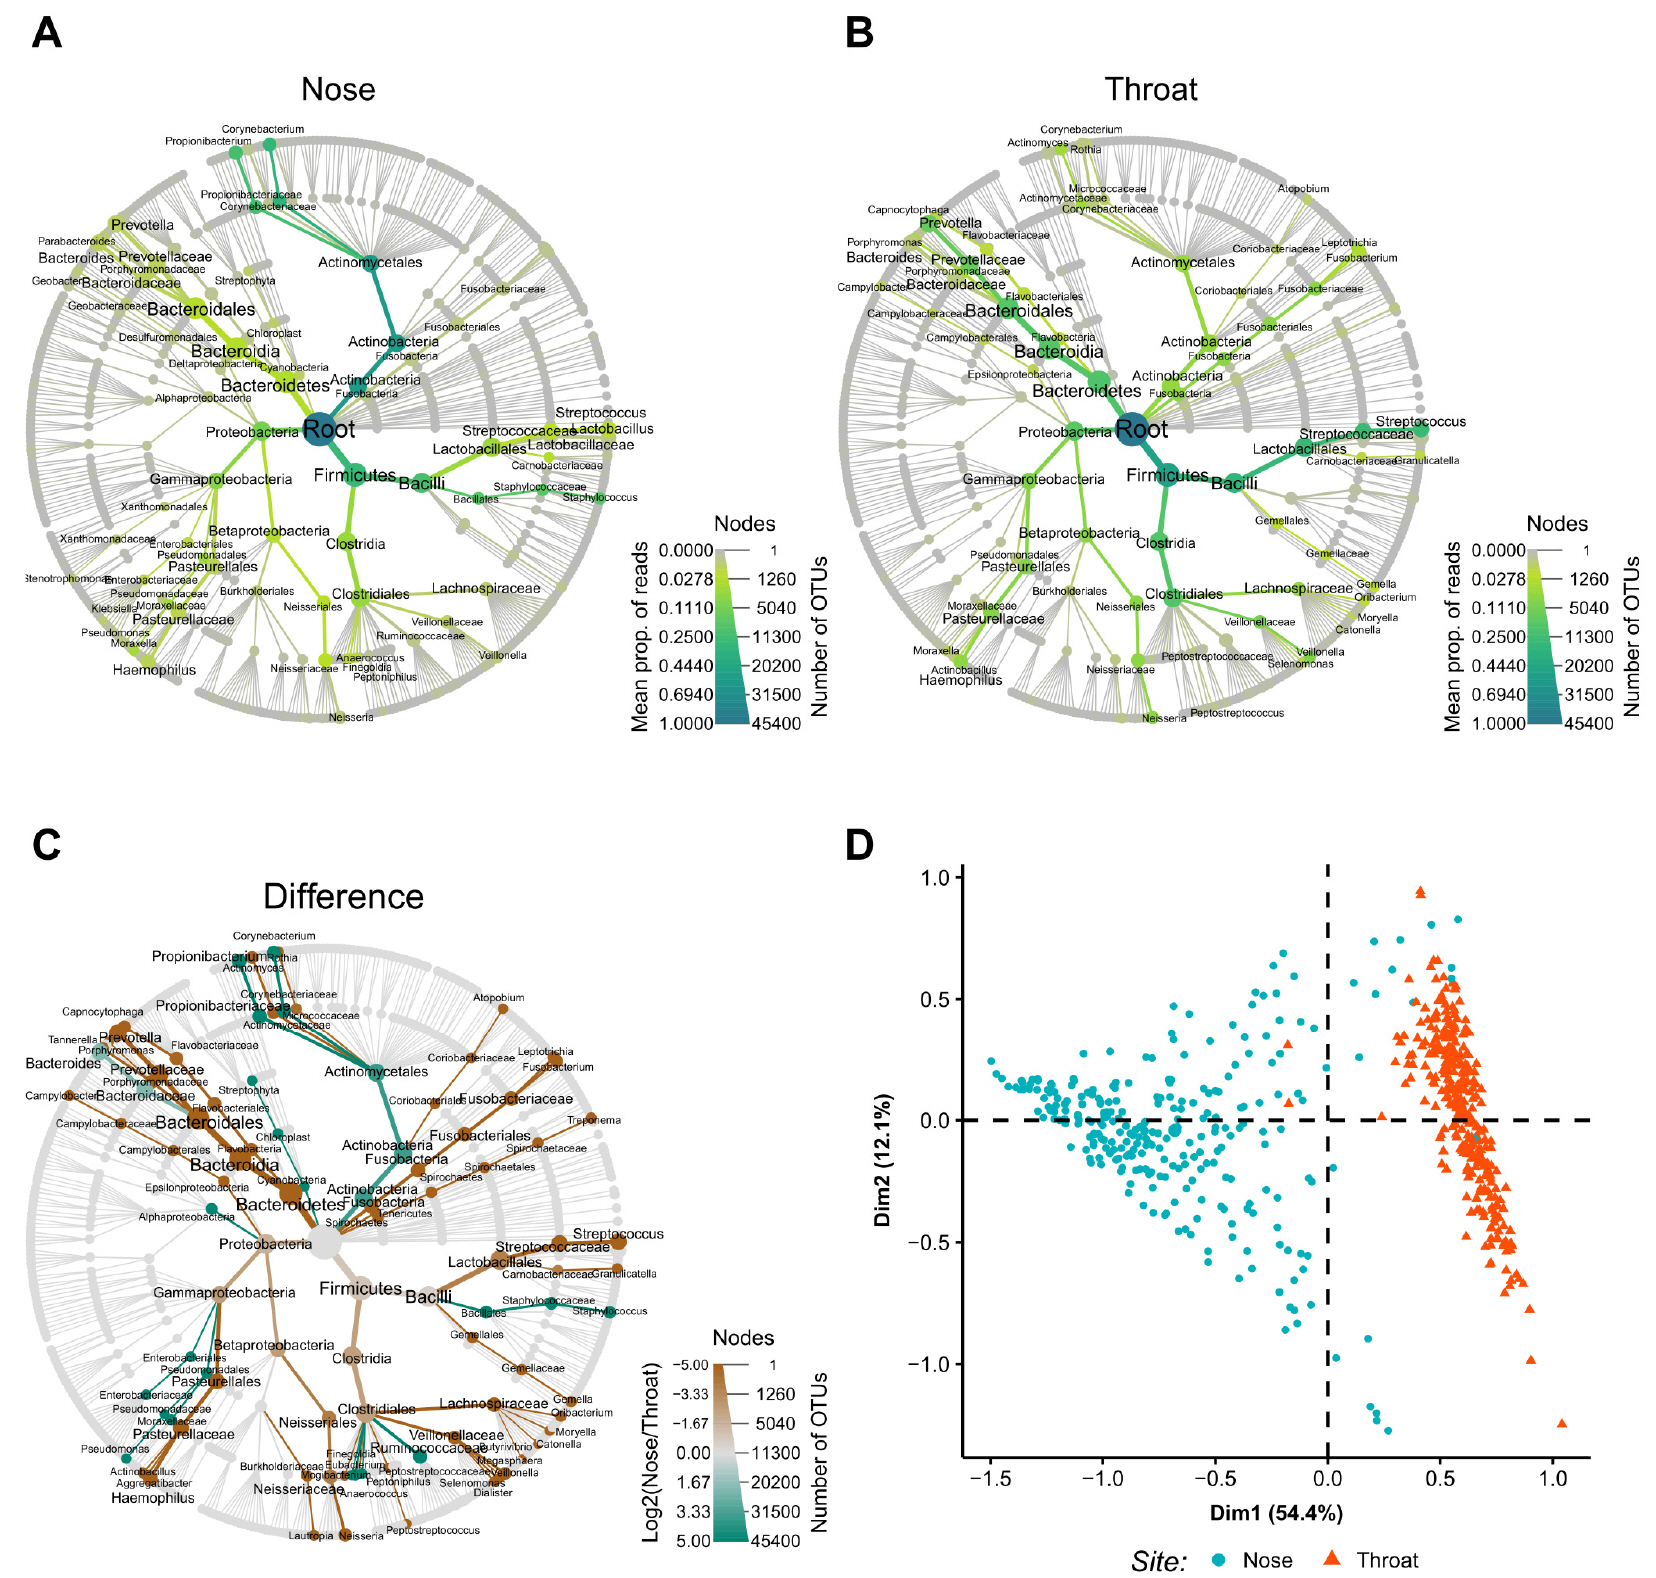 | Fig. 2Taxa abundances and differences between nose and throat samples. The relative abundances and abundance differences of taxa are shown in a tree diagram. Node and edge sizes represent numbers of OTUs and samples, respectively. Node and edge colors represent mean proportion of reads. (A) Abundant taxa in the nose. (B) Abundant taxa in the throat. (C) Differentially abundant taxa between nose and throat. Node and edge colors represent log-transformed differences between mean proportions of reads for nose and throat samples. (D) Principal component analysis plot. prop, proportion; OTU, operational taxonomic unit.
|
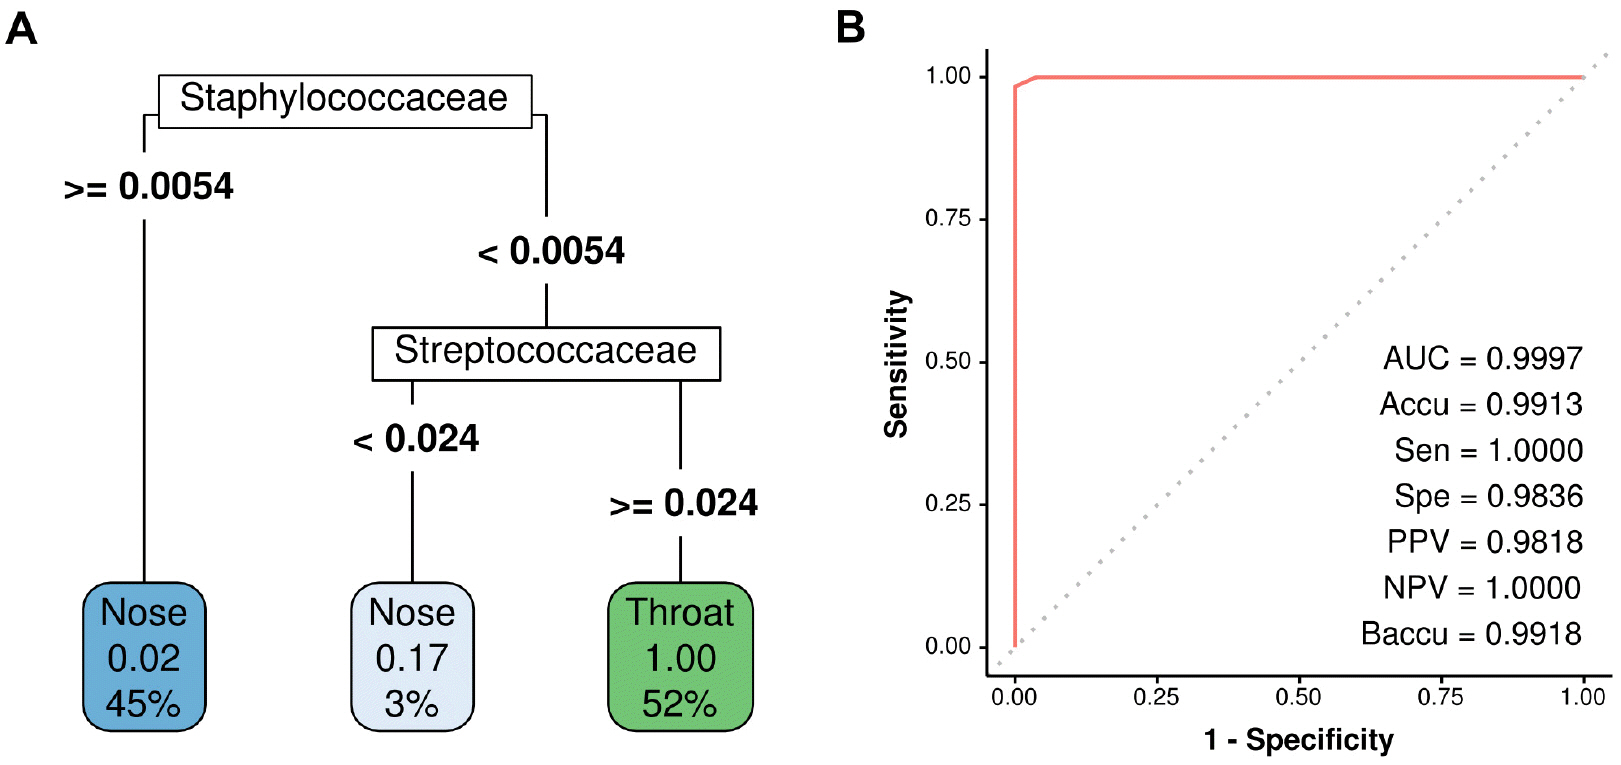
For binary classification problem of identifying sampling site, RF model provided perfect prediction on the test set (Fig. 3A). The variable importance of the model was shown in the taxonomy tree (Fig. 3B). Staphylococcus, Oribacterium, and Veillonella were the most important taxa for the prediction in the RF model. Despite its excellent performance, the RF model needed many variables for prediction, and thus, the RPART model was created to simplify the process. The final decision tree obtained using the RPART model was shown in Fig. 4A. This model provided near-perfect prediction on the test set using just two variables, the relative abundances of Staphylococcaceae and Streptococcaceae (Fig. 4B).
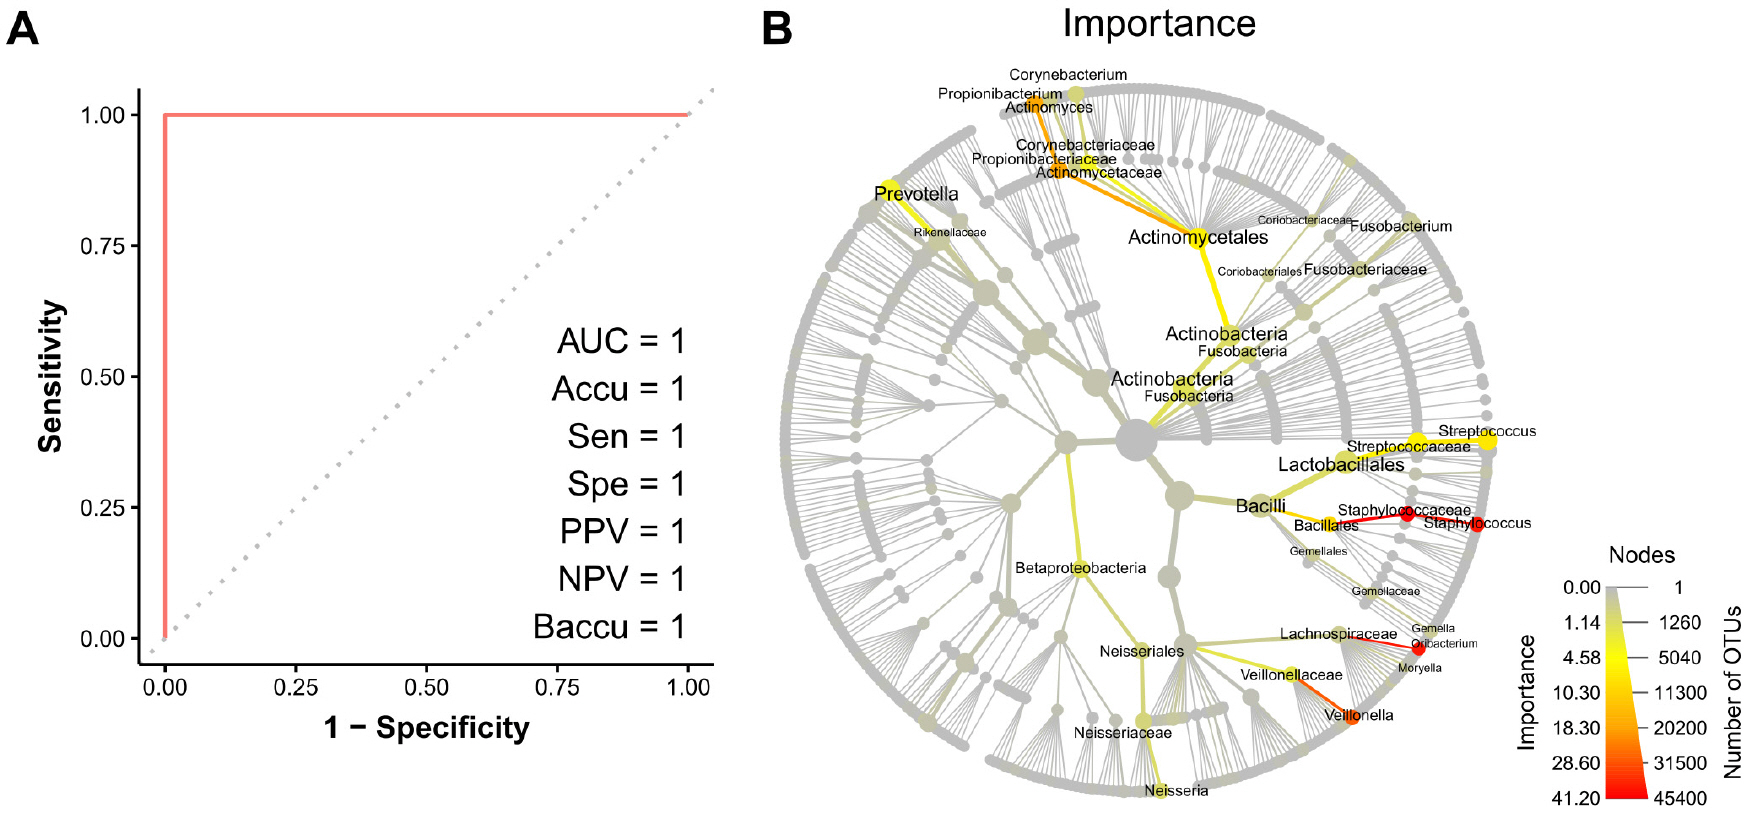 | Fig. 3Random forest prediction results. (A) Receiver Operating Characteristics curve. (B) Variable importance for the random forest prediction model. Node and edge sizes represent numbers of OTUs and samples, respectively. Node and edge colors represent variable importances. AUC, area under the curve; Accu, accuracy; Sen, sensitivity; Spe, specificity; PPV, positive predictive value; NPV, negative predictive value; Baccu, balanced accuracy; OTU, operational taxonomic unit.
|
Go to :
DISCUSSION
It remains unclear whether nose or throat sampling sites provide a better diagnosis in many upper respiratory infections, especially in novel infectious diseases (4, 5). However, samples collected from the nose and throat are not separately classified to diagnose most respiratory infections (1, 2, 3). Therefore, this study aimed to produce a post-hoc model that could predict the sampling sites used to obtain upper respiratory swab specimens based on the microbiomes present.
Microbial abundance data in samples obtained at anterior nares or throats of 576 healthy volunteers that participated in the HMP was used for the prediction model development. Predominant bacterial compositions in nose and throat samples largely overlapped, as shown in Fig. 2A and B. Thus, both sample types contained similar types of bacteria and differed only in abundance. Staphylococcus, Haemophilus, and Neisseria were relatively abundant in nose swab samples and Streptococcus, Fusobacterium, and Prevotella predominated in throat samples, which was in agreement with previous studies (Fig. 2C) (6). No predominant bacteria were found to be useful for differentiating nose and throat samples. However, as shown by the PCA plot (Fig. 2D), the two sample types were clearly divided into different clusters, which showed sampling sites could be predicted based on bacterial abundances.
Microbiome data was high-dimensional, and thus, supervised machine learning was used to find the best combination of taxa abundances to predict sampling sites. Decision trees have the advantage of being able to generate predictive rules that are more comprehensible than other supervised machine learning methods, and have the advantage of enabling the simple identification of variables of importance in predictive models. The RF approach (a decision tree-based method), which was believed to have best predictive accuracy (12), was used first. Prediction of sampling sites using the RF model was perfect on the test set of 115 specimens (Fig. 3A). However, as shown in the variable importance plot (Fig. 3B), the RF model required the abundances of many taxa as input to enable prediction, and thus, from the perspectives of cost and the effort required, this model did not serve the purpose of this study. Therefore, the RPART approach was used to create a clinically more intuitive predictive model. The final predictive model generated using the RPART approach was shown in Fig. 4A, and this model predicted was found to predict sampling locations using the abundances of only two taxa, which was a practical proposition. Somewhat surprisingly, the simple RPART predictive model devised achieved almost perfect predictive performance (Fig. 4B), and only incorrectly ascribed a single nose sample among 115 cases. Its AUC, accuracy, specificity, PPV, and balanced accuracy exceeded 0.98, and its sensitivity and NPV were both one. The bacteria selected as predictors in the RPART model were Staphylococcus and Streptococcus. It is known that the nose and throat are the important colonization site for Staphylococcus and Streptococcus, respectively, but they are not exclusively present in these locations (Fig. 2 A and B) (13, 14). Nevertheless, by comparing the abundances of these two bacteria, it was possible to distinguish where samples were obtained.
Upper respiratory swab specimens are mainly obtained using AN, NP, and OP swabs, but it is a limitation of the present study that only samples obtained from AN and OP were included. Considering that the NP is anatomically located between the AN and OP in the upper respiratory tract, the AN vs NP or OP vs NP prediction issue is expected to be more difficult than the AN vs OP classification problem, this study suggests that research be conducted to develop a model that can differentiate these three locations.
In conclusion, this study showed that abundances of Staphylococcus and Streptococcus could be used to predict the anatomic sites used to obtain upper respiratory swab specimens, and that the results obtained could be used to determine the sampling sites of upper respiratory specimens.
Go to :
 XML Download