

 PDF
PDF Citation
 Print
Print


INTRODUCTION
Type 1 diabetes mellitus (T1DM) is a chronic autoimmune disorder that is characterized by destruction of insulin-producing pancreatic islet β-cells. Although the exact number of individuals with T1DM worldwide is unknown, as many as approximately 78,000 youths are diagnosed with T1DM each year [1]. T1DM can cause serious complications including ketoacidosis, kidney failure, heart disease, stroke and blindness. Aside from its physical and social burdens, T1DM also incurs an estimated economic loss of $14.4 to 14.9 billion merely in the USA [2]. As a result, considerable efforts have been devoted to the discovery of biomarkers for T1DM, such as serum autoantibodies against β-cell antigens, HLA genes and several nongenetic markers, that are expected to either predict the onset/progression of T1DM or aid in diagnosing the asymptomatic stage of this disease [3]. However, all these biomarkers have major limitations in terms of specificity at risk identification, early diagnosis prior to full-blown autoimmunity and assessment of therapeutic outcomes [4]. Therefore, it is urgently needed to identify novel biomarkers that are associated with initiation and progression of T1DM.
Circular RNAs (circRNAs) are a class of non-coding RNA transcripts that is characterized by covalent bonding between 3′ and 5′ ends, generating an unique enclosed structure [5]. Although the majority of circRNAs still lack functional significance, some are known to regulate gene expression by acting as microRNA (miRNA) sponges, nuclear transcription regulators and messenger RNA (mRNA) splicing competitors [6]. The high biological stability of circRNAs is a prerequisite for their usage as clinical biomarkers. Indeed, certain circRNAs are involved in numerous physiological and pathological events, such as brain development [7], Alzheimer disease [8], epithelial-to-mesenchymal transition [9], and atherosclerosis [10]. Markedly, many circulating circRNAs are differentially expressed in patients with type 2 diabetes mellitus (T2DM) [11], wherein hsa_circ0054633 has been proposed as a diagnostic biomarker of pre-diabetes and T2DM [12]. However, the expression profile and clinical significance of circRNAs in T1DM have remained unknown.
Given the urgent need for novel biomarkers for T1DM and the potential diagnostic values of circRNAs, we performed the current study to identify differentially expressed plasma circRNAs and to explore their roles in new onset T1DM.
METHODS
Human subjects
This study was reviewed and approved by the Institutional Ethics Review Board of the Second Hospital of Jilin University (Approval ID: 2013-009). Written and informed consents were obtained from legal guardians of participants in accordance with the Declaration of Helsinki. Specifically, six subjects were recruited for the microarray study: three patients with newly diagnosed T1DM and three age-/gender-matched healthy controls (Table 1). For the validation study, we recruited another 12 patients with new-onset T1DM by the same criteria as used in microarray and another 12 age-/gender-matched healthy controls (Table 1). All participants were Han Chinese that aged between 5 to 18 years old. Patients' state of T1DM was determined by the diagnostic criteria from American Diabetes Association [13] and by the World Health Organization reports on the classification of diabetes [14]. Specifically, they were positive for at least one islet autoantibody (glutamic acid decarboxylase autoantibodies [GADA], insulinoma associated-2 autoantibodies [IA–2A], and zinc transporter-8 autoantibodies [ZnT8A]), had little fasting serum C-peptide (measured by radioimmunoassay), showed complete β-cell loss during follow-up visits and required exogenous insulin therapy. Diminished secretion capacity of β-cells was confirmed by a 2-hour oral glucose tolerance test, whereby patients were fasted for at least 10 hours before ingestion of glucose (1.75 g/kg or a maximum of 75 g of glucose). Blood samples were obtained at 0 (fasting level), 30, 60, and 120 minutes after glucose administration for C-peptide measurements. Participants receiving any types of drug interventions, including nonsteroidal anti-inflammatory drugs, disease modifying anti-rheumatic drugs, glucocorticoids and immune suppressants, or those with severe liver or kidney diseases, were excluded.
Table 1.
Characteristics and demographics of human participants
| Characteristic |
Microarray screening |
qRT-PCR validation |
||
|---|---|---|---|---|
| Control (n=3) | T1DM (n=3) | Control (n=12) | T1DM (n=12) | |
| Age, yr | 16 (12–18) | 15 (12–17) | 12.6 (6–18) | 12.8 (5–17) |
| Gender, female/male | 0/3 | 2/1 | 6/6 | 7/5 |
| Disease duration, mo | - | 3.7±2.1 | - | 3.0±1.9 |
| HbA1c, % | 5.6±0.1 | 9.7±0.8 | 5.4±0.4 | 9.9±1.2 |
| Subjects positive for ≥1 islet Aba | 0 | 3 | 0 | 12 |
| Serum C-peptide during OGTT, ng/mLb | ||||
| 0 min | - | 0.16±0.15 | - | 0.19±0.18 |
| 60 min | - | 0.21±0.18 | - | 0.39±0.37 |
| 120 min | - | 0.3±0.41 | - | 0.54±0.38 |
Values are presented as median (range) or mean±standard deviation.
qRT-PCR, quantitative real-time polymerase chain reaction; T1DM, type 1 diabetes mellitus; HbA1c, glycosylated hemoglobin; Ab, autoantibody; OGTT, oral glucose tolerance test.
![]()
RNA extraction, sample preparation, and microarray hybridization
Total RNA was isolated from human plasma using TRIzol LS reagent according to manufacturer's instructions (Invitrogen, Carlsbad, CA, USA). Integrity and concentrations of total RNA samples were determined by NanoDrop ND-1000 before sending to KangChen Biotech (Shanghai, China) to perform Arraystar Human circRNA Microarray. All experimental procedures of microarray were conducted according to a standard protocol provided by the company.
Microarray data analysis
Scanned images were imported into Agilent Feature Extraction software for raw data extraction. Quantile normalization of raw data and subsequent data processing were performed using the R software limma package (R Foundation for Statistical Computing, Vienna, Austria). Fold-change and P value between T1DM and healthy controls were calculated by ratio of group means and t-test, respectively. Differentially expressed circRNAs were defined as having fold-change ≥2 and P<0.05, and were displayed in volcano plot. Hierarchical clustering was also created to visualize patterns of circRNA expression between T1DM and healthy controls. The raw data supporting the conclusions of this manuscript will be made available by the authors, without undue reservation, to any qualified researchers.
Prediction of miRNA response elements
The circRNA:miRNA interaction was predicted with Arraystar's home-made miRNA target prediction software based on TargetScan & miRanda. Differentially expressed circRNAs were annotated in detail with the information of their interacting miRNAs.
Quantitative real-time polymerase chain reaction validation
Total plasma RNA (free of RNase treatment) were reversely transcribed by SuperScript III reverse transcriptase according to the supplier's protocol (Invitrogen). Then quantitative real-time polymerase chain reaction (qRT-PCR) was performed on ViiA 7 Real-time PCR System machine (Applied Biosystems, Foster City, CA, USA) using HieffTM SYBR green assay kit (Yeasen, Shanghai, China). Specific divergent primers were designed to amplify the circular transcripts. PCR reaction settings included an initial stage at 95℃ and 60℃ for 60 seconds, and finally melting curve analysis. All the results were first normalized to β-actin, quantified by the 2−ΔΔCt method and expressed as fold-change over healthy controls. Details of all the primers are summarized in Supplementary Table 1.
Construction of the circRNA-miRNA-mRNA network
Downstream mRNAs targeted by circRNA-interacting miRNAs were predicted by TargetScan 7.2 software, wherein mRNAs with cumulative weighted context++ scores lower than −0.4 were selected as putative candidates. To further elucidate relations among the four validated circRNAs, their interacting miRNAs and the predicted downstream mRNAs, a circRNA-miRNA-mRNA network was constructed and displayed via Cytoscape 3.6.1. For the convenience of viewing, only mRNA candidates with higher stringency (cumulative weighted context++ scores lower than −0.7) were used to generate the network.
GO and KEGG analyses
To further explore functions of those four validated circRNAs, their predicted downstream target mRNAs were submitted and annotated by the Database for Annotation, Visualization and Integrated Discovery bioinformatic tool (DAVID; http://david.abcc.ncifcrf.gov/) for Gene Ontology (GO) enrichment analysis that includes three terms: biological processes (BP), cellular component (CC), and molecular function (MF), and for the Kyoto Encyclopedia of Genes and Genomes (KEGG) analysis that identifies altered pathways potentially mediated by dysregulated circRNAs in T1DM.
Statistical analysis
Microarray data were first analyzed by t-test, then corrected for false discovery rate by Benjamini Hochberg. The qRT-PCR validation data were expressed as mean±standard error of the mean. Two-tail Student t-test was used for data analysis by GraphPad Prism. P<0.05 was considered to be statistically significant.
RESULTS
Identification of differentially expressed plasma circRNAs by new onset T1DM
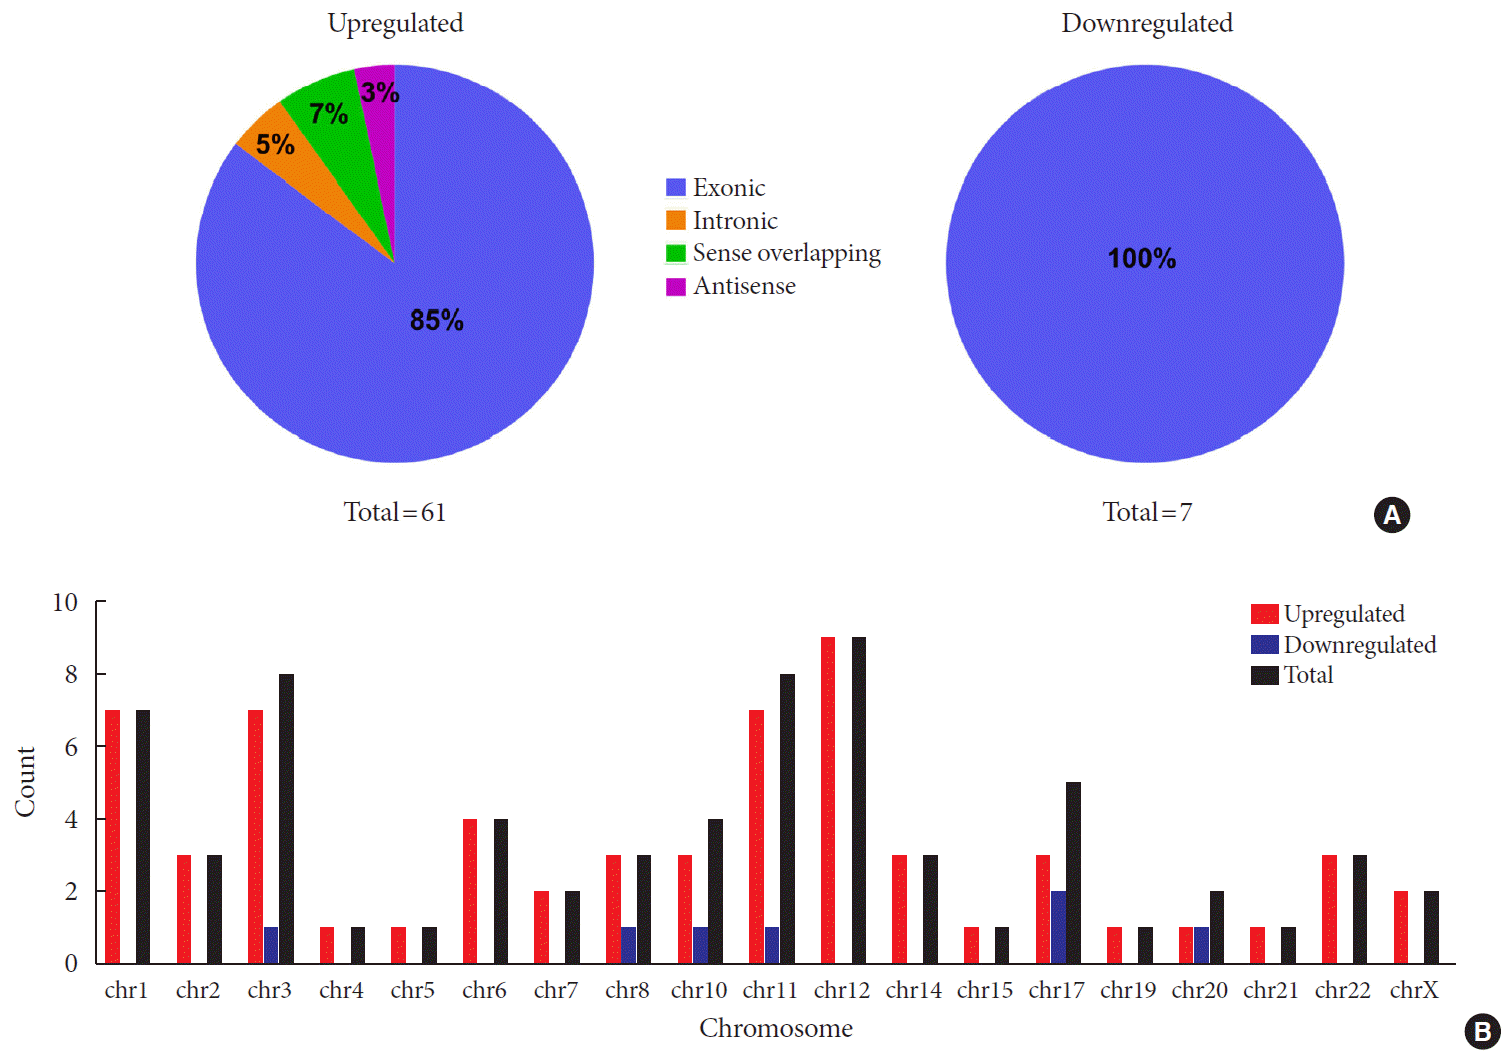
To identify differentially expressed plasma circRNAs, we performed Arraystar Human circRNA Array analysis in three patients with new onset T1DM and three age-/gender-matched healthy controls (Table 1). A total of 8,124 circRNAs were detected (data available upon request). Box plots showed that distributions of circRNA expression intensities were virtually the same across all the six samples after normalization, indicating highly comparable datasets with similar global expression patterns (Fig. 1A). Scatter plot provided an overview of circRNAs with an absolute fold-change ≥2, which are indicated by data points lying beyond the upper and bottom threshold lines (Supplementary Fig. 1). Among those circRNAs, 68 were considered differentially expressed with P<0.05 and are depicted in the Volcano plot, wherein 61 and 7 were up- and down-regulated, respectively (Fig. 1B). These differentially expressed circRNAs are also detailed in Supplementary Table 2. A heatmap was constructed to visualize these circRNAs and showed distinguishable expression patterns between the two groups (Fig. 1C). Further classification of differential circRNAs based on their genomic origins showed that the upregulated circRNAs included 85% exonic, 5% intronic, 7% sense overlapping, and 3% antisense. In contrast, all the downregulated circRNAs were exonic (100%) (Fig. 2A). We also summarized distributions of differential circRNAs across human chromosomes (Fig. 2B). Together, our results demonstrated an altered expression profile of plasma circRNAs during new onset T1DM.

Fig. 1
Overview of differentially expressed plasma circular RNAs (circRNAs) identified in patients with newly diagnosed type 1 diabetes mellitus (T1DM) by microarray. (A) The box plot shows intensity distribution of expressed circRNA across all the samples after normalization. The central line within each box represents the median of the data, whereas the error bars represent the upper and lower quartiles. (B) Volcano plots show differentially expressed plasma circRNAs with fold-change greater than 2 and P value less than 0.05 between control and T1DM subjects. The upwards and downwards arrows indicate up- and down-regulated circRNA clusters, respectively. (C) Hierarchical cluster analysis (heat map) for visualizing differentially expressed circRNAs, wherein red and green colors denote high and low expression levels, respectively. C1–C3, healthy controls; D1–D3, T1DM patients.
![]()
Validation of differentially expressed circRNAs by qRT-PCR
Most of our differentially expressed circRNAs were upregulated. Besides, changes of all the downregulated ones were less significant in terms of fold-change and P values. Therefore, we focused on upregulated circRNAs and randomly selected six candidates with highest magnitude of fold-change for further analysis. We first validated them by qRT-PCR using independent plasma samples from another 12 patients with new onset T1DM and 12 age-/gender-matched healthy controls (Table 1). Intriguingly, four circRNAs (hsa_circRNA_101062, hsa_circRNA_100332, hsa_circRNA_085129, and hsa_circRNA_103845) were significantly upregulated again, while changes of one circRNA (hsa_circRNA_005178) did not reach statistical significance (Fig. 3). The other circRNA (hsa_circRNA_059571) was under detection (data not shown). Specificity of qPCR products was confirmed by electrophoresis that showed a single distinct band (Supplementary Fig. 2). In summary, qRT-PCR validation results demonstrated a good consistency with those of microarray, confirming a high reliability of our microarray dataset.
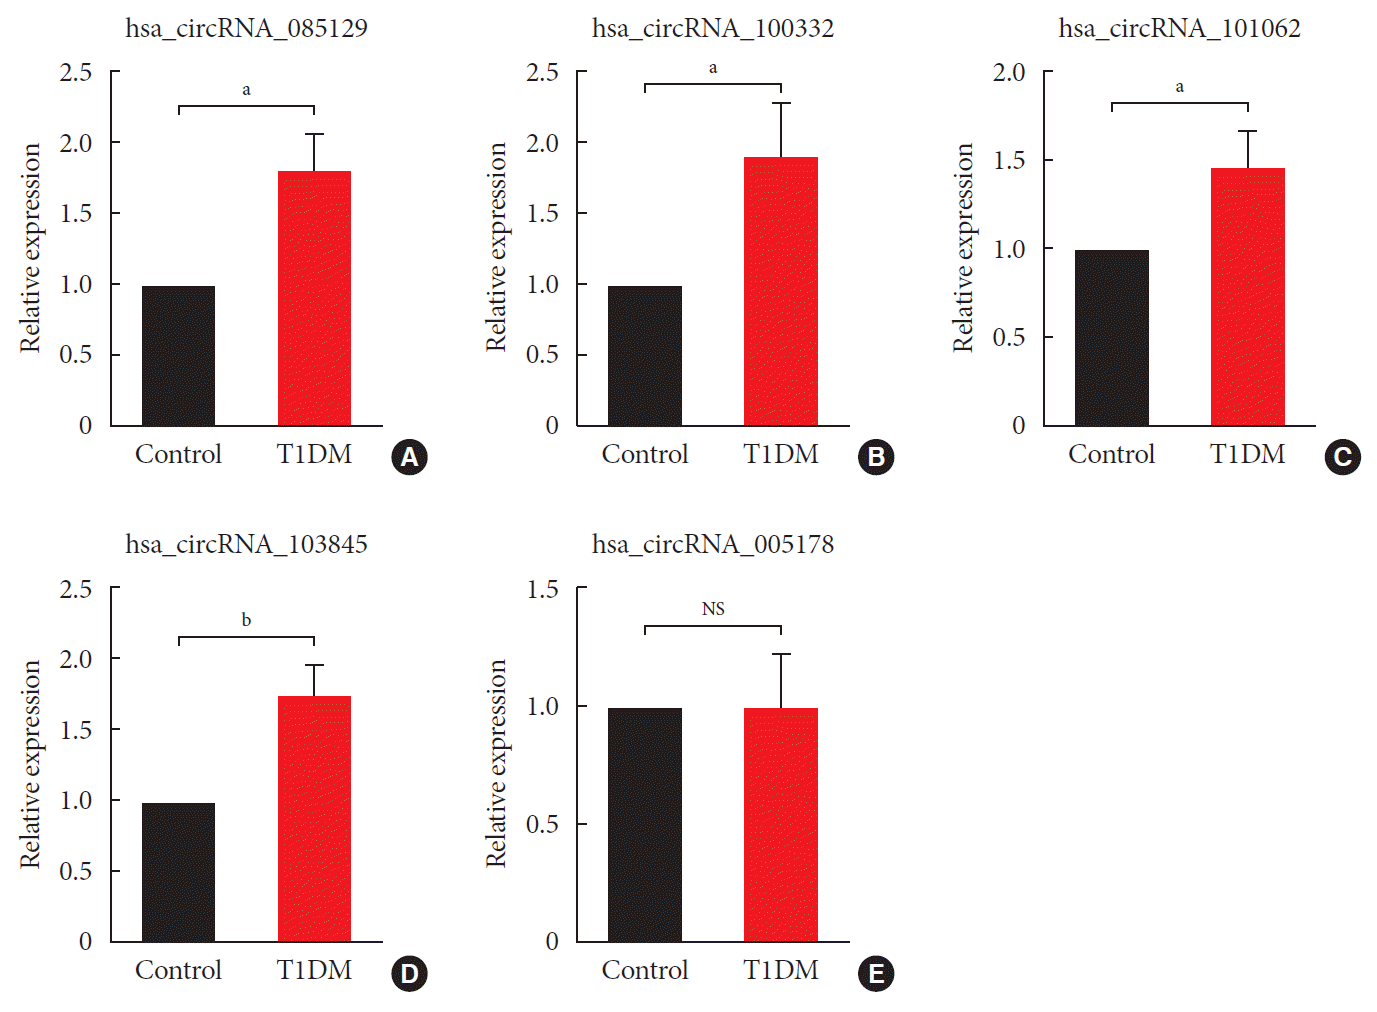
Fig. 3
Verification of microarray data by quantitative real-time polymerase chain reaction. Using independent human samples, our results confirmed that hsa_circular RNA (circRNA)_085129 (A), hsa_circRNA_100332 (B), hsa_circRNA_101062 (C) and hsa_circRNA_103845 (D) were all upregulated in type 1 diabetes mellitus (T1DM). However, expression of hsa_circRNA_005178 (E) remained unchanged. circRNA, circular RNA. Data are expressed as fold-change over healthy controls and represented as the mean±standard error (n=12). NS, not significant. aStatistically significant difference (P<0.05), bStatistically significant difference (P<0.01).
![]()
Prediction of miRNA response elements in differentially expressed circRNAs
CircRNAs interact via intrinsic miRNA response elements (MREs) with complementary miRNAs to control the function of target mRNAs. To find these miRNAs, we used Arraystar's homemade miRNA target prediction software based on TargetScan & miRanda to predict circRNA/miRNA interaction. A total of 340 MREs (five per circRNA) were identified within all differential circRNAs (Supplementary Table 3). Then we focused on the four experimentally validated circRNAs to further explore their biological functions. Their most likely 20 complementary miRNAs are summarized in Supplementary Table 4. Detailed annotation of circRNA/miRNA interaction included depicted MRE sequence, the target miRNA seed type and 3′ pairing sequence in “2D structure” column. The “local AU” column presented compositions of A/U (red bars) and G/C (black bars) contents of 30 nucleotides upstream and downstream of the seed sequence. Height of the bars indicated extent of accessibility. The “Position” column showed position of MREs in the linear form of circRNA (Supplementary Figs 3 and 4). Remarkably, literature-based curation revealed a number of these predicted miRNAs to be implicated in normal immune response and/or pathogenesis of other autoimmune diseases (Supplementary Table 5), many of which share co-morbidity with T1DM. In summary, our results supported a tight association of these differential circRNAs with the pathogenesis of T1DM.
Construction of circRNA-miRNA-mRNA network
To better understand functions of the four validated circRNAs, using TargetScan 7.2 program we predicted the downstream targets of their complementary miRNAs and identified a total of 1,827 unique mRNAs (Data available upon request). Then, a circRNA-miRNA-mRNA network was constructed to reveal the relations among validated circRNAs, miRNAs and representative target mRNAs (Fig. 4). Markedly, hsa-miR-660-3p had the largest number of downstream target genes and hsa-miR-612 exhibited the most interactions with other circRNA clusters, suggesting that hsa_circRNA_101062 may serve as a hub regulator in the network by acting upstream of these two miRNAs.
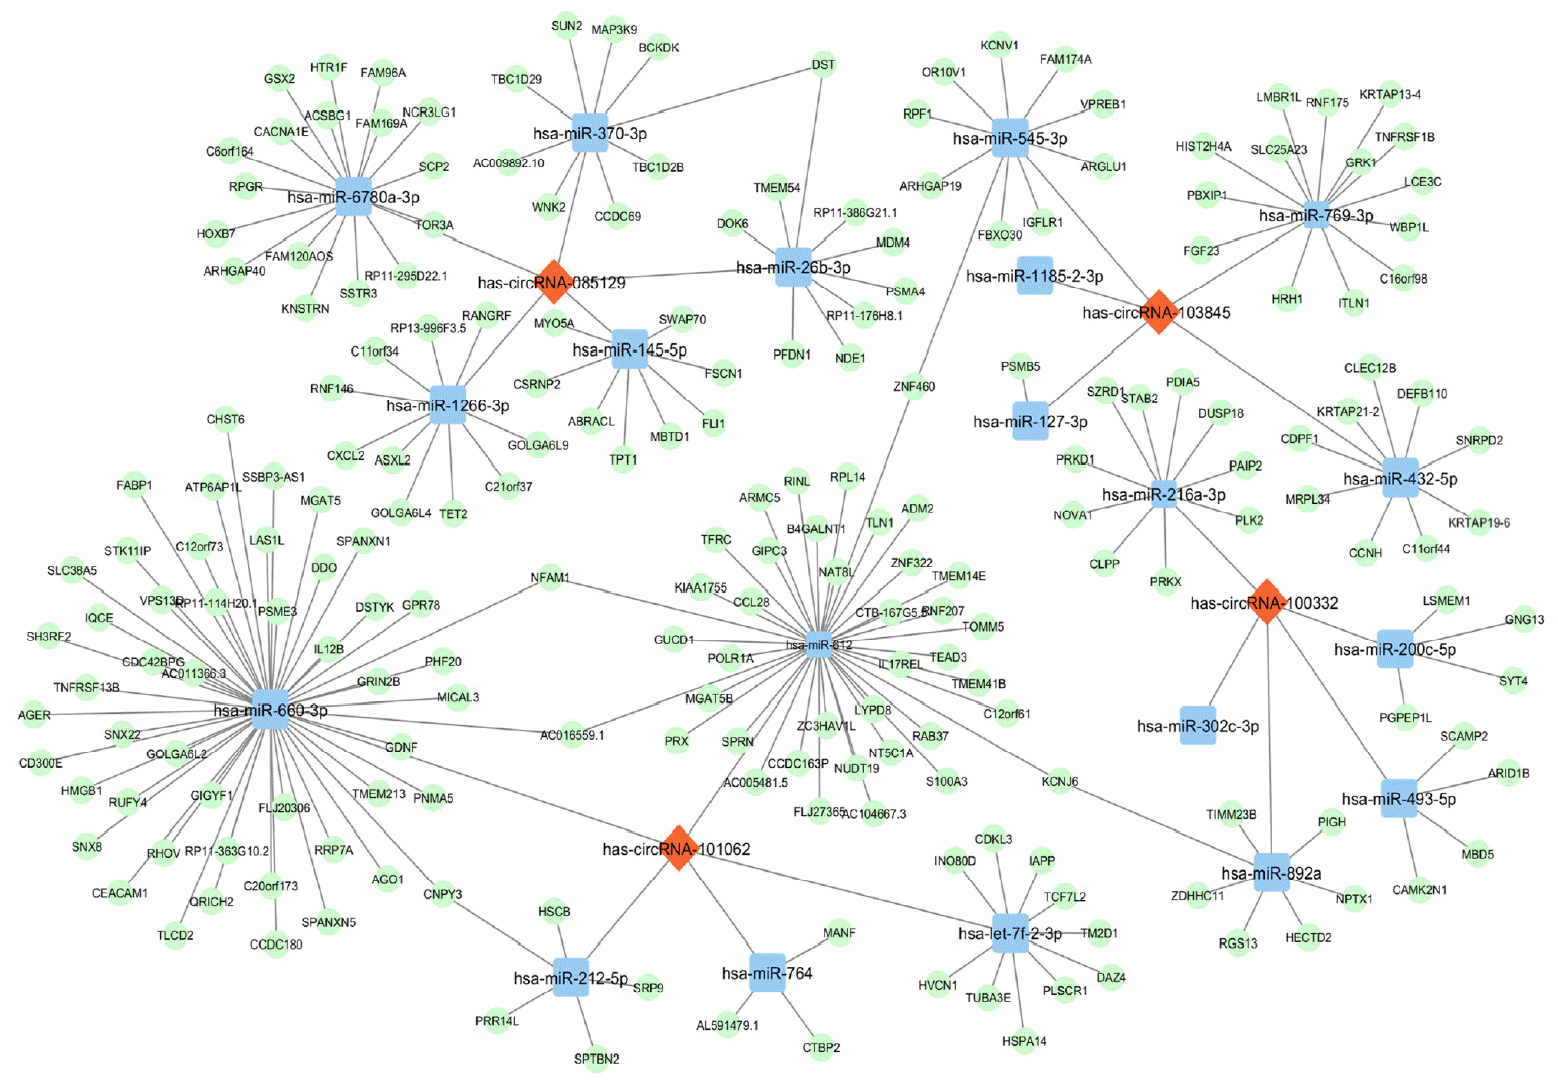
Fig. 4
The circular RNA (circRNA)-microRNA (miRNA)-messenger RNA (mRNA) network for the validated four circRNAs. Each circRNA interacts with its five miRNA response elements (MREs) and representative downstream mRNAs. For the convenience of visualization, only mRNAs with cumulative weighted context++ score no more than −0.7 were included. Specifically, hsa-miR-660-3p had the largest number of downstream target genes and hsa-miR-5189-5p exhibited the most interactions with other circRNA clusters. Red diamonds, circRNAs. Blue squares, miRNAs. Green ovals, mRNAs.
![]()
GO and KEGG pathway analyses
To further explore the significance of our microarray data, we performed GO and KEGG analysis using the 1,827 predicted target mRNAs. For GO analysis, results were sorted by enrichment scores and top five terms of each category (BP, CC, MF) were displayed (Fig. 5A). Specifically, the top five enriched terms of BP analysis included positive regulation of protein insertion into mitochondrial membrane involved in apoptotic signaling pathway, exocytosis, axon extension involved in axon guidance, negative regulation of proteasomal protein catabolic process and leukocyte activation involved in immune response. The CC analysis suggested actomyosin, condensed chromosome kinetochore, cell junction, integral component of mitochondrial inner membrane and integral component of synaptic vesicle membrane as the top five enriched terms. In MF analysis, protein binding, phosphatidylinositol-4-phosphate binding, phosphatidylinositol-5-phosphate binding, beta-catenin binding and phosphatidylinositol-3-phosphate binding were identified as the top five enriched terms. For KEGG analysis, results were ranked according to their enrichment scores and the top 10 pathways were listed (Fig. 5B), among which cytokine-cytokine receptor interaction, GAB-Aergic synapse, retrograde endocannabinoid signaling, Wnt signaling pathway and influenza A were the top five pathways. Importantly, we identified cytokine-cytokine receptor interaction as the most significantly altered pathway that is critical for pathogenesis of T1DM [15]. Overall, functional annotations revealed possible mechanisms underlying the inflammatory state of T1DM and supported the use of our differentially expressed circRNAs as potential diagnostic biomarkers.
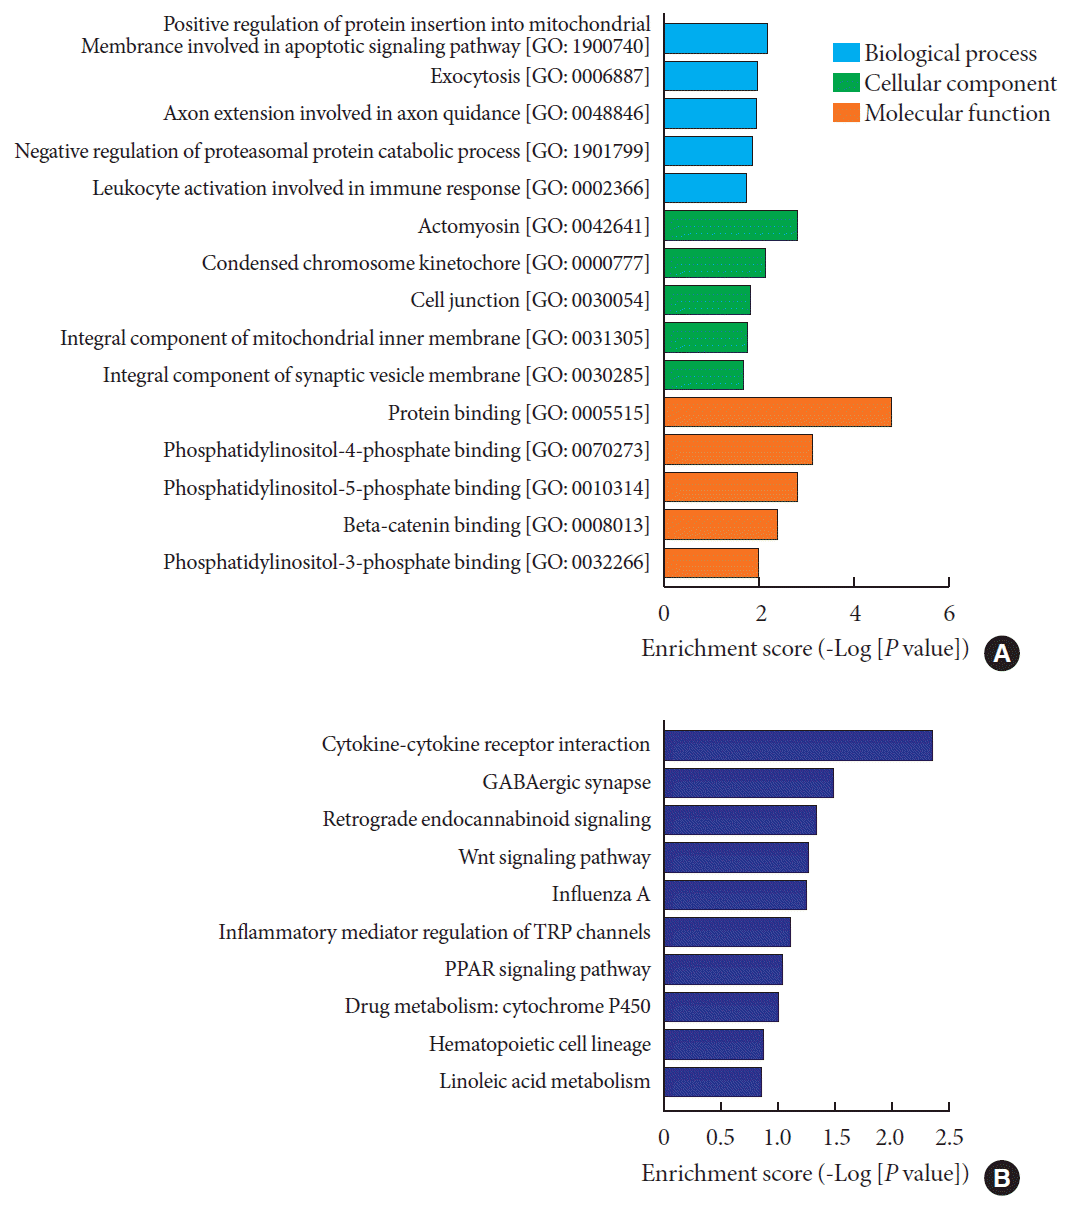
Fig. 5
Gene Ontology (GO) enrichment and Kyoto Encyclopedia of Genes and Genomes (KEGG) pathway analysis using predicted target messenger RNAs (mRNAs) of validated four circular RNA (circRNA). (A) GO enrichment analysis comprises three categories: biological process (in blue), cellular component (in green) and molecular function (in orange). Top five terms of each category are displayed. (B) KEGG pathway analysis shows top 10 terms that may be involved in the regulatory network mediated by differentially expressed circRNAs in type 1 diabetes mellitus.
![]()
DISCUSSION
T1DM still remains as a dreadful threat to human health with a continually rising prevalence worldwide, despite enormous efforts dedicated for the search of therapeutic strategies. To better understand the precise mechanisms underlying T1DM and to promote discovery of novel biomarkers, here we studied the differential expression profile of plasma circRNAs via microarray in patients with new onset T1DM and healthy controls. Specifically, we detected a total of 8,214 distinct circRNAs, out of which 68 were considered significantly altered by T1DM, with 61 and seven being up- and down-regulated, respectively. Next, four upregulated circRNAs with highest magnitude of fold-change (hsa_circRNA_101062, hsa_circRNA_100332, hsa_circRNA_085129, and hsa_circRNA_103845) were confirmed by qRT-PCR in independent human plasma samples. Functional annotations by GO and KEGG pathway analyses provided novel insights to better understand the pathogenesis of T1DM. To our knowledge, this is the first report demonstrating a differential expression profile of plasma circRNAs that are potentially associated with the onset of T1DM.
Since circRNAs function as sponges to sequester complementary miRNAs [5], we performed literature-based curation on the 20 predicted complimentary miRNAs (Supplementary Table 5) and revealed many of them to be implicated in normal immune responses and pathogenesis of several autoimmune diseases [16171819]. For example, hsa-miR-892a targeted by hsa_circRNA_100332, is downregulated in CD4+ T cells during the inflammatory transition from latent to active tuberculosis [20]. Moreover, hsa-miR-145-5p targeted by hsa_circRNA_085129, ameliorates the inflammatory status of macrophages by inhibiting secretion of inflammatory factors [21]. Finally, hsa-miR-127-3p targeted by hsa_circRNA_103845, is downregulated by lipopolysaccharide (LPS) and may participate in LPS-triggered development of T1DM [22]. Therefore, our observed upregulation of all the upstream circRNAs predicts a pro-inflammatory state that potentially underlies etiology of T1DM.
Interestingly, many of the predicted complimentary miRNAs are potentially associated with other autoimmune disorders that share strong comorbidities with T1DM. One example of such disorders is celiac disease wherein hsa-miR-212-5p, hsa-miR-26b-3p, hsa-miR-145-5p, and hsa-miR-432-5p are all dysregulated. Furthermore, hsa-miR-200c-5p, hsa-miR-145-5p, hsa-miR-769-3p, and hsa-miR-127-3p are all implicated in the development of inflammatory bowel disease. Previous studies showed that hsa-miR-892a is dysregulated in rheumatoid arthritis [23], and that hsa-miR-493-5p and hsa-miR-145-5p are proposed as biomarkers for multiple sclerosis [24]. Finally, islet specific miRNAs such as hsa-miR-493-5p and hsa-miR-127-3p are tightly associated with insulin biosynthesis and secretion. In keep, our findings predicted these two miRNAs to be inhibited, possibly reflecting a destruction state of β-cells in the context of T1DM. In summary, our findings are consistent with the theory that T1DM is frequently associated with other organ-specific autoimmune diseases [25].
Two of the complementary miRNAs, hsa-miR-432-5p and hsa-miR-145-5p, were predicted to be sponged by hsa_circRNA_103845 and hsa_circRNA_085129, respectively. Consequent inhibition of these two miRNAs seems paradoxically to ameliorate the overt inflammatory status in T1DM by reducing production of inflammatory cytokines [2627]. This discrepancy may be partially explained by the fact that different sample sources were analyzed in each study. Indeed, we used human plasma samples whereas one of the contradictory studies used THP-1 monocyte cell line [27]. Alternatively, cytokines stimulated by these two miRNAs may regulate (i.e., suppress) autoimmune responses that would otherwise result in β-cell destruction. In all, the exact role of hsa-miR-432-5p and hsa-miR-145-5p in the pathogenesis of T1DM remains undetermined and warrants further investigation.
Our results do not exclude the possibility that circRNAs exert their diabetogenic effects in an miRNA sponge-independent manner. In fact, only a few reported candidate circRNAs might function as miRNA sponges, not to mention none of them has yet been validated. Some circRNAs can regulate gene expression by affecting transcription [5]. For example, some nuclear circRNAs interact with the elongating Pol II complex and promotes Pol II-dependent transcription of ankyrin repeat domain 52 (ANKRD52) and sirtuin 7 (SIRT7) genes. Another potential function of circRNAs could be to compete with mRNA splicing, as in the case of muscleblind (MBL) gene. Unfortunately, direct evidence for the regulatory effect of circRNA on T1DM still lacks.
The biological functions of our four validated circRNAs were predicted by GO and KEGG pathway analyses through interrogating downstream mRNAs (data available upon request), which were targeted by the 20 complementary miRNAs. Identified among the top GO terms were mitochondria-dependent apoptotic pathway (BP term) and integral component of mitochondrial inner membrane (CC term), supporting the hypothesis that mitochondria-mediated apoptosis is the main mode of β-cell death in the early stage of T1DM [28]. Besides, binding of multiple phosphoinositides, such as phosphatidylinositol-4-phosphate, phosphatidylinositol-5-phosphate and phosphatidylinositol-3-phosphate, were identified as top MF terms. These findings agree with phosphoinositides as required stimuli of novel protein kinase C isoforms (δ, ε, ζ, θ) to promote activation of immune cells and subsequent development of autoimmune diseases [29303132]. Notably, we identified beta-catenin binding among the top GO MF terms and concomitantly Wnt signaling pathway as one of the top dysregulated KEGG pathways. Therefore, our findings are consistent with the reported modulatory role of Wnt/β-catenin signaling in inflammatory responses and autoimmunity [3334].
Several significantly enriched GO terms and KEGG pathways are closely related to immune functions, such as cytokine-cytokine receptor interaction, inflammatory mediator regulation of transient receptor potential (TRP) channels and leukocyte activation involved in immune response. Indeed, a variety of cytokines are highly expressed in the insulitis lesion of autoimmune diabetes-prone rodent models, as well as in the pancreas of humans with T1DM [15]. Previous studies showed that some TRP channels regulate multiple biological functions such as insulin secretion out of pancreatic beta cells, neurotransmitter release and ion homeostasis, and are implicated in many inflammatory (autoimmune) diseases [3536]. Markedly, as the key regulator of autoimmune diseases, activated leukocytes are dominant in the initiation and progression of T1DM [37]. This stage of T1DM, characterized by β-cell destruction mediated by infiltrating T cells, can persist long before overt hyperglycemia occurs. Therefore, our differential circRNAs may represent such scenario and serve as potential biomarkers to diagnose this asymptomatic stage. Taken together, GO and KEGG annotations revealed possible mechanisms underlying the autoimmune nature of T1DM and corroborated circRNA-mediated regulatory network in the pathogenesis of T1DM.
In conclusion, we report for the first time a differential expression profile of plasma circRNA between patients with new onset T1DM and healthy controls. Bioinformatics analyses predicted downstream targets of validated circRNAs and revealed possible mechanisms associated with T1DM pathogenesis. Study of circRNAs in body fluids such as peripheral blood is crucial for discovering novel biomarkers noninvasively for T1DM diagnosis and treatment. Hence, our findings carry significant clinical benefits for the care of T1DM patients. However, one limitation of the current study is the lack of systematic investigation of their function experimentally. Also, we admit the association between our candidate circRNAs and stage 1 or 2 pre-symptomatic T1DM awaits exploration [38]. Thus, future studies, both in vivo and in vitro, are urgently needed to elucidate function of differential circRNAs during the initiation and progression of T1DM, eventually aiding with disease early prediction as well as conceptualization of therapeutic interventions.
 XML Download