

 PDF
PDF Citation
 Print
Print


INTRODUCTION
METHODS
Study population
Demographic, physical, and laboratory measurements
Renal function measurement
Measurement of cytokine levels
Statistical analysis
RESULTS
Baseline characteristics of study participants
Table 1.
| Characteristic | All (n=452) | Non-decliners (n=370) | Rapid decliners (n=82) | P value |
|---|---|---|---|---|
| Age, yr | 52.6±9.2 | 51.8±9.1 | 55.9±9.3 | <0.001 |
| Male sex | 313 (69.2) | 255 (68.9) | 58 (70.7) | 0.850 |
| Diabetes duration, yr | 5.6±5.1 | 5.4±4.9 | 6.4±5.8 | 0.171 |
| BMI, kg/m2 | 25.5±3.1 | 25.5±3.2 | 25.6±2.8 | 0.809 |
| WC, cm | 88.3±7.5 | 88.2±7.6 | 88.3±7.1 | 0.902 |
| SBP, mm Hg | 124.5±14.1 | 124.1±13.6 | 126.4±16.2 | 0.253 |
| DBP, mm Hg | 77.5±10.0 | 77.5±9.9 | 77.6±10.6 | 0.893 |
| Hypertension | 181 (40.0) | 148 (40.3) | 33 (40.2) | 1.000 |
| Dyslipidemia | 128 (28.3) | 107 (29.5) | 21 (25.6) | 0.573 |
| CVD | 17 (3.8) | 16 (6.6) | 1 (1.8) | 0.279 |
| Diabetic retinopathy | 11 (2.4) | 10 (4.2) | 2 (3.9) | 0.896 |
| HbA1c, % | 7.9±1.7 | 7.9±1.7 | 7.9±1.5 | 0.828 |
| FPG, mg/dL | 150.0±48.6 | 151.5±49.8 | 143.7±42.3 | 0.189 |
| PP2 glucose, mg/dL | 279.6±99.4 | 281.9±100.2 | 269.2±95.9 | 0.434 |
| HOMA-IR, unit | 2.9 (1.6 to 4.4) | 2.7 (1.6 to 4.4) | 2.9 (2.0 to 4.1) | 0.537 |
| Total cholesterol, mg/dL | 184.6±40.2 | 182.0±38.6 | 196.4±44.9 | 0.003 |
| Triglyceride, mg/dL | 168.6±114.5 | 168.1±112.0 | 170.8±125.6 | 0.847 |
| HDL-C, mg/dL | 47.1±10.3 | 46.8±10.0 | 48.1±11.8 | 0.349 |
| LDL-C, mg/dL | 121.7±36.5 | 120.3±35.1 | 127.8±41.6 | 0.135 |
| hs-CRP, mg/dL | 0.09 (0.05 to 0.19) | 0.1 (0.1 to 0.2) | 0.1 (0.1 to 0.2) | 0.953 |
| Albuminuria | 0.400 | |||
| Normoalbuminuria | 314 (69.5) | 252 (70.6) | 62 (75.6) | |
| Microalbuminuria | 114 (25.2) | 97 (27.2) | 17 (20.7) | |
| Macroalbuminuria | 11 (2.4) | 8 (2.2) | 3 (3.7) | |
| UACR, mg/g | 17.0 (9.7 to 37) | 18.0 (10.0 to 38.0) | 15.2 (8.9 to 29.0) | 0.164 |
| eGFR, mL/min/1.73 m2 | 85.8±14.9 | 84.8±14.9 | 90.2±14.2 | 0.003 |
| eGFR slope, %/yr | –2.0 (–3.5 to –0.6) | –0.9±1.9 | –5.8±2.9 | <0.001 |
| Diabetes medications | ||||
| Metformin | 330 (73.0) | 238 (71.9) | 92 (78.0) | 0.246 |
| Sulfonylurea | 207 (45.8) | 267 (72.8) | 63 (76.8) | 0.537 |
| TZD | 56 (12.4) | 169 (46.0) | 38 (46.3) | 1.000 |
| Insulin | 62 (13.7) | 50 (13.6) | 6 (7.3) | 0.168 |
| Use of statin | 148 (32.7) | 96 (31.0) | 52 (37.7) | 0.198 |
| Use of ACEi/ARB | 176 (38.9) | 50 (13.6) | 12 (14.6) | 0.950 |
| A-FABP, µg/L | 17.72 (11.88 to 25.51) | 17.2 (11.2 to 24.1) | 20.2 (14.1 to 29.9) | 0.005 |
| Men | 15.81 (10.82 to 21.40)a | 15.2 (10.5 to 21.1) | 17.5 (12.2 to 24.4) | 0.037 |
| Women | 23.11 (15.72 to 33.09)a | 22.1 (15.3 to 30.8) | 31.5 (20.7 to 50.7) | 0.007 |
| Total adiponectin, µg/mL | 3.9 (2.8 to 6.0) | 3.9 (2.8 to 6.1) | 3.9 (2.8 to 6.3) | 0.876 |
| HMW adiponectin, µg/mL | 1.2 (0.6 to 2.4) | 1.3 (0.6 to 2.4) | 1.3 (0.6 to 2.6) | 0.809 |
| Interleukin-6, pg/mL | 0.9 (0.5 to 1.5) | 0.9 (0.5 to 1.5) | 0.9 (0.7 to 1.3) | 0.179 |
| TNF-α, pg/mL | 1.2 (0.8 to 2.0) | 1.3 (0.8 to 2.0) | 1.2 (0.8 to 2.1) | 0.480 |
| PTX3, ng/mL | 1.3 (0.8 to 2.1) | 1.2 (0.8 to 2.2) | 1.4 (0.9 to 2.1) | 0.237 |
Values are presented as mean±standard deviation, number (%), or median (interquartile range). P values refer to the unpaired t test or the chi-square test (for categorical variables) between non-decliners and rapid decliners.
BMI, body mass index; WC, waist circumference; SBP, systolic blood pressure; DBP, diastolic blood pressure; CVD, cardiovascular disease; HbA1c, glycosylated hemoglobin; FPG, fasting plasma glucose; PP2, 2-hour postprandial; HOMA-IR, homeostatic model assessment of insulin resistance; HDL-C, high-density lipoprotein cholesterol; LDL-C, low-density lipoprotein cholesterol; hs-CRP, high-sensitivity C-reactive protein; UACR, urine albumin creatinine ratio; eGFR, estimated glomerular filtration rate; TZD, thiazolidinedione; ACEi, angiotensin-converting-enzyme inhibitor; ARB, angiotensin II-receptor blocker; A-FABP, adipocyte fatty acid-binding protein; HMW, high molecular weight adiponectin; TNF-α, tumor necrosis factor-α; PTX3, pentraxin-3.
![]()
Levels of serum A-FABP and other cytokines according to the presence of rapid renal function decline
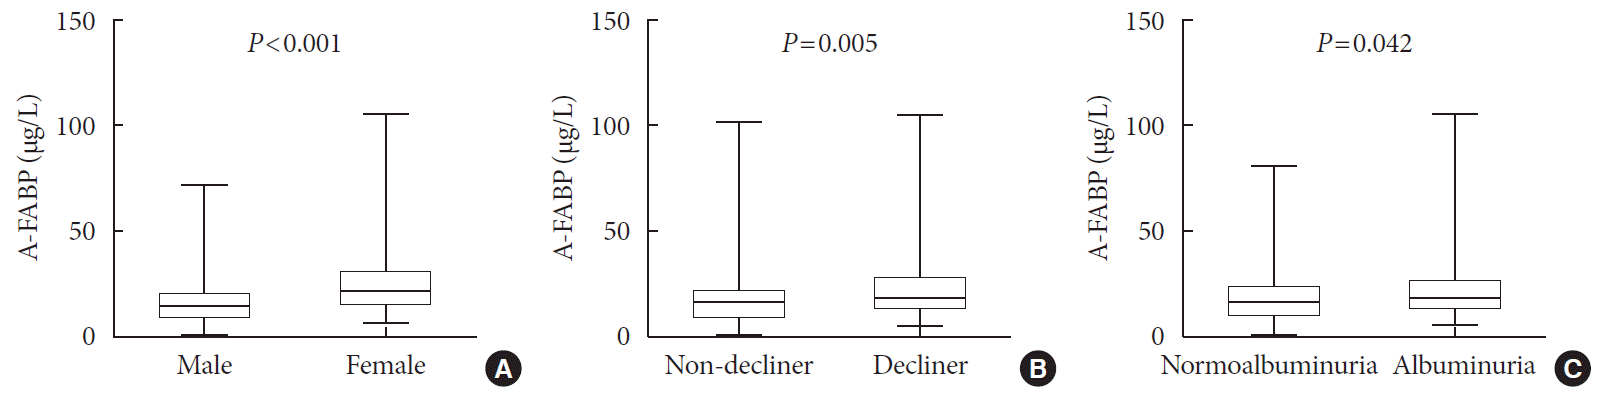 | Fig. 1Comparison of plasma adipocyte fatty acid-binding protein (A-FABP) levels (µg/L) based on sex (A), the presence of rapid renal function decline (B), or albuminuria (C). The bottom of the box plots indicates the 25th percentile and the top indicates the 75th percentile. The middle line of the box indicates the median. The lower and the upper ends of the whiskers indicate the minimum and the maximum observations below the upper fence (1.5 interquartile range above the 75th percentile), respectively.
|
Correlation between annual renal decline (%) and serum level of A-FABP and other adipocytokines
Table 2.
| Variable |
Unadjusted |
Adjusteda |
||
|---|---|---|---|---|
| r | P value | r | P value | |
| A-FABP, µg/L | –0.055 | 0.24 | –0.150 | 0.005 |
| hs-CRP, mg/dL | –0.013 | 0.78 | 0.001 | 0.99 |
| Fibrinogen, mg/dL | –0.064 | 0.23 | –0.046 | 0.39 |
| Total adiponectin, µg/mL | –0.023 | 0.63 | 0.071 | 0.19 |
| HMW adiponectin, µg/mL | –0.039 | 0.40 | 0.055 | 0.31 |
| Interleukin-6, pg/mL | –0.043 | 0.36 | 0.051 | 0.35 |
| TNF-α, pg/mL | 0.037 | 0.43 | –0.045 | 0.40 |
| PTX3, ng/mL | –0.042 | 0.37 | –0.070 | 0.19 |
![]()
Independent association between serum A-FABP level and rapid renal function decline
Table 3.
Values are presented as mean±standard deviation, number (%), median (interquartile range).
A-FABP, adipocyte fatty acid-binding protein; BMI, body mass index; WC, waist circumference; WHR, waist hip ratio; SBP, systolic blood pressure; DBP, diastolic blood pressure; CVD, cardiovascular disease; HbA1c, glycosylated hemoglobin; FPG, fasting plasma glucose; PP2, 2-hour post prandial; HOMA-IR, homeostatic model assessment of insulin resistance; HDL-C, high-density lipoprotein cholesterol; LDL-C, low-density lipoprotein cholesterol; hs-CRP, high-sensitivity C-reactive protein; eGFR, estimated glomerular filtration rate; UACR, urine albumin creatinine ratio; TZD, thiazolidinedione; ACEi, angiotensin-converting-enzyme inhibitor; ARB, angiotensin II-receptor blocker; HMW, high molecular weight adiponectin; TNF-α, tumor necrosis factor-α; PTX3, pentraxin-3.
![]()
Table 4.
| Variable |
All |
Male |
Female |
|||
|---|---|---|---|---|---|---|
| ORa (95% CI) | P value | ORa (95% CI) | P value | ORa (95% CI) | P value | |
| Model 1 | 1.81 (1.17–2.80) | 0.002 | 1.68 (0.97–2.91) | 0.063 | 3.27 (1.31–8.15) | 0.011 |
| Model 2 | 3.04 (1.53–6.06) | 0.002 | 2.51 (1.08–5.86) | 0.033 | 5.63 (1.33–23.88) | 0.019 |
| Model 3 | 3.10 (1.53–6.29) | 0.002 | 2.65 (1.10–6.38) | 0.030 | 5.65 (1.17–27.19) | 0.031 |
All models were constructed by the logistic regression analysis. Model 1: adjusted for age. Model 2: model 1+adjustments for sex, duration of diabetes, body mass index, systolic blood pressure, history of cardiovascular disease, baseline estimated glomerular filtration rate, log urine albumin creatinine ratio, total cholesterol, glycosylated hemoglobin, and log high-sensitivity C-reactive protein. Model 3: model 2+adjustment for use of thiazolidinedione, insulin, angiotensin-converting-enzyme inhibitor/angiotensin II-receptor blocker and statin.
OR, odds ratio; A-FABP, adipocyte fatty acid-binding protein; CI, confidence interval.
![]()
 XML Download