

 PDF
PDF Citation
 Print
Print


INTRODUCTION
Data obtained from food consumption surveys are a basis for evaluating the risks associated with diet-related diseases and establishing dietary guidance to prevent nutritional deficiencies or excesses. Therefore, accurately determining food amounts consumed by subjects is critical in food consumption surveys. In many countries, food consumption surveys are being conducted based on dietary recall, and portion size estimation is fundamental to the accuracy of dietary recall. However, estimating accurate portion size consumed by subjects based on subjects' recall is not easy. One of the main errors in the measurement of food consumption occurs during the assessment of portion size [1], as a number of factors affect estimation accuracy. Food characteristics such as shape, size, and texture as well as personal characteristics of subjects such as age, gender, socio-economic status, habits, and body weight, to name a few, may lead to large estimation errors [2345].
To minimize portion size estimation errors, the use of visual aids has been proposed as an almost mandatory strategy [6]. Using appropriate portion size estimation aids (PSEAs) could improve the participants' ability to quantify their amounts of foods consumed of different types such as liquid, solid, and amorphous [7]. The search for better aids for estimation of portion size has led to numerous studies on the development of new PSEAs.
The PSEAs can be divided by type largely into 2-dimensional (2D) and 3-dimensional (3D) aids. Drawings of real foods, abstract shapes, household measures, food photographs, pictures of measuring tools, and different kinds of diagrams are used frequently among the 2D PSEAs. Among the 3D PSEAs, measuring tools such as cups or spoons, tableware such as bowls or dishes, food replica, geometric models, rulers, scales, and thickness sticks are generally utilized. Depending on the study's purpose or subjects of the nutrition survey, these types of PSEAs can be used separately or in combination to help the respondents recollect and estimate the amounts of foods they consumed.
The representative nationwide food consumption survey in South Korea is the Korea National Health and Nutrition Examination Survey (KNHANES) conducted by the National Institute of Health. The KNHANES is conducted to evaluate the health and nutritional status of the Korean people and provides statistics and data for the following public health policies, programs, and research. There was a renewal of the survey system in 2007; however, the KNHANES keeps the identical survey method on the whole [8]. The food consumption survey in the KHNAHES is conducted based on 24-h recall of the participants using 2D PSEA booklet and 3D PSEAs including measuring cups and spoons, ruler, and thickness sticks [9].
There have been studies in other countries on the development and evaluation of newly adopted aids tailored to certain types of foods [101112]. Various studies on the evaluation of the newly developed aids applying dietary characteristics of different countries have also been conducted [1314151617]. Furthermore, various research studies have attempted to increase the accuracy of estimation and alleviate subjects' burden to recall their amount of food consumption. However, few studies were accomplished to validate the PSEAs used in the KNHANES. Hence, the current study aimed to improve PSEAs used in the KNHANES and validate the accuracy and precision of the newly developed aids.
Go to : 
SUBJECTS AND METHODS
Development of PSEAs
Intensive interview
We conducted a total of four intensive interviews with eight survey experts who were conducting KNHNANES nutrition surveys. The interviews solicited their opinions about the current PSEAs, food types difficult to be estimated, PSEAs that needed to be newly introduced, etc. Each intensive interview lasted about one and a half hour. We also collected opinions of experts who participated in the development of PSEAs for the KNHNANES. Based on the results of the intensive interviews and experts' consultation, we selected 2D and 3D PSEAs to be improved and set the improvement direction.
Sample making
To design the PSEAs, information about volume and designs of tableware was collected through market research, and the sizes and capacities of representative tableware were measured. Based on the results, 2D PSEA samples were developed by an expert designer using an illustration program (Adobe Illustrator CS3; Adobe System Inc., San Jose, CA, USA). 3D PSEA samples were designed by an expert designer at a 3D printing center using the Solid Works program and were printed using an SLA (RS pro 600; Uniontech, Shanghai, China) or FDM (Fourtus360mc, Stratasys, US) type 3D printer.
Validation
Participants
Adults 20 years old or older living in Seoul or Gyeonggi province who agreed to participate in the study on a voluntary basis were recruited to take part in the study using a convenience sampling method (12 males and 12 females for each age group: 20s, 30–49 years old, 50–64 years old, and 65 years old or older). The study protocol was approved by the Institutional Review Boards at Myongji University (MJU-2017-06-003-03).
Validation procedure
A total of 5 types of PSEAs (rice bowls, earthen pots, mounds, measuring spoons, and thickness sticks) were tested and the evaluation methods are summarized in Table 1. For the rice bowls and earthen pots, the participants were asked to select the more similar PSEA in size after exposure to the real dishes. For the mounds, measuring spoons, and thickness sticks, the participants were presented with actual plates of food and asked to estimate the given portion sizes using the given PSEAs.
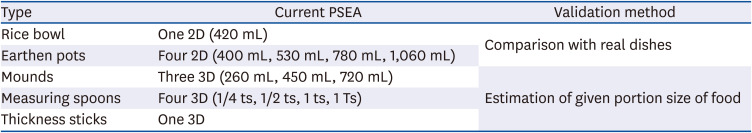
Table 1
Evaluation method for the performance of each PSEA after improvement
PSEA, portion size estimation aid; 2D, 2-dimensional; 3D, 3-dimensional; ts, teaspoon; Ts, tablespoon.
![]()
The foods used in the evaluation were selected based on the use frequencies of each PSEA in the 2015 KNHANES. Basically, the foods with the highest frequency of being estimated with the correspondent PSEA were used in the study (Table 2). The different types of foods (solid, liquid, and amorphous) were included, as food type has been identified as a factor that affects the estimation of portion size [181920]. As the food size also influences estimation error [21], one of the different sizes of dishes or foods was presented randomly to each participant in the test.
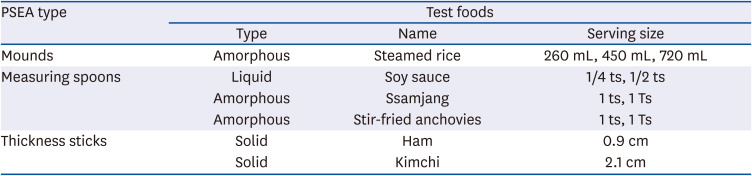
Table 2
The foods used in the validation of PSEA
![]()
The Duo-Trio test with modification was used in the test of the rice bowl. After, at random, 1 of the 3 different serving sizes of cooked rice was exposed for 30 s, the participant was asked to select the more similar PSEA in size between the current and developed one. The rice bowl test was conducted with all 96 participants. At least 15 panels are necessary for the Duo-Trio test and determinant power increases with minimizing the error with more than 30 panels [22].
For the test of earthen pots, mounds, measuring spoons, and thickness sticks, the participants were divided into 2 groups: current PSEA using group (CG, n = 48) and developed PSEA using group (DG, n = 48). The actual earthen pot or food was shown for 30 s and then covered, and each participant was asked to select the most similar size option using current PSEAs (CG group) or developed PSEAs (DG group). The participants' responses were recorded by the interviewer.
The interviewers were previously trained to perform the standardized assessments. As the purpose of this study was not to evaluate participants' memory but to evaluate the accuracy of portion size estimation using PSEAs, we conducted the evaluation right after exposure to the actual dish or food. A total of 768 tests (96 participants, 8 samples) were conducted in September 2017.
In the test of mounds, measuring spoons, and thickness sticks, the participants were also asked the percentage of the selected aid they thought the food would be. In addition, their confidence of choice about their estimation was measured based on a 5-point Likert scale (1 = very uncertain, 5 = very certain) [111223].
Analysis
In the test of the rice bowl, the significance was judged based on the minimum number of correct responses required out of the total number of responses to conclude that the two PSEAs were significantly different from each other. For earthen pots, mounds, measurement spoons, and thickness sticks, the percentages of correct answers between the groups were compared. The ratio of under- and over-estimation among wrong answers was compared as well.
To compare the accuracy of estimation between the current and developed PSEAs, a calculation was made of the difference in amounts (estimated-actual), and the estimation errors (difference in amounts/actual amount × 100) for mounds, measuring spoons, and thickness sticks were calculated. The differences between the 2 groups were analyzed using χ2 test or Mann-Whitney U test. All the analyses were carried out using the Statistical Package for the Social Sciences version 23.0 (SPSS Inc., Chicago, IL, USA). A result of P < 0.05 was considered statistically significant.
Go to :
RESULTS
Development of PSEAs
Intensive interview
Based on the results of intensive interviews with survey experts of the nutrition survey in the KNHANES and of experts' consultations, we selected 2D and 3D aids which need to be improved (Table 3).
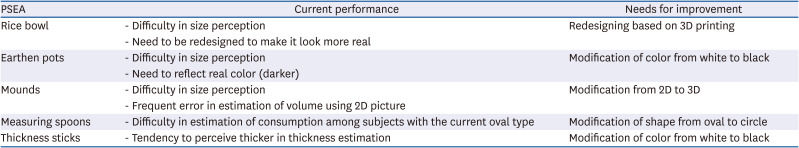
Table 3
Evaluation of the performance of current PSEAs revealed in intensive interviews
![]()
Sample making
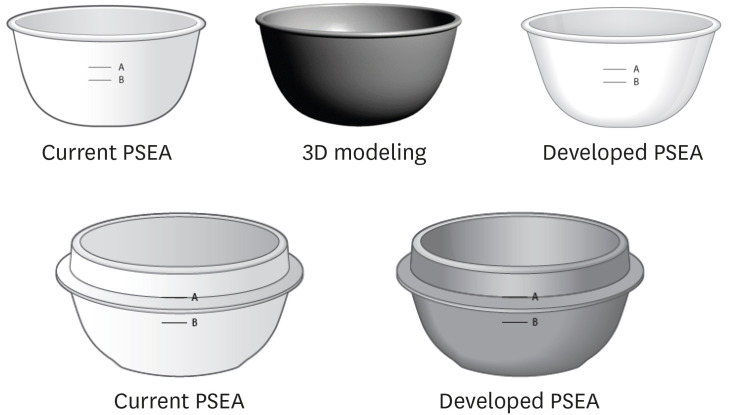
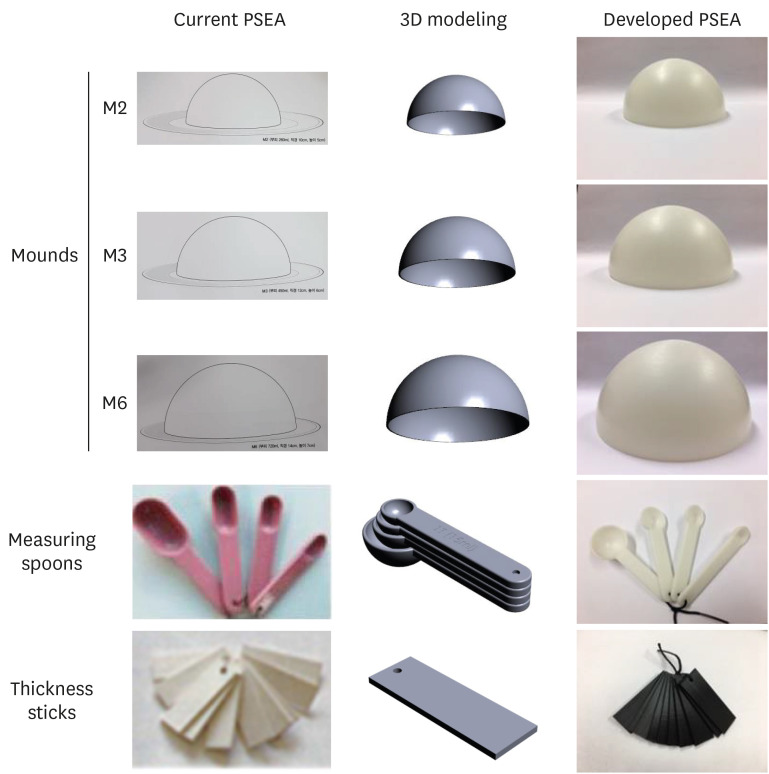
The comparison between the current 2D aids for rice bowls and earthen pots with the pictures drawn by 3D modeling showed that the current 2D aids were made without considering the image distortion due to the angle of view. Thus, new 2D aids were developed with application of the image distortion by the angle of view and with coloring to make them look more similar to the real ones in size (Fig. 1). The measuring spoons (modification of shape from oval to circle), thickness sticks (modification of color from white to black), and mounds (modification from 2D to 3D) were produced using 3D printing (Fig. 2).
Validation
General characteristics of the participants
General characteristics of the participants are presented in Table 4. The participants consisted of 48 (50%) males and 48 (50%) females. The average age was 46.6 years without significant difference between the groups. Regarding education level, most participants (41.7%) were high school graduates, and the percentage of housekeepers (26.0%) was the highest among occupations without any significant differences between the groups.
Table 4
General characteristics of the participants
Values are presented as number (%) or mean ± SD.
CG, current portion size estimation aid using group; DG, developed portion size estimation aid using group.
*P-value by χ2 test; †P-value by Mann-Whitney U test.
![]()
Validation of 2D PSEAs
Among a total of 96 participants, 32 (33.3%) chose the current aid and 64 (66.7%) chose the developed aid in the rice bowl test (Table 5). The minimum number of the correct answers with 96 panels are 57, 60, and 64 with the significance levels of 5%, 1%, and 0.1%, respectively [24]. Therefore, the result showed a significant difference between the current and developed aids with a significance of 0.1%, which means that the developed aid was perceived closer to the real size. The confidence of choice of the participants was 3.65 points out of 5.0 in those who chose the current aid and 3.96 points in those who chose the developed one, without significant difference between the groups (Table 5).

Table 5
Validation results of rice bowl
| Evaluation items | CG | DG | Total | P-value* |
|---|---|---|---|---|
| Choice | 32 (33.3) | 64 (66.7) | 96 (100.0) | < 0.001 |
| Confidence of the choice† | 3.65 ± 0.96 | 3.96 ± 0.92 | 3.80 ± 0.95 | 0.103 |
Values are presented as number (%) or mean ± SD.
CG, current portion size estimation aid using group; DG, developed portion size estimation aid using group.
*P-value by Duo-Trio test; †Measured based on 5-points Likert scale (1 = very uncertain, 5 = very certain)
![]()
In the test of earthen pots, the percentage of correct answers was 43.8% in the CG, whereas it was 52.1% in the DG, with no significant difference. The proportion of correct, under- and over-estimation is given in Table 6. There were no significant differences in the ratio of under- and over-estimation between the two groups. The ratio of under-estimation was as high as over 70% in both groups. The confidence of choice was 3.81 points out of 5.0 in both groups without significant difference (Table 6).
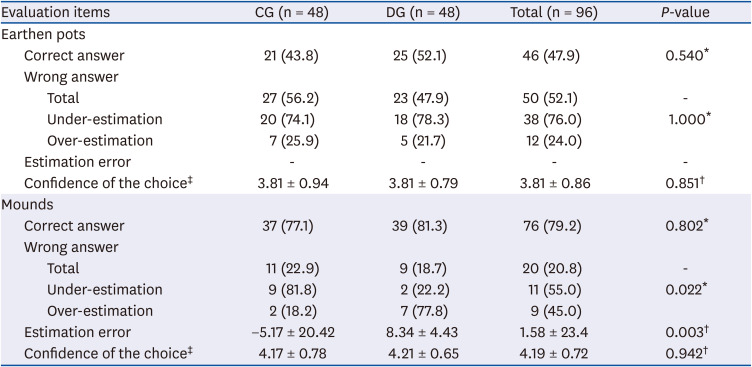
Table 6
Validation result of earthen pots and mounds
Values are presented as number (%) or mean ± SD.
CG, current portion size estimation aid using group; DG, developed portion size estimation aid using group.
*P-value by χ2 test; †P-value by Mann-Whitney U test; ‡Measured based on 5-point Likert scale (1 = very uncertain, 5 = very certain).
![]()
Validation of 3D PSEAs
The results of comparing the current 2D with developed 3D mounds are also presented in Table 6. The percentage of correct answers was 77.1% in the CG and 81.3% in the DG, without significant difference between the groups. However, there was a significant difference in the ratio of under- and over-estimation between the groups (P = 0.022), showing the opposite tendency; 81.8% of those with the wrong answers in the CG underestimated while 77.8% of those with the wrong answers in the DG overestimated. The estimation errors in the CG and DG were −5.2% and 8.3%, respectively (P = 0.003). The confidence of choice was about 4.2 out of 5 in both groups, which was higher than other aids showing lower confidence of choice below 4.0 points.
The results comparing the current oval measuring spoons with the developed circle ones are shown in Table 7. There were no significant differences in the percentage of correct answers in all the foods (soybean sauce, ssamjang, and stir-fried anchovies). The under- and over-estimation ratio among those with the wrong answers did not show any significant differences either.
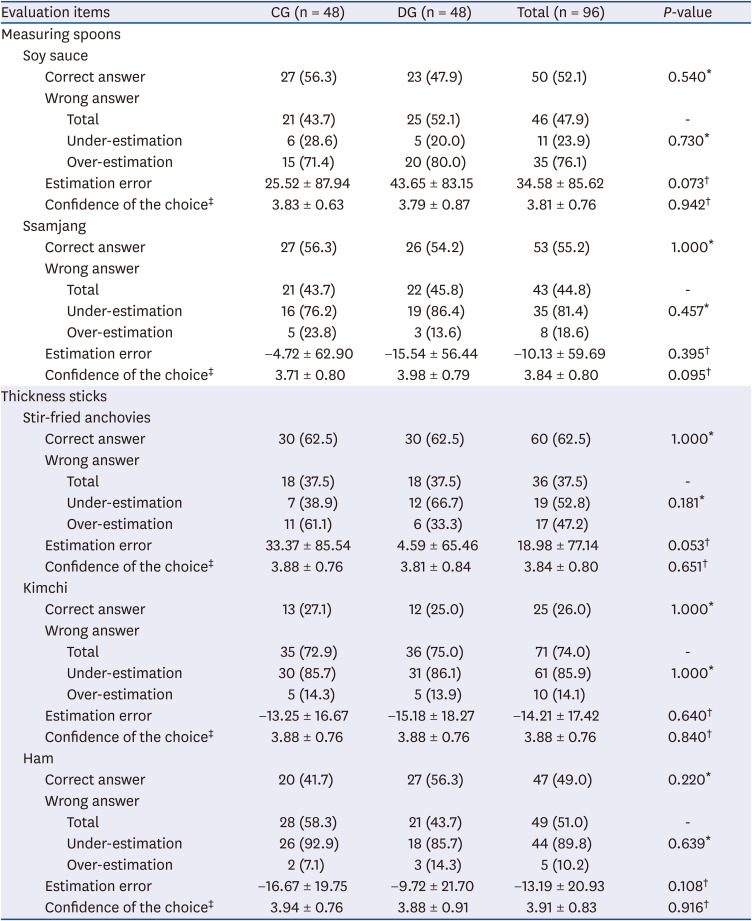
Table 7
Validation results of measuring spoons and thickness sticks
Values are presented as number (%) or mean ± SD.
CG, current portion size estimation aid using group; DG, developed portion size estimation aid using group.
*P-value by χ2 test; †P-value by Mann-Whitney U test; ‡Measured based on 5-point Likert scale (1 = very uncertain, 5 = very certain).
![]()
However, the under- and over-estimation tendencies were different according to the food types despite the use of the same aid. The ratio of over-estimation was higher in both groups using soybean sauce (71.4% in the CG and 80.0% in the DG), whereas that of under-estimation was higher using ssamjang (76.2% in the CG and 86.4% in the DG). An inverse trend was observed between the 2 groups when using stir-fried anchovies.
The estimation errors were not significantly different between the groups in all food types, but the estimation error in the DG (43.7%) tended to be higher than that in the CG (25.5%) (P = 0.073) for soybean sauce. In addition, the estimation error in the DG (4.6%) tended to be lower than that in the CG (33.4%) for stir-fried anchovies (P = 0.053). The degrees of certainty were between 3.7 and 4.0 out of 5.0 in all the tests without any significant differences between the groups.
The test results for thickness sticks are also presented in Table 7. There were no differences between the groups in the percentage of correct answers both for kimchi and ham. The ratios of under- or over-estimation were not significantly different either. The ratio of under-estimation for kimchi was as high as 85.7% and 86.1% in the CG and DG respectively. The ratio of under-estimation for ham was relatively high as well (92.9% in the CG and 85.7% in the DG).
Estimation errors showed the same results. The estimation error for kimchi was −13.3% in the CG and −15.2% in the DG on average and that for ham was −16.7% in the CG and −9.7% in the DG, without significant differences between the groups. The confidence of choice was more or less 3.9 out of 5.0 in all tests without significant differences between the CG and DG.
Go to :
DISCUSSION
This study developed new PSEAs to improve the PSEAs currently used in the KNHANES through an intensive review of the current PSEAs and intensive interviews and consultations with survey experts of the nutrition survey in the KNHANES, and validated the accuracy and precision of the newly developed aids. Considering the purpose and use of results of the KNHANES, innovative improvement of the PSEAs can create a sudden change in the intake analysis result and be difficult to adopt in the current KNHANES system, so our improvement approach was conservative. A total of 96 adults aged 20 yrs or older participated in the validation tests. The nutrition survey of KNHANES targets Koreans over 1 yr of age and is conducted through home-based in-person interviews, but children and adolescents can be assisted by their parents or guardians during the interviews [9]. Therefore, the validation test was conducted only in adults in our study.
As the first result, the subjects perceived the improved 2D picture aid of a rice-bowl reflecting the size distortion by the angle of view using 3D modeling more closely to the actual size than the current 2D picture. Since cooked rice is the staple dish and primary source of energy intake for Koreans, accurate estimation of cooked rice is very important for the nutrition survey. According to the KNHANES VII-1 the ratio of energy intake from white rice of Koreans was more than a quarter of total energy intake and the first source of energy [25]. Reflecting the size distortion by angle of view using 3D modeling of the commonly used rice bowl in the Korean diet was the first attempt to improve the current 2D picture aids. Therefore, it is suggested that pictures of tableware (rice bowls, soup bowls, dishes, cups, etc.) among the currently used 2D PSEAs require a full redesign using 3D modeling to improve the subjects' perception.
The currently used 2D picture aids were life-size pictures. However, the survey experts of the KNHANES reported that estimation errors of earthen pots were very common and providing additional information and checking real size were often required during the survey. Earthen pots are used for serving stews, which are very common dishes in the Korean meal. Usually small-size earthen pots are used for personal use, while larger sizes are used for a family and multiple people. Even though the color of earthen pots is dark brown or black, the color of the current PSEAs is white. We modified the color into dark to make them look more realistic; however, there was no significant improvement in perception by color change for 2D picture aids of earthen pots. The ratio of under-estimation was as high as over 70% in the current and new aids. We tried to change the color of the 3D model of thickness sticks as well, but this also failed to improve the subjects' perception.
Most Asian meals consist of amorphous food, non-amorphous food, and their mixed form [16], and Korean meals are no exception. It is known that amorphous foods are less well estimated in serving size [16]. Rice-based foods such as bibimbap, rice covered with sauce, fried rice, etc. are commonly eaten by Koreans. Their intake amounts have often been estimated using the 2D mounds, but the demand for 3-dimensionalizing them for more accurate estimating was found during the intensive interviews. However, there was no significant difference in the result of comparing the difference in perception between the 2D picture mound and the 3D model. In the case of amorphous foods such as sauces and seasonings, the measuring spoons can be used for intake estimating. In this study, the shape of the measuring spoons was changed from oval to circular, but there was no significant difference in accurate estimation between the two different shapes. Therefore, it is considered unnecessary to change the color or the shape of the measuring spoons, or to 3-dimensionalize the 2D mounds.
Meanwhile, depending on the type or kind of PSEAs, the subject tended to under- or over-estimate them, and this requires attention in future nutrition surveys. Under-estimation in 2D PSEAs for earthen pots and mounds currently in use, and over- or under-estimation in the measuring spoons depending on the type of food were observed in our study. High under-estimation ratios for thickness sticks were also identified. Food texture affects estimation [1620]. In a study using Asian curries, food texture had a significant effect on portion size estimation. When compared with small photographs, estimation by line diagrams was better for foods with defined shapes, and life-size photographs had no additional advantage over small photographs. Considering both accuracy and precision together, a combination of small photographs for amorphous foods and 2D line diagrams for non-amorphous foods was considered best for use in a food atlas. It was recommended that a combination of PSEAs be used between different types of foods in achieving the best possible accuracy. Other previous studies also recommended the use of a combination of aids [2326]. Therefore, the assessment of amorphous foods in the KNHANES should be supplemented with using a combination of aids.
Our study has some limitations. First, the study did not test the validity of the PSEAs within the context of 24-h dietary recalls, as we tried to compare the subjects' perception between currently used and newly developed PSEAs. Second, convenience samples in the validation study were drawn, which made it difficult to generalize the results and clarify the range of test bias. Lastly, as previously mentioned, considering the purpose and use of the KNHANES, an innovative improvement of the PSEAs can have a sudden change in the intake analysis result and be difficult to adopt in the current KNHANES system, so the improvement approach was very conservative. This may have influenced the newly improved PSEAs not to show a significant improvement compared to the PSEAs currently in use.
Despite these limitations, this study is the first study to develop the improved PSEAs currently used in the KNHANES and evaluate their validity with various evaluation methods according to the different PSEAs. Also, various attempts such as redesign, color change, and 3-dimensionalization of 2D pictures, and the results of evaluating the subjects' perception on newly developed PSEAs provide important fundamental information for further research to improve PSEAs. Further studies are needed in more realistic settings such as in-person 24-h recall interviews using the newly developed PSEAs.
Go to :
 XML Download