

 PDF
PDF Citation
 Print
Print


INTRODUCTION
South Korea has entered the aging society in 2000 and aged society in 2018. It is expected to enter the post-aged society in 2025, and the proportion of the elderly population will reach over 40% in 2051 [1]. According to a report from the United Nations in recent years, the number of persons aged 80 yrs or over is projected to triple from 137 million in 2017 to 425 million in 2050 [2]. The elderly may have various health problems due to aging. In particular, those whose digestion function is degraded may have health deterioration due to malnutrition, which leads to degradation in the quality of life. The oral masticatory function allows food to be chewed then mixed with saliva to form a bolus for easy swallowing. It is the first step in the digestion process, in which not only teeth but also periodontal tissue, tongue, taste function, and central nervous system are complexly involved [3]. Thus, the masticatory function influences not only the control of chewing frequency and pressure but also the satisfaction of the quality of life through food intake [4]. Chewing difficulty or masticatory dysfunction refers to a status of reduced chewing ability due to missing teeth, thus limiting the foods to be taken and degrading the quantity and quality of a dish. This is a different concept from difficulty swallowing or dysphagia [5], which is difficulty or discomfort in swallowing due to food going down the wrong pipe or throat clearing. Much attention has been paid to the problem of chewing difficulty from various research areas. Missing teeth, periodontal diseases, and deterioration of tongue function lead to the reduction in masticatory force, oral sensations, and taste loss, affecting the quality of life negatively. Moreover, reduced food intake caused by chewing difficulty results in the loss of eating pleasure and nutritional imbalance [367]. Furthermore, chewing difficulty has been related to brain-related diseases such as cognitive impairment, cerebrovascular disorder and Parkinson's disease, increase in the occurrence of diseases such as muscular dystrophy, aging acceleration, stomach and kidney dysfunction due to reduced digestive enzyme secretion, and depression [89].
Many studies have been conducted on the effect of chewing difficulty on health through national data analysis. Most studies selected elderly participants aged over 65 yrs as study subjects [567] whereas some other studies focused on the chewing difficulty of adults [3]. According to the analysis of result of the 6th Korea National Health and Nutrition Examination Survey (KNHANES) data, proportions of the participants with chewing difficulty in their 20s to 30s, 40s to 50s, and over 60s were 8.1%, 22.3%, and 39.5%, respectively, indicating a clear difference by age. Those with chewing difficulty had systemic health problems such as pronunciation discomfort (86%), myocardial infarction (57.3%), asthma (48.0%), arthritis (44.0%), depression (41.9%), and diabetes (41.8%) [3]. In a large-scale interview study conducted throughout the UK, 75% of the participants answered that oral health including chewing difficulty affected the quality of life. In particular, adults (16–64 yrs) recognized the relationship between oral health and the quality of life more strongly than the elderly (over 65 yrs) [10].
Chewing difficulty directly impacts food intake, which may lead to nutrient intake imbalance. The relationship among chewing difficulty, demographic characteristics, and food and nutrients intake has been come into focus steadily by Korean researchers. The relationship has shown that chewing difficulty has a positive correlation with age and a negative correlation with income. Chewing difficulty's relation with gender was proven to be inconsistent among studies [67]. Those who had chewing difficulty tended to have a lower intake of vegetables and fruits. However, the effects on total food intake, energy, calorie nutrients such as protein and carbohydrate, and micronutrients such as vitamins were inconsistent among studies [367].
The food frequency questionnaire (FFQ) utilizes a structured food list including serving size information and frequency range for each food item to indicate the usual frequency of consumption over a certain period of time. It can well represent a daily food intake for a long period and the burden of the survey is relatively small. Thus, it has been recognized as a useful dietary intake method in large-scale epidemiological studies. In contrast, the 24-h dietary recall method is an open survey method that professional counselors use to help the interviewee recall dietary details. With this method, a quantitative survey may be possible but it is limited to consider variations within individuals as it only comprises the dietary intake contents from one day before the survey [111213]. To mitigate the variation within individuals, repeated surveys may be conducted. However, a large-scale survey such as the KNHANES is limited in conducting such multiple 24-h recall surveys. Nonetheless, most of the above-mentioned studies on chewing difficulty utilized the 24-h recall data of the elderly to discuss the relationship between chewing difficulty and food and nutrient intake [367]. It is difficult to sufficiently reflect subjects' daily food consumption using the one-day food intake data surveyed by the 24-h recall method due to the variations within individuals, who are likely to have overestimated or underestimated relationships between chewing difficulty and foods, dishes, and nutrient intake reported by researchers. Thus, this study aimed to determine whether consumption frequencies of 116 foods or dishes included in the FFQ were less consumed by chewing difficulty among adult subjects aged between 19 and 64 yrs included in the integrated data of 2013–2016 KNHANES to overcome the limitations of previous studies and explore the relationship more scientifically.
Go to : 
SUBJECTS AND METHODS
Study subjects
This study has utilized data from the 6th (2013–2015) and the first year of 7th KNHANES performed by the Korea Centers for Disease Control and Prevention. The KNHANES included 192 survey districts since 2010 and has systematically extracted 20 households during 2013–2015, and 23 households since 2016 to draw a final subject group [14]. From the adults of ages 19–64 in the FFQ data from the KNHANES, a total of 24,416 (2013 [n = 6,113], 2014 [n = 5,976], 2015 [n = 5,945], and 2016 [n = 6,382]) subjects were included. Observations that had missing values or were deemed as irrelevant were firstly discarded. Next, individuals who had been diagnosed or under treatments due to chronic renal diseases at the time of participation were additionally dropped based on the known diet therapy such as reduced consumption of fruits and vegetables that are high in potassium for patients with renal chronic disease [15] so that a total of 20,959 subjects finally remained. To classify the subjects according to their chewing abilities, subjects were asked of how much difficulty they experienced while chewing and were categorized according to their answers: DC group for those who answered “very difficult” or “somewhat difficult”, NDC group for those who answered “can not tell” or “not difficult” or “not at all difficult” [367].
FFQ classification with food groups
The FFQ included in the KNHANES for 4 yrs (2013–2016) consists of 112 foods and dish items in common, and six sub-items, which are 2 sub-items in loaf bread (butter/margarine, jam), one sub-item in milk (mostly drinking milk type), and three sub-items in coffee (number of cases when taking more than three cups of coffee, cream, sugar). In the present study, 116 items excluding the “mostly drinking milk type” and “number of cases when taking more than three cups of coffee,” which had low response frequencies, were analyzed. Out of all items, 72 items were presented as a single item like “cooked rice” whereas 44 items included more than 2 dishes in a single item [16]. In this study, when including more than 2 dishes in a single item, a dot was put between dishes such as “bibimbap·fried rice” to mark them. In the FFQ survey guidelines, types of foods and dishes that should be included when reporting the consumption frequency of each item are provided in detail and divided into 10 categories [17]. But the categories of food group used in this study comprised nine food groups. Firstly, 6 groups (grains, meats·fish·eggs·beans, vegetables, fruits, milk·dairy products, and oils·sugars) that were suggested as a diet plan in the 2015 Dietary Reference Intakes for Koreans (KDRI) were included [18]. Next, items where both animal and vegetable ingredients are used as essential components such as in cold noodles (so-called one-dish meals) were categorized to “dishes” rather than food groups, to improve the validity of the analysis. Foods where meat, fish, eggs, or beans were the main ingredients along with some added seasoning, such as “braised tofu,” were categorized to “meats·fish·eggs·beans” without considering the small amount of grain, oil, sugar, and vegetable added as seasoning. Bread, rice cakes, and vegetable side dishes were also categorized into a food group of the main ingredient if the use of other ingredients and seasoning was minimal during cooking. Finally, “beverages” and “alcohols” that are not included in milk·dairy products were separately classified. As a result, 116 items consisted of 15 grains, 23 meats·fish·eggs·beans, 20 vegetables, 13 fruits, 4 milk·dairy products, 5 oils·sugars, 28 dishes, 5 beverages, and 3 alcohols. In other words, the classification of food group in this study had the largest number of dishes, followed by meats·fish·eggs·beans, vegetables, grains, and fruits, with only a few items of oils·sugars, beverages, milk·dairy products, and alcohols included.
Finally, for the consumption frequency of each item in the FFQ and the energy and nutrient intake by the subjects, this study utilized the converted value of weekly consumption frequencies, which was disclosed along with raw data, and the energy and nutrients intake data based on the FFQ data.
Data analysis
The KNHANES is being conducted annually due to forensic investigations based on the National Health Promotion Act, and is distributed under the approval (2013-12EXP-03_5C) of the Research Ethics Committee of the Centers for Disease Control and Promotion, and thus does not include any identifiable personal information [19]. The objective of this study was to examine how Korean adults' chewing ability affect the frequencies of food consumption, therefore important demographic variables such as age and average household income were adjusted for statistical analysis because these variables can affect subjects' normal food consumption. The “subjective health status” variable that comprehensively assesses a subject's health status was included as another confounding variable based on an assumption that one's health status can affect the individual's food intake behavior. Gender stratification of the initial dataset was chosen to better reveal the association between chewing difficulty and food consumption frequency because strong gender difference existed in terms of food consumption frequencies [20]. To utilize the results of this study in the future development of texture-modified food or tailored menus for adults and the elderly with chewing difficulties, items that the consumption of DC were significantly lower than the NDC were only presented through one-sided survey regression analysis. That is, items where the food consumption frequency of DC was significantly higher than that of the NDC were not taken into consideration. Only some interesting results were addressed for discussion. In addition, total energy and 14 nutrients intake based on the FFQ data were compared between male and female subjects using gender-stratified one-sided survey regression analysis adjusted for the several confounding variables. Complex sample analysis method was adopted with including the statistical weights related to health interview, health examination and nutritional examination according to the Raw Data Utilization Standards of KNHANES. All statistical analysis has been conducted using the SAS 9.3 packages (SAS Institute Inc., Cary, NC, USA) and the significance level has been set to a P-value of 0.05 or lower. Finally, this study has been conducted under the guidance provided on the KNHANES homepage, and has received an approval of the Institutional Review Board of Silla University (1041449-201906-HR-001) for the study protocol.
Go to :
RESULTS
General characteristics and subjective health status of subjects
The average age of all subjects (n = 20,959) was 50.67 yrs old, and the average age of DC (60.5 yrs old) was about 13 yrs older than NDC (47.5 yrs old) (P < 0.001). The sex ratio of DC was 43.3% (male) and 56.7% (female), and average household income was shown to be correlated with chewing difficulty (P < 0.001). The ratio of high-income households and low-income households of DC was 17.4% and 33.8% respectively, and for NDC it was 31.8% and 14.4%. This shows that the lower the household income, the higher the proportion of chewing difficulty, and vice versa. Education levels have also been proven to be significantly correlated to chewing difficulty: DC tended to have a lower level of education than NDC (P < 0.001). On a scale of 1 to 5 (1: very good, 2: good, 3: normal, 4: bad, and 5: very bad), NDC and DC respectively showed “Subjective health state” variable values of 2.78 and 3.26, showing that DC had a worse perspective on their health than NDC (P < 0.001).
Food consumption frequency according to chewing difficulty
Table 1 shows items that have significantly lower intake frequencies in DC than NDC with their standard units. Out of the total 116 items, 34 items (29.3%) were significantly lower in weekly food consumption frequency. Firstly, of the 15 grain items, cooked rice with grains and legumes, steamed sweet potatoes·grilled sweet potatoes, loaf bread, steamed potatoes·grilled potatoes, and ready-to-eat cereal were included. Cooked rice with other grains and legumes were ranked the highest in consumption frequency (NDC: 10.80 times, DC: 10.48 times). To the contrary, cooked white rice had no significant difference, which was expected due to the relatively higher content of dietary fiber in cooked rice with other grains and legumes compared to that of white rice. Of the 23 items of meat·fish·eggs·beans, tofu·stir-fried tofu·pan-fried tofu, boiled eggs·steamed eggs, squid (raw, dried shredded, boiled, stir-fried), beef bulgogi were included. And intake frequencies appeared to be less than 1 time per week, regardless of chewing difficulty. According to a study on the elderly's use of senior welfare centers in Seoul, the preference of grains and vegetables was high, but the preference of seafood and meats was low. In particular, seafood with strong textures such as squid were avoided due to chewing difficulty, and seafood-specific fishy smells and allergy symptoms were mentioned as the reasons for avoidance [5]. This is consistent with the result found in this study for various types of squid. Of the 20 items of vegetables, other kimchi·fresh vegetable kimchi, cucumber (fresh salad, fresh), cooked broccoli·cooked cabbage, stir-fried lotus roots·stir-fried burdock, green laver salad·brown seaweed salad were included. Other kimchi·fresh vegetable kimchi showed the highest consumption frequency (3.66 vs. 3.39 times) and the rest showed less than 1 times of intake per week. Of the 13 items of fruits, apples, tangerines, tomatoes·cherry tomatoes, bananas, melons, grapes, pears, strawberries, peaches and kiwis appeared to be significant. Apples (1.88 vs. 1.50 times) were consumed most frequently, followed by tangerines (1.24 vs. 1.18 times) and tomatoes·cherry tomatoes. The other 7 items were consumed less than 1 time a week. Of the 4 items of milk·dairy products, milk·low fat milk (NDC: 1.67, DC: 1.52 times per week) and curd type yogurt (NDC: 1.53, DC: 1.35 times) were included. Of the 5 items of oils·sugars, jam and butter·margarine, which are also subsidiary items of loaf bread, were significant. Sugar and cream were not included in Table 1 because the consumption frequencies of NDC were significantly higher than the DC's. It is suspected that these results are of a similar trend of loaf bread that appeared to be a significant grain item because jam, butter·margarine were the subjective items of loaf bread under the grain category (P < 0.0001). Next, while there were many items in the dish group, represented by 28 out of the 116 items, only four items: curry and rice, tteokbokki, dried pollack soup, and sea mustard soup were significant and their consumption frequencies were all less than once a week. It might be that the unique texture of food ingredients in the dish group would be changed to “easily chewable” due to seasoning and heat treatment added during the cooking process, which is likely to relieve the impact of chewing difficulty. Green tea was exceptionally included among beverages. Other beverages were not included in Table 1 because the frequency of DC were significantly higher than the NDC. Coffee was particularly noted as the most frequently consumed food item among all FFQ items by both NDC (12.15 times) and DC (13.18 times) groups. Finally, the alcohol group did not significantly differ between DC and NDC.
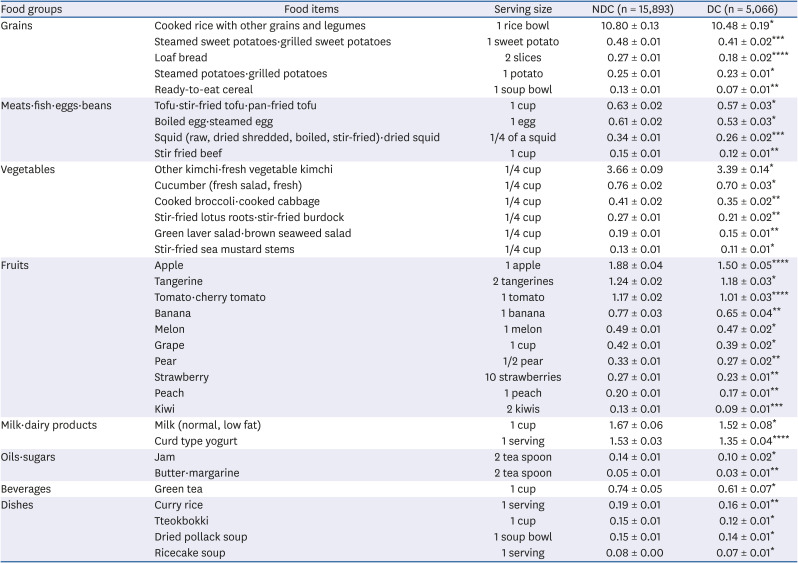
Table 1
Average weekly consumption frequencies of foods and dishes in the FFQ of 2013–2016 KNHANES based on self-reported chewing ability
Mean ± SE for weekly consumption frequencies of FFQ items.
FFQ, food frequency questionnaire; KNHANES, Korea National Health and Nutrition Examination Survey; NDC, not difficult in chewing; DC, difficult in chewing.
*P < 0.05, **P < 0.01, ***P < 0.001, ****P < 0.0001 by one-sided survey regression test after adjusted for age, household income, and self-rated health status.
![]()
Comprehensively, out of items that have consumed at least 1 time a week, cooked rice with grains and legumes, other kimchi·fresh vegetable kimchi, apples, tangerines, tomatoes·cherry tomatoes, milk·low fat milk, curd type yogurt showed significantly lower intakes due to difficulty of chewing, and the remaining 27 items showed an intake frequency of less than once a week (data not shown). In summation, fruits (10 items) appeared to be the most significantly less consumed food group followed by the vegetables (6 items), grains (5 items), meat·fish·eggs·beans and dishes (4 items, respectively), milk·dairy products and oils·sugars (2 items, respectively) groups due to chewing difficulty.
Food consumption frequency according to chewing difficulty by sex
The items in which DC were significantly less consumed than NDC in males, were steamed sweet potatoes·grilled sweet potatoes, loaf bread, ready-to-eat cereal among grains, squid (raw, dried shredded, boiled, stir-fried), beef bulgogi among meats·fish·eggs·beans, other kimchi·fresh vegetable kimchi, stir-fried lotus roots·stir-fried burdock, green laver salad·brown seaweed salad among vegetables, apples, tomato·cherry tomatoes, oranges, kiwis among fruits, curd type yogurt among milk·dairy products, and green tea among beverages. Among dishes sweet and sour pork·pork cutlets and tteokbokki (seasoned rice bar in pepper paste) were significant while oils·sugars were not significant (Table 2). For items whose intake frequencies were less in DC than NDC in females were as follows: cooked rice with grains and legumes, steamed sweet potatoes·grilled sweet potatoes, loaf bread, ready-to-eat cereal among grains, boiled·steamed eggs, tofu·stir-fried tofu·pan-fried tofu, squid (raw, dried shredded, boiled, stir-fried) among meats·fish·eggs·beans, other kimchi·fresh vegetable kimchi, grilled laver·raw laver·laver salad, mung bean sprout, beans sprout, stir-fried mushrooms, stir-fried lotus roots·stir-fried burdock, green laver salad·brown seaweed salad among vegetables, apples, tomato·cherry tomatoes, bananas, pears, strawberries, peaches among fruits, curd type yogurt among milk·dairy products, and butter·margarine among oils·sugars. Also, among dishes tofu stew·soft tofu stew, curry rice, ricecake soup and budae stew were significant, while alcohol and beverages were not significant (Table 3).
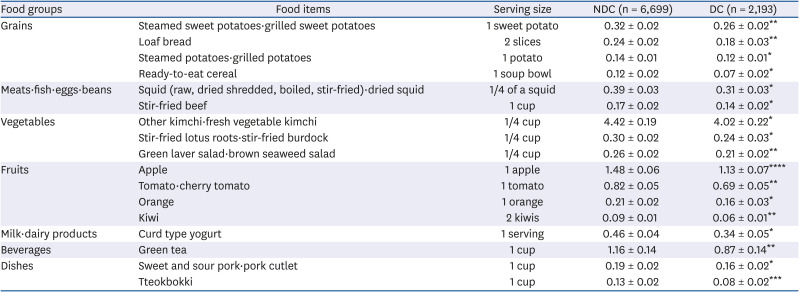
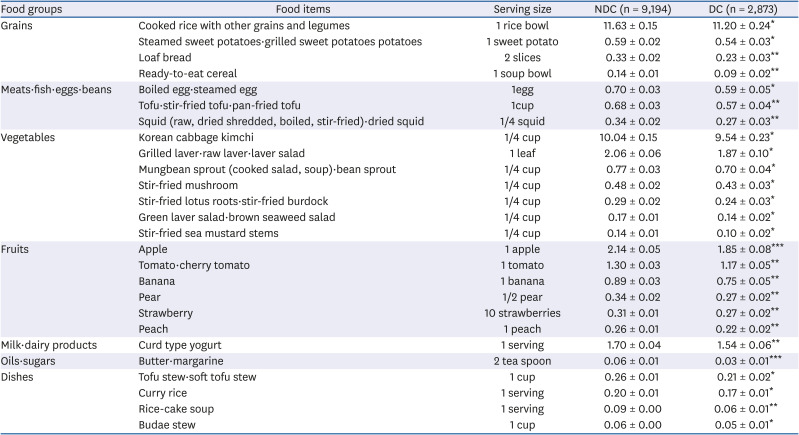
Table 2
Average weekly consumption frequencies of foods and dishes in the FFQ of 2013–2016 KNHANES based on self-reported chewing ability of male subjects
Mean ± SE for weekly consumption frequencies of FFQ items.
FFQ, food frequency questionnaire; KNHANES, Korea National Health and Nutrition Examination Survey; NDC, not difficult in chewing; DC, difficult in chewing.
*P < 0.05, **P < 0.01, ***P < 0.001, ****P < 0.0001 by one-sided survey regression test after adjusted for age, household income, and self-rated health status.
![]()
Table 3
Average weekly consumption frequencies of foods and dishes in the FFQ of 2013–2016 KNHANES based on self-reported chewing ability of female subjects
Mean ± SE for weekly consumption frequencies of FFQ items.
FFQ, food frequency questionnaire; KNHANES, Korea National Health and Nutrition Examination Survey; NDC, not difficult in chewing; DC, difficult in chewing.
*P < 0.05, **P < 0.01, ***P < 0.001, ****P < 0.0001 by one-sided survey regression test after adjusted for age, household income, and self-rated health status.
![]()
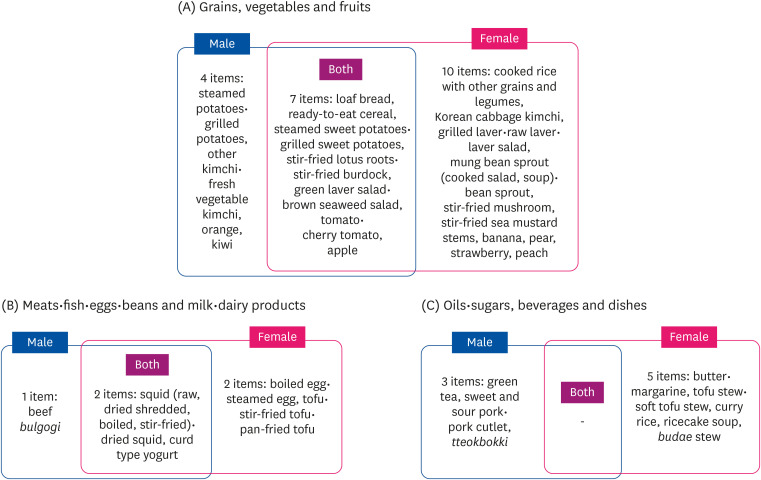
Fig. 1 illustrated the items that appeared to be significant in Table 2 and 3 using three categories: plant-based items such as grains, vegetables and fruits, animal-based items such as meat·fish·eggs·beans and milk·dairy products, and others including oils·sugars, beverages, alcohols, and dishes—in only males, only females, and both gender. Items that showed significance for both were loaf bread, ready-to-eat cereal, steamed sweet potatoes·grilled sweet potatoes in grains, stir-fried lotus roots·stir-fried burdock, green laver salad·brown seaweed salads in vegetables, apples, tomato·cherry tomatoes in fruits, among plant-based items, and squid (raw, dried shredded, boiled, stir-fried) in meats·fish·eggs·beans, and curd type yogurt in milk·dairy products, among animal-based items, and no items for others. Items except for those mentioned above are designated to be significant only in males or females. That is, 8 items were significant only in males: steamed potatoes·grilled potatoes, other kimchi·fresh vegetable kimchi, orange and kiwi among plant-based items, stir-fried beef among animal-based items, green tea, sweet and sour pork·pork cutlet, and tteokbokki among others. The 17 items that were only significant to females were: cooked rice with grains and legumes, Korean cabbage kimchi, grilled laver·raw laver·laver salad, mung bean sprout (cooked salad, soup)·bean sprout, stir-fried mushrooms, stir-fried sea mustard stems, bananas, pears, strawberries, peaches among plant-based items, boiled eggs·steamed eggs and tofu·stir-fried tofu among animal-based items, butter·margarine, tofu stew·soft tofu stew, curry rice, rice cake soup, budae stew among others.
Comparison of energy/nutrients intake according to chewing difficulty
Table 4 shows the results of DC/NDC comparison in energy/nutrition intake based on the FFQ for males and females, respectively. All results include age, income, and subjective health status as confounding variables to examine the effects of chewing difficulty on energy/nutrition intake. For male subjects, intake levels of energy (DC: 2,364.34 kcal, NDC: 2,422.20 kcal), carbohydrates (DC: 358.98 g, NDC: 361.02 g), and vitamin C (DC: 358.98 g, NDC: 361.02 g) showed significantly lower levels in DC than in NDC. For female subjects, intake levels of dietary fibers (DC: 19.88 g, NDC: 20.15 g) and vitamin C (DC: 118.38 g, NDC: 124.0 g) showed significantly lower levels in DC than in NDC. These results seem to bear a connection of the results in Table 3 where females showed 13 items to be significant in vegetables and fruits while males showed 7 items. In other words, vegetables and fruits are good sources of dietary fibers and vitamin C, and the more difficulties with chewing, the less intake of vegetables and fruits [67]. In addition, female subjects showed an especially higher correlation between energy/nutrition intake and adjusted variables such as age and subjective health status than male subjects (data not shown). According to Park et al.'s study [7], compared to the elderly with no chewing difficulty, Korean elderly with chewing difficulty showed relatively lower energy consumption/nutrient (except vitamin A) intake to KDRI standard ratio. These were somewhat different results compared to this research conducted on adults.
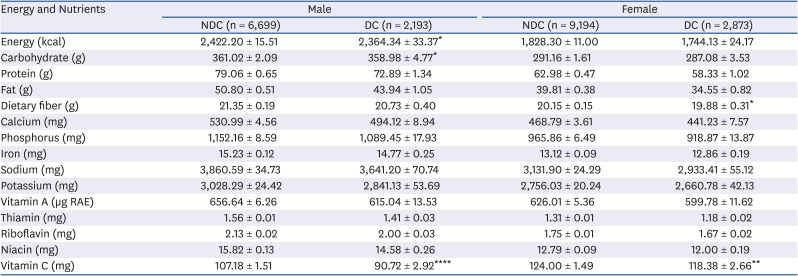
Table 4
Average daily energy and nutrient intake based on self-reported chewing ability in the FFQ of 2013–2016 KNHANES
Mean ± SE for weekly consumption frequencies of FFQ items.
FFQ, food frequency questionnaire; KNHANES, Korea National Health and Nutrition Examination Survey; NDC, not difficult in chewing; DC, difficult in chewing; RAE, retinol activity equivalents.
*P < 0.05, **P < 0.01, ***P < 0.001, ****P < 0.0001 by one-sided survey regression test after adjusted for age, household income, and self-rated health status.
![]()
Go to :
DISCUSSION
This study aimed to determine whether consumption frequencies of 116 foods or dishes included in the FFQ were affected by chewing difficulty among adult subjects aged between 19 and 64 yrs using the 2013–2016 KNHANES data. The 4-yrs integrated data were analyzed, and the results showed that a proportion of the elderly aged over 65 yrs who had chewing difficulty was 45.4% whereas that of the adults was 24.3%. The reasons for the analysis of the adults whose proportion of chewing difficulty was somewhat low were as follows. First, the FFQ data was more appropriate than the 24-h recall data to determine the normal food consumption. The KNHANES data only provided the 24-h recall data of subjects aged over 65 yrs without providing FFQ data. Second, the elderly not only had chewing difficulty but also various other health problems associated with aging. Thus, the effect of aging and diseases could not effectively controlled in the association between food consumption and chewing difficulty.
Prior to in-depth discussion of the study results, it is necessary to discuss the adoption of confounding variables including subject age, monthly average household income level, and subjective health and gender stratified data analysis. The effects of gender, age, and income level on food consumption have been well expressed in the analysis of studies conducted overseas and KNHANES data. According to a study with Japanese subjects aged between 20 and 69 yrs, a significant difference in food consumption was found according to age and gender as seasoning, fish, noodle, and loaf bread were presented as a major supply source of total sodium intake [21]. In a Hawaii-Los Angeles Multiethnic Cohort study which examined sex differences in reported food portions from 24-h dietary recalls (24-h recalls) among those who selected the same portion size category on a quantitative food frequency questionnaire, mean intake amounts from 24-h recalls were significantly higher for men than for women for certain foods such as beef/lamb/veal, white rice, and lettuce/tossed salad [22]. Fourteen days of food grocery receipts were analyzed and high-income families bought more vegetables and dairy products and fewer frozen desserts and the quality of meals represented by the healthy eating index (HEI) was significantly higher than those of low-income families [23]. Findings on the relationship between egg consumption and metabolic syndrome based on the analysis of the 2007-2008 FFQ of KNHANES included that the egg consumption level was significantly related to gender, age, and income level [24]. According to a study by Baik et al. (2017) that reported the relationship between milk and dairy product intake and bone health of Korean adults using the 2008-2011 KNHANES data, milk intake level was significantly different according to gender and age [25]. Next, the present study utilized the subjective health status as a confounding variable in statistical analyses instead of directly investigating the relationship between chewing difficulty and the prevalence rate of chronic diseases. Lee and Lee [26] found that the subjective health status variable well represented the health status of the subjects in a study on the development of health status assessment tool based on dietary patterns in middle-aged women. Moreover, Lee et al. [27] reported that symptoms of menopause, dietary habits, appetite, and body mass index were the most predictive factors for the middle-aged women's subjective health status, suggesting a potential relationship between subjective health status and dietary habits. Based on these findings, adoption of the variables of age, household income, and subjective health status as confounding variables deems necessary.
In this study, the number of individual food items in terms of food groups that were significantly more frequently consumed by males and females were investigated. In brief, the food consumption frequency by one gender was significantly higher than that of the other in 62% of all items (males: 37 items vs. females: 35 items). In particular, the consumption frequency of beverages and alcohols as significantly higher in males whereas that of fruits and milk·dairy products was significantly higher in females. This strong correlation result between genders and food consumption can also be found in previous studies [22232425262728]. For instance, the FoodNet research (a large-scale dietary life survey for the prevention of food poisoning in the USA, 14,878 participants) showed that men consume more meat and poultry, while women consume more vegetables and fruit. In addition, men consumed more animal-based foods while women consumed more plant-based items in terms of food poisoning source-foods intake. Shiferaw et al. [28] therefore claimed that gender stratification prior to an investigation of food consumption ratio helped derive the food types related to gender-specific diseases. Therefore, the decision was made to perform a gender-stratified analysis to show clearer effect of chewing difficulty on food intake frequency by gender in this study.
In addition, studies on chewing difficulty in relation with gender, age, education level, and systemic diseases including chronic diseases have also been discussed [3429]. A face-to-face study with adults and the elderly throughout the UK showed the relationship between oral health and the quality of life was more positive as the socioeconomic level was higher and more negative among female subjects. Furthermore, adults perceived the relationship stronger than did the elderly [10]. In recent years, Kim [3] discussed the correlation between chewing difficulty and chronic disease, in which a level of chewing difficulty was significantly correlated with subjective health condition [30]. Given the study results mentioned above, the stratification of subjects by gender and inclusion of age, income level, and subjective health status as confounding variables in this study adjusted the impact of those variables on food consumption, thereby better explaining the correlation between chewing difficulty and food consumption. In fact, a considerable difference was exhibited when the adjusted results were compared with unadjusted results, indicating that the current status could be well-revealed by the statistical adjustment.
It may be worthwhile to discuss in depth the results shown in Table 1. In the grains group, sweet potato is one of the typical root and tuber crops and contains high amount of dietary fiber [31]. A study reported that most starches contained in sweet potato were changed to dextrin and maltose when heated and cooked, and adhesion and cohesion increased over time when adding sweet potato starch to steamed rice-cake [32]. Thus, the reduced consumption of steamed sweet potatoes·grilled sweet potatoes in the DC was presumed as a result of higher amount of dietary fiber and high adhesion inside the mouth. The reduced consumption of steamed potatoes·grilled potatoes can also be understood in the same context due to the high content of starches in potatoes. Loaf bread is characterized by its chewy texture due to low moisture content and the formation of gluten. According to the Raw Data Utilization Standards of KNHANES, the results of the loaf bread item included both white and whole-grain wheat loaf bread [17]. The result could be affected by the recent increase in consumption of loaf bread made of whole grains, which has been promoted in the healthy bread marketing by local bakeries in recent years. Interestingly enough, the consumption frequency of baksulki·sirutteok·injeolmi·jeolpyeon (various steamed white rice cake) was expected to be lower in the DC than the NDC due to the unique stickiness and chewiness, but obtained no statistical significance because their consumption frequency itself was very low to begin with. Park et al. [7] reported that the chewing difficulty group showed a significantly low consumption of bread, confectioneries, noodles, and dumplings whereas Kwon et al. [6] reported no significant difference in the consumption of grains and potatoes between groups. Both these studies [67] analyzed one-day meals by the 24-h recall method to test the relationship between chewing difficulty of the elderly and food consumption in terms of food group. To the contrary, this study presented analysis results of the FFQ that is known to estimate normal food consumption and indicated statistical significance at an individual food or dish level in adults. Therefore, there exist many constraints that make direct comparison with preexisting literature very difficult. Similarly, findings on the association between seaweeds consumption and chewing seemed inconsistent among studies. In the present study, the DC's consumption of green laver salad·brown seaweed salad, and stir-fried sea mustard stems were significantly low compared to that of the NDC. The 2007–2010 KNHANES data indicated a lower consumption of seaweeds by the elderly [7], but only the consumption of vegetables excluding seaweeds and mushrooms were significantly low in the 2013 KNHANES data [6]. This discrepancy may be attributed in part to the fact that this study analyzed the FFQ conducted with adults, not 24-h recall method with elderly. According to a study, senior welfare center users disliked vegetables due to their chewing difficulty as a result of the tough textures [5]. In recent years, the Korea Food Research Institute introduced tenderized vegetable products that were easy to eat by controlling the physical properties of samples using the freeze–thaw enzyme impregnation method [33]. For the elderly who follow a vegetarian diet, it is more necessary to develop vegetable products or menus that are easy to eat because vegetables are their main source of vitamins, minerals, and dietary fibers [34].
In the meat·fish·eggs·beans group, anchovies·stir-fried anchovies, which were commonly consumed foods by Koreans but avoided by the elderly due to the strong and hard texture, were expected to show reduced consumption due to chewing difficulty, but had no significant difference. According to a study, the elderly in senior welfare centers recognized meat and seafood as more chewy and hard to swallow compared to vegetables, nuts, fruits, kimchi, and other foods. And their low preference of meat and fishes was due to missing teeth or health status and chewing difficulty [35]. Thus, the efforts for the development of easy-to-chew meat products has increased by utilizing enzyme injection or tissue reshaping approaches [3637]. Considering meat, fish, eggs, and beans are major sources of protein in Korean's diet, it is necessary to pay attention to the development of foods and menus that can help the elderly to consume those foods more frequently considering their chewing difficulty and reduced digestion function. Next, the curd type yogurt showed decrease in consumption according to chewing difficulty but liquid type yogurt was not affected by chewing difficulty in this study. That is, the results show that even with the same substance, difference in textural characteristics can bring difference in relation with chewing difficulty. It may be that the present study could indicate the correlation between food intake and chewing difficulty more clearly by using FFQ data that systematically includes Korean's daily consumed individual foods instead of 24-h recall data.
Tables 2 and 3 indicated 17 vs. 26 items to be significant in males and females analyses, respectively. This showed (especially for males) that only certain items were included in the results of Tables 2 and 3 when compared to the 34 items shown significant in Table 1 where all participants have been dealt with. Fig. 1 visualized the common items that the food consumption by the DC was significantly lower than that of the NDC in both males and females after adjustment for the effects of age, income, and subjective health status, along with the items that applicable to only one gender. The significantly less frequently consumed foods in both genders were nine items including 3, 2, 2, 1, and 1 items in grains, vegetables, fruits, meats·fish·eggs·beans, and milk·dairy products, respectively. Looking into these nine items, loaf bread, ready-to-eat cereal, sweet potatoes, lotus roots, burdock, green laver, sea mustard, apple, tomato, and squid were known to contain relatively high dietary fiber content or a high content of connective tissues or were considered as foods to avoid by those with chewing difficulty due to strong or hard texture [6733343536]. It was also noteworthy that the number of significant items for females was five whereas that for males was only one in vegetable group, suggesting vegetables consumption exhibited the most significant difference between males and females. The previous studies on the elderly reported that the elderly preferred grains, vegetables, or soft fruits to seafood or meats in relation to missing teeth or health status. They also preferred steamed foods to fried, as well as completely cooked or semi-cooked to instant food types [533]. Since the present study directly analyzed a commonly used food list based on the KNHANES FFQ of Korean adults, its results are meaningfully different from previous studies as it identified the in-depth relationship between individual foods and chewing difficulty beyond identifying the preference of food group.
The number of items presented in Table 1, which was an integrated analysis result of all subjects in this study, was 34. The sum significant items by males, females, and those in common between both genders was also 34 as presented in Fig. 1. However, when investigating the individual items, the union of Tables 2 and 3 is different from that of Table 1. That is, eight items including cucumbers (seasoned, raw), cooked broccoli·cooked cabbages, tangerines, melons, grapes, milk·low fat milk, jam, dried pollack soup in Table 1 were no longer significant in the analysis results when males and females were analyzed separately. In addition, two items including oranges and sweet and sour pork·pork cutlets were added in the male-only analysis (Table 2) although not included in Table 1, and six items including cabbage kimchi, grilled laver·raw laver·laver salad, mung bean sprout (cooked salad, soup)·bean sprout, stir-fried mushrooms, tofu stew·soft tofu stew, budae stew were added in the female-only analysis (Table 3). Table 1 was an analysis considering the effect of gender as it included gender as one of the confounding variables whereas Tables 2 and 3 were an analysis without considering gender at all since they stratified gender and divided the sample. The items presented in common in Tables 2 and 3 showed items where consumption was reduced due to chewing difficulty regardless of gender stratification. The eight items that were presented in Table 1 but not presented in Tables 2 and 3 were likely to occur due to the difference in statistical power caused by a different impact level of chewing difficulty by gender on food consumption or the reduction in the number of samples caused by gender stratification. Two items only included in Table 2 and 6 items only shown in Table 3 were not significant in Table 1 because the effect of one gender was minimal or in opposite direction compared to the other gender. Accordingly, it might be that the characteristics of gender could be well revealed in the process of gender-stratified analyses. Thus, studies on the investigation of the relationship between food consumption and researchers' topics of interest can provide more in-depth analysis results by revealing homogeneity and heterogeneity of food consumption held by males and females by comparing the integrated and separated male-female data.
DC consumed significantly less energy and carbohydrates than NDC in males, but not in females. Dietary fiber was only significant in females and vitamin C obtained significance in both genders (Table 4). Further discussion is needed to fully comprehend the results. First, given the high proportion of carbohydrates consumed in total calories in general, it is estimated that significantly higher levels of carbohydrates in NDC have affected their higher energy intake. It is also estimated that for malesmen, only seven items of vegetable and fruits groups were significantly less consumed in DC than NDC, whereas for femaleswomen, 13 items were significantly different, so the statistical significance may have been obtained only in females. Second, most of the nutrients except for energy, carbohydrates, dietary fiber and vitamin C were not significant in either males or females. It might be linked to the fact that only 17 items (14.7%) in males and 26 items (22.4%) in females out of the total 116 items appeared to be significant (Tables 2 and 3). Therefore, the bigger portion of items which were non-significant remained unexplained in terms of energy and nutrients intake. Third, the seemingly strong correlations between food group and energy and nutrients intake in the literature [67] could be partly explained by 24-hr recall method, in which every single food and dish consumed must be taken into consideration at the energy and nutrient analysis step. Therefore, such correlations could not be expected in the present study where the FFQ method was adopted.
Despite that the present study had an advantage of the in-depth identification of current food consumption frequencies according to chewing difficulty by utilizing FFQ of KNHANES—integrated data over 4 yrs, this study had a limitation. That is, the elderly were not included as the study subjects although they were major subjects of chewing difficulty in general due to the lack of KNHANES data. Nonetheless, the validity of the study results was improved in part by analyzing the data with the adjustment for the effect of the subjective health status of the subject whose disease prevalence rate is relatively lower than that of the elderly. In summation, the present study added some insights into our understanding of the association between chewing difficulty and food consumption behavior using one of the most representative samples of the Korea community. Major strengths of this study may include the usefulness of gender stratification and adoption of significant confounding variables, and in-depth information obtained through the use of FFQ data instead of 24-h recall data. Finally, the overall study findings suggest chewing difficulty may be an important nutritional issue that has to be dealt with for healthful food consumption, with distinct interest of gender. Recently elderly-friendly foods have been included in the nation's ‘the 5 food sectors for fostering industry’ plan and is receiving profound attention from the people and ever-increasing politic support from the government [38]. According to some studies, the elderly generally preferred fully cooked simple meals to pre-processed or semi-cooked products [533]. Given the rapid aging of Korean society, the increase in single-person households, and the chewing difficulty problem of the elderly, the need for an in-depth discussion about the development of soft and easy-to-chew foods and a strategy to spread such type of foods has increased. It is also crucial to address the chewing difficulty issues as one of the most important health issues to facilitate a healthier dietary life, and thus calls for the bilateral approach of development in food science technology as well as welfare policies.
Go to :
 XML Download