Journal List > Nutr Res Pract > v.14(6) > 1145287

Ham, Cho, Park, Park, Kim, Seol, Park, Woo, Joung, and Lim: Inverse association of improved adherence to dietary guidelines with metabolic syndrome: the Seoul Metabolic Syndrome Management program

Abstract

BACKGROUND/OBJECTIVES

The Seoul Metabolic Syndrome Management (SMESY) program is a 1-yr lifestyle modification program targeting metabolic syndrome (MetS) in Seoul residents. This study investigated the associations between adherence to dietary guidelines and MetS among the SMESY program participants.

SUBJECTS/METHODS

Data of 54,385 participants aged 20–64 yrs who completed the SMESY program in 2015, had information on adherence to dietary guidelines, and were not medicated for diabetes, hypertension, or dyslipidemia were analyzed. Participants underwent MetS screening and completed a lifestyle questionnaire including adherence to 10 dietary guidelines before and after participation. Participants were classified according to the number of MetS risk factors at baseline (MetS group, ≥ 3; risk group, 1–2; healthy group, none). Adherence to dietary guidelines was determined from the number of “yes” responses regarding the fulfillment of each guideline on ≥ 5 days/week. Multiple logistic regression was used to evaluate associations between newly diagnosed MetS and changes in adherence to dietary guidelines.

RESULTS

In the MetS group, MetS prevalence decreased after the SMESY program (men, −41.9%p; women, −48.7%p), and all risk factors were significantly improved (P < 0.0001). All groups exhibited improved adherence to all dietary guidelines after participation (P < 0.0001). In the MetS group with positively changed adherence scores, the MetS prevalence decreased by −44.1%p for men and −49.5%p for women, whereas the prevalence in those with negative changes decreased by −38.1%p for men and −48.6%p for women. In the risk group, those with positively changed adherence scores had significantly decreased odds ratios (ORs) for newly diagnosed MetS compared with those with negative changes (OR, 0.70; 95% confidence interval [CI], 0.61–0.80 for men; OR, 0.88; 95% CI, 0.79–0.99 for women).

CONCLUSIONS

The SMESY program may effectively reduce the risk of MetS among adults with risk factors by improving adherence to dietary guidelines.

INTRODUCTION

Metabolic syndrome (MetS) is defined as the presence of ≥ 3 metabolic risk factors, including abdominal obesity, high blood pressure, high fasting glucose level, high triglyceride (TG) level, and low high-density lipoprotein cholesterol (HDL-C) level [12]. MetS is well known to be associated with risks of major non-communicable diseases (NCDs) such as cardiovascular diseases, the leading cause of deaths worldwide [34]. A systematic review reported that approximately 20% of adults in the Asia-Pacific region had MetS [5]. Consistent with that finding, the prevalence of MetS among Koreans who received national health screening has increased steadily and reached 26.0% in 2017 [6]. Accordingly, the rapid and steady increases in NCD-related morbidity and mortality worldwide have led to major concerns regarding the effects of MetS on public health [7].
Extensive investigations of the associations between MetS and dietary factors have indicated that the consumption of whole grains, fruits, vegetables, and dairy products correlated inversely with MetS [89101112], whereas the excessive intake of red or processed meat, saturated fat, and sodium was associated with higher MetS risk [131415]. A previous study conducted among Korean adults reported that diet quality scores based on the regular intake of recommended food groups such as fruits and vegetables were inversely associated with MetS [16].
Dietary guidelines for the general population, such as Dietary Guidelines for Americans and French National Nutrition and Health Program Guideline, were developed according to the evidence on the relationship between dietary factors and MetS. These guidelines have been introduced to promote healthful dietary behavior and, as a result, decrease the risk of MetS [1718]. Several subsequent studies have reported an inverse relationship between adherence to dietary guidelines and the risk of MetS [192021222324]. According to a previous study conducted in the US, adherence to Dietary Guidelines for Americans showed inverse associations with the prevalence of abdominal obesity and high fasting glucose level [19]. Similarly, improvement in adherence to the French National Nutrition and Health Program Guideline significantly lowered the incidence of MetS [20]. Among Korean adults, those who did not adhere to recommendations on dairy product or fruit intake suggested by the Korean Food Guidance System in Dietary Reference Intakes for Koreans had an increased likelihood of having MetS [21].
The Government of Seoul Metropolitan City (capital of South Korea) designed a lifestyle modification program, the Seoul Metabolic Syndrome Management (SMESY) program, which aimed to target the growing number of residents with MetS and NCDs in 2011. The SMESY program assesses the participants' dietary behaviors based on 10 dietary guidelines recommended by the Dietary Guidelines for Korean Adults. According to a previous analysis of the SMESY program data from 2013, the participants' average adherence scores to the dietary guidelines increased after 12 mon, compared with the baseline [25].
However, no study has investigated the effects of adherence to dietary guidelines on MetS prevalence or the effects of changes in adherence to each dietary guideline on MetS prevention after the SMESY program. Therefore, this study aimed to elucidate the effectiveness of dietary intervention in the context of the SMESY program by investigating the associations between adherence to dietary guidelines and MetS among participants.

SUBJECTS AND METHODS

Data source and study population

The SMESY program is a 1-yr lifestyle modification program that addresses improving behaviors of diet, physical activity, alcohol consumption, and smoking. In 2011, it was implemented at 25 public health centers in Seoul after a pilot study conducted at 15 public health centers in 2010. Any citizen can voluntarily enroll to the program. Public health centers provide health examinations to the participants and classify them into 3 groups according to the number of MetS risk factors: MetS group, ≥ 3; risk group, 1–2; and healthy group, none. These groups are asked to undergo additional health examinations at public health centers at different intervals during a 1-yr follow-up period: MetS group, after 3, 6, 9, and 12 mon; risk group, after 6 and 12 mon; and healthy group, after 12 mon. After each health examination, the participants are also requested to complete a self-reported questionnaire regarding health-related lifestyle behaviors, including adherence to dietary guidelines, smoking, alcohol consumption, and physical activity. After assessing the health status and lifestyles, all participants receive text messages which provide information on how to improve health behaviors (once per week for the MetS group; once per 2 weeks for the risk group; once per month for the healthy group) and are instructed to attend regular lifestyle counseling (once per 3 mon for the MetS group; once per 6 mon for the risk group; at baseline for the healthy group). The text messages contain advice regarding healthy dietary patterns, smoking cessation, drinking alcohol in moderation, and performing regular physical activity. The lifestyle counseling includes 4 sessions about diet, smoking, alcohol consumption, and physical activity, which are organized by health professionals: dietary suggestions by registered dietitians, quitting smoking and drinking alcohol in moderation by doctors or nurses, and an exercise prescription by physical activity specialists. Detailed information about the SMESY program is available elsewhere [25262728].
Data from the SMESY program conducted in 2015 were included in the analyses. Of the 73,061 adults aged 20–64 yrs who completed the SMESY program in 2015, those who used medicines to treat diabetes, hypertension, or dyslipidemia (n = 15,349), or who had missing information on adherence to the dietary guidelines (n = 3,327) were excluded. Finally, the study population included 54,385 participants who had completed all sections of the SMESY program during a 1-yr period.
This study was approved by the Institutional Review Board of Korea University (KU-IRB-17-EX-160-A-1), and all participants provided written informed consent before participation.

Measurement of risk factors for MetS

Participants were asked to fast for 10 h before each health examination. The waist circumference (WC) was obtained using a measuring tape at the midpoint between the iliac crest and the lowest rib. Blood pressure was measured using an automated sphygmomanometer after a 10-min resting period. Fasting blood glucose (FBG) was determined using the glucose oxidase method [2629]. Blood TG and HDL-C levels were measured using point-of-care testing systems with Lipid Pro, LABGEO PT10, and LDX® (23 public health centers) or venipuncture (2 public health centers) [25].
MetS was defined according to the National Cholesterol Education Program-Adult Treatment Panel III guideline [12] and the Korean standards of abdominal obesity presented by the Korean Society of the Study of Obesity [30]. The following criteria were used to identify MetS risk factors: WC ≥ 90 cm for men and ≥ 85 cm for women (abdominal obesity), systolic blood pressure (SBP) ≥ 130 mmHg or diastolic blood pressure (DBP) ≥ 85 mmHg (high blood pressure), FBG ≥ 100 mg/dL (high fasting glucose level), TG ≥ 150 mg/dL (high TG level), and HDL-C < 40 mg/dL for men and < 50 mg/dL for women (low HDL-C level). MetS was diagnosed when participants had ≥ 3 MetS risk factors.

Adherence to dietary guidelines

A questionnaire regarding adherence to dietary guidelines was developed by modifying the Dietary Guidelines for Korean Adults developed by the Korea Ministry of Health, Welfare and Family Affairs and the Korea Centers for Disease Control and Prevention in 2008 [31]. Among 23 detailed guidelines, 10 guidelines were selected for the questionnaire after excluding those which were related to alcohol consumption, physical activity, and food hygiene. The questionnaire that focused on adherence to the following guidelines was provided to participants who visited public health centers for health examinations: 1) I eat various kinds of grains and plenty of whole grains; 2) I eat ≥ 2 types of various colored vegetables at every meal; 3) I eat various seasonal fruits every day; 4) I eat dairy products (e.g., milk, yogurt, and cheese) every day; 5) I eat 3 meals a day regularly; 6) I eat a balanced Korean diet based on rice and various side dishes; 7) I avoid salty foods or salty soup; 8) I avoid adding extra table salt or soy sauce to foods; 9) I trim off the fat of meat before eating; and 10) I avoid fried foods. Participants were asked to respond “yes” to each guideline that was fulfilled on ≥ 5 days per week. The adherence score was calculated as the number of guidelines to which the participants provided a “yes” response.

Demographic variables and health-related lifestyle behaviors

Participants were asked to complete the self-reported questionnaires regarding demographic variables and health-related lifestyle behaviors. Information about sex, age group (20–39, 40–59, 60–64 yrs), monthly household income (low, < 2,000,000 Korean won; medium, 2,000,000–3,999,999 Korean won; high, ≥ 4,000,000 Korean won), education level (≤ middle school, high school, ≥ college), marital status (yes, no), and health-related lifestyle behaviors (smoking, alcohol consumption, physical activity) was collected.
Smoking was used to categorize participants into 3 groups: never smokers (never smoked during one's lifetime), past smokers (had smoked previously but not at present), and current smokers (currently smoking at baseline). Alcohol consumption was also used to classify participants into 3 groups according to drinking frequency: non-drinkers (had not consumed alcohol for > 1 yr), moderate drinkers (≤ 2–3 times/mon), and heavy drinkers (≥ 2 times/week). Physical activity level was calculated as the metabolic equivalents (MET)-minutes per week according to the International Physical Activity Questionnaire scoring protocol based on information about the type of physical activity (walking, moderate-intensity activity, vigorous-intensity activity), daily duration (min), and days per week on which each type of physical activity was performed [3233]. The levels were used to further categorize participants into three groups: inactive (< 600 MET-minutes/week), moderate (600–3,000 MET-minutes/week), and vigorous (> 3,000 MET-minutes/week).

Statistical analysis

All analyses were conducted after stratifying the participants according to the MetS risk status (12,352 people in the MetS group; 32,685 people in the risk group; 9,348 people in the healthy group). Statistical Analysis System software version 9.4 (SAS 9.4, SAS Institute, Cary, NC, USA) was used for all analyses. A 2-sided P-value < 0.05 was considered statistically significant.
We calculated the frequencies of each category corresponding to the general characteristics at baseline (e.g., sex, age group, education level, monthly household income, marital status, smoking, alcohol consumption, physical activity) in each group of participants based on the MetS risk status. Mean differences in the levels of MetS risk factors from the baseline to after the SMESY program were compared using a paired t-test, and significant changes in the prevalence of these risk factors were analyzed using McNemar's test. We also calculated the percentages of participants who answered “yes” regarding the fulfillment of each dietary guideline and the total adherence scores before and after the SMESY program. We further classified the participants into 4 subgroups according to the change in adherence to the dietary guidelines: negatively changed, unchanged I (participants with low adherence scores at baseline, 0–5), unchanged II (participants with high adherence scores at baseline, 6–10), and positively changed. A multiple logistic regression was conducted for the risk group and the healthy group to obtain odds ratios (ORs) and 95% confidence intervals (CI) for newly diagnosed MetS according to changes in the adherence to dietary guidelines after adjusting for general characteristics. A statistical model fit of the logistic regression was evaluated by Hosmer and Lemeshow goodness-of-fit statistics [34].

RESULTS

General characteristics of study participants

Table 1 presents the general characteristics of the participants at baseline according to the MetS risk status. The distribution of demographic variables among the participants (age, education level, monthly household income, marital status) and health-related lifestyle behaviors (smoking, alcohol consumption, physical activity) differed significantly according to the MetS risk status (all P < 0.0001). The MetS group tended to be older, have lower household incomes, smoke more currently and in the past, drink alcohol more heavily, and perform less physical activity than the risk and the healthy groups.
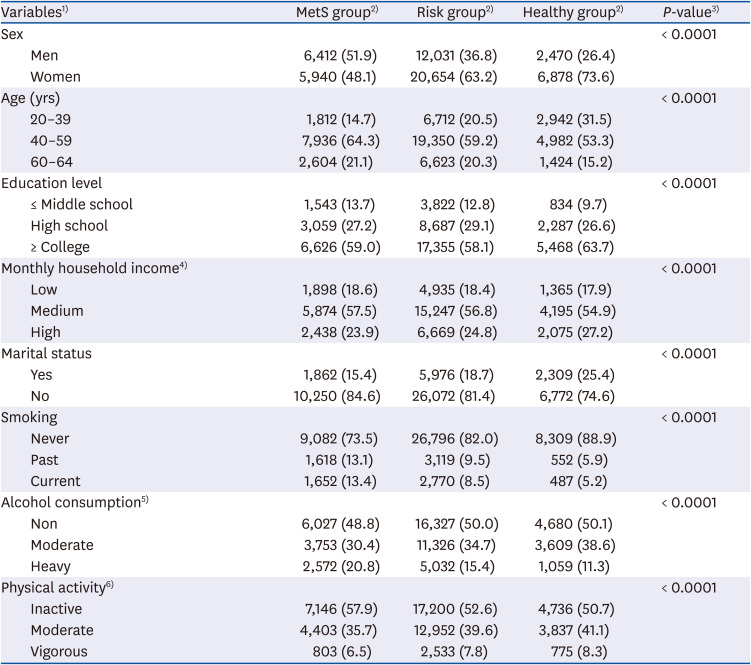
Table 1

General characteristics of participants at baseline according to the MetS risk status

nrp-14-621-i001
Variables1) MetS group2) Risk group2) Healthy group2) P-value3)
Sex < 0.0001
Men 6,412 (51.9) 12,031 (36.8) 2,470 (26.4)
Women 5,940 (48.1) 20,654 (63.2) 6,878 (73.6)
Age (yrs) < 0.0001
20–39 1,812 (14.7) 6,712 (20.5) 2,942 (31.5)
40–59 7,936 (64.3) 19,350 (59.2) 4,982 (53.3)
60–64 2,604 (21.1) 6,623 (20.3) 1,424 (15.2)
Education level < 0.0001
≤ Middle school 1,543 (13.7) 3,822 (12.8) 834 (9.7)
High school 3,059 (27.2) 8,687 (29.1) 2,287 (26.6)
≥ College 6,626 (59.0) 17,355 (58.1) 5,468 (63.7)
Monthly household income4) < 0.0001
Low 1,898 (18.6) 4,935 (18.4) 1,365 (17.9)
Medium 5,874 (57.5) 15,247 (56.8) 4,195 (54.9)
High 2,438 (23.9) 6,669 (24.8) 2,075 (27.2)
Marital status < 0.0001
Yes 1,862 (15.4) 5,976 (18.7) 2,309 (25.4)
No 10,250 (84.6) 26,072 (81.4) 6,772 (74.6)
Smoking < 0.0001
Never 9,082 (73.5) 26,796 (82.0) 8,309 (88.9)
Past 1,618 (13.1) 3,119 (9.5) 552 (5.9)
Current 1,652 (13.4) 2,770 (8.5) 487 (5.2)
Alcohol consumption5) < 0.0001
Non 6,027 (48.8) 16,327 (50.0) 4,680 (50.1)
Moderate 3,753 (30.4) 11,326 (34.7) 3,609 (38.6)
Heavy 2,572 (20.8) 5,032 (15.4) 1,059 (11.3)
Physical activity6) < 0.0001
Inactive 7,146 (57.9) 17,200 (52.6) 4,736 (50.7)
Moderate 4,403 (35.7) 12,952 (39.6) 3,837 (41.1)
Vigorous 803 (6.5) 2,533 (7.8) 775 (8.3)
Data shown are number (%) not otherwise specified.
MetS, metabolic syndrome; MET, metabolic equivalents.
1)The number of missing values were 4,704 for education level, 9,689 for monthly household income, and 1,144 for marital status, respectively.
2)Participants were classified according to the number of MetS risk factors: MetS group, ≥ 3; risk group, 1–2; healthy group, none.
3)P-values were obtained from a χ2 test.
4)Low: < 2,000,000 Korean won/mon; medium: 2,000,000–3,999,999 Korean won/mon; high: ≥ 4,000,000 Korean won/mon.
5)Non: participants who had not consumed alcohol for > 1 yr; moderate: ≤ 2–3 times/month; heavy: ≥ 2 times/week.
6)Inactive: < 600 MET-minutes/week; moderate: 600–3,000 MET-minutes/week; vigorous: > 3,000 MET-minutes/week.

Changes in MetS risk factors and their prevalence

Table 2 compares the levels and prevalence of participants with MetS risk factors before and after the SMESY program. In the MetS group, the prevalence of MetS decreased by 41.9%p in men and 48.7%p in women, and the prevalence of all MetS risk factors decreased significantly in both sexes (all P < 0.0001). Of the 5 MetS risk factors, the greatest decreases in both men and women were observed in the prevalence of low HDL-C level (−26.6%p and −26.9%p, respectively). In the risk group, the prevalence of abdominal obesity (only in women), high blood pressure, high fasting glucose level (only in women), and low HDL-C level decreased after the SMESY program. However, a significant increase in prevalence of high TG level was observed in men. In the healthy group, the prevalence of all MetS risk factors increased after the SMESY program.
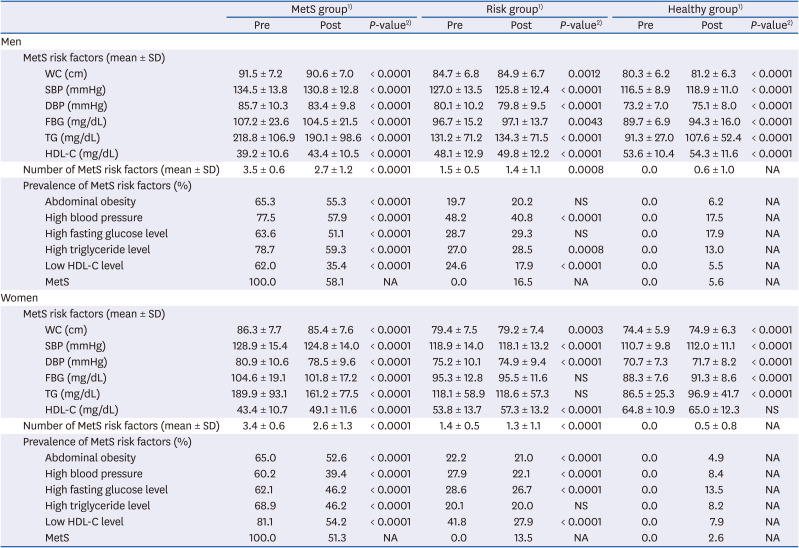
Table 2

Changes in levels of MetS risk factors and the prevalence of participants with risk factors according to the MetS risk status

nrp-14-621-i002
MetS group1) Risk group1) Healthy group1)
Pre Post P-value2) Pre Post P-value2) Pre Post P-value2)
Men
MetS risk factors (mean ± SD)
WC (cm) 91.5 ± 7.2 90.6 ± 7.0 < 0.0001 84.7 ± 6.8 84.9 ± 6.7 0.0012 80.3 ± 6.2 81.2 ± 6.3 < 0.0001
SBP (mmHg) 134.5 ± 13.8 130.8 ± 12.8 < 0.0001 127.0 ± 13.5 125.8 ± 12.4 < 0.0001 116.5 ± 8.9 118.9 ± 11.0 < 0.0001
DBP (mmHg) 85.7 ± 10.3 83.4 ± 9.8 < 0.0001 80.1 ± 10.2 79.8 ± 9.5 < 0.0001 73.2 ± 7.0 75.1 ± 8.0 < 0.0001
FBG (mg/dL) 107.2 ± 23.6 104.5 ± 21.5 < 0.0001 96.7 ± 15.2 97.1 ± 13.7 0.0043 89.7 ± 6.9 94.3 ± 16.0 < 0.0001
TG (mg/dL) 218.8 ± 106.9 190.1 ± 98.6 < 0.0001 131.2 ± 71.2 134.3 ± 71.5 < 0.0001 91.3 ± 27.0 107.6 ± 52.4 < 0.0001
HDL-C (mg/dL) 39.2 ± 10.6 43.4 ± 10.5 < 0.0001 48.1 ± 12.9 49.8 ± 12.2 < 0.0001 53.6 ± 10.4 54.3 ± 11.6 < 0.0001
Number of MetS risk factors (mean ± SD) 3.5 ± 0.6 2.7 ± 1.2 < 0.0001 1.5 ± 0.5 1.4 ± 1.1 0.0008 0.0 0.6 ± 1.0 NA
Prevalence of MetS risk factors (%)
Abdominal obesity 65.3 55.3 < 0.0001 19.7 20.2 NS 0.0 6.2 NA
High blood pressure 77.5 57.9 < 0.0001 48.2 40.8 < 0.0001 0.0 17.5 NA
High fasting glucose level 63.6 51.1 < 0.0001 28.7 29.3 NS 0.0 17.9 NA
High triglyceride level 78.7 59.3 < 0.0001 27.0 28.5 0.0008 0.0 13.0 NA
Low HDL-C level 62.0 35.4 < 0.0001 24.6 17.9 < 0.0001 0.0 5.5 NA
MetS 100.0 58.1 NA 0.0 16.5 NA 0.0 5.6 NA
Women
MetS risk factors (mean ± SD)
WC (cm) 86.3 ± 7.7 85.4 ± 7.6 < 0.0001 79.4 ± 7.5 79.2 ± 7.4 0.0003 74.4 ± 5.9 74.9 ± 6.3 < 0.0001
SBP (mmHg) 128.9 ± 15.4 124.8 ± 14.0 < 0.0001 118.9 ± 14.0 118.1 ± 13.2 < 0.0001 110.7 ± 9.8 112.0 ± 11.1 < 0.0001
DBP (mmHg) 80.9 ± 10.6 78.5 ± 9.6 < 0.0001 75.2 ± 10.1 74.9 ± 9.4 < 0.0001 70.7 ± 7.3 71.7 ± 8.2 < 0.0001
FBG (mg/dL) 104.6 ± 19.1 101.8 ± 17.2 < 0.0001 95.3 ± 12.8 95.5 ± 11.6 NS 88.3 ± 7.6 91.3 ± 8.6 < 0.0001
TG (mg/dL) 189.9 ± 93.1 161.2 ± 77.5 < 0.0001 118.1 ± 58.9 118.6 ± 57.3 NS 86.5 ± 25.3 96.9 ± 41.7 < 0.0001
HDL-C (mg/dL) 43.4 ± 10.7 49.1 ± 11.6 < 0.0001 53.8 ± 13.7 57.3 ± 13.2 < 0.0001 64.8 ± 10.9 65.0 ± 12.3 NS
Number of MetS risk factors (mean ± SD) 3.4 ± 0.6 2.6 ± 1.3 < 0.0001 1.4 ± 0.5 1.3 ± 1.1 < 0.0001 0.0 0.5 ± 0.8 NA
Prevalence of MetS risk factors (%)
Abdominal obesity 65.0 52.6 < 0.0001 22.2 21.0 < 0.0001 0.0 4.9 NA
High blood pressure 60.2 39.4 < 0.0001 27.9 22.1 < 0.0001 0.0 8.4 NA
High fasting glucose level 62.1 46.2 < 0.0001 28.6 26.7 < 0.0001 0.0 13.5 NA
High triglyceride level 68.9 46.2 < 0.0001 20.1 20.0 NS 0.0 8.2 NA
Low HDL-C level 81.1 54.2 < 0.0001 41.8 27.9 < 0.0001 0.0 7.9 NA
MetS 100.0 51.3 NA 0.0 13.5 NA 0.0 2.6 NA
MetS, metabolic syndrome; WC, waist circumference; SBP, systolic blood pressure; DBP, diastolic blood pressure; FBG, fasting blood glucose; TG, triglyceride; HDL-C, high-density lipoprotein cholesterol; NA, not applicable; NS, not significant.
1)Participants were classified according to the number of MetS risk factors: MetS group, ≥ 3; risk group, 1–2; healthy group, none.
2)Mean differences between pre- and post-program were tested using a paired t-test, and changes in prevalence of MetS risk factors were tested using a McNemar's test.

Association of changes in adherence to dietary guidelines with MetS

Table 3 presents the changes in adherence to the dietary guidelines from before to after the SMESY program. All 3 groups exhibited significantly improved adherence to all dietary guidelines. Among men and women in the MetS group, those who answered “yes” to “I avoid salty foods or salty soup” (+11.2%p, P < 0.0001) and “I eat various seasonal fruits every day” (+7.6%p, P < 0.0001) exhibited the greatest improvements respectively relative to the baseline. The average total adherence scores increased significantly in the MetS group (+0.9 for men; +0.6 for women; P < 0.0001), which were greater than the changes in the risk group and the healthy group (risk group, +0.6 for men and +0.5 for women; healthy group, +0.7 for men and +0.5 for women; all P < 0.0001).
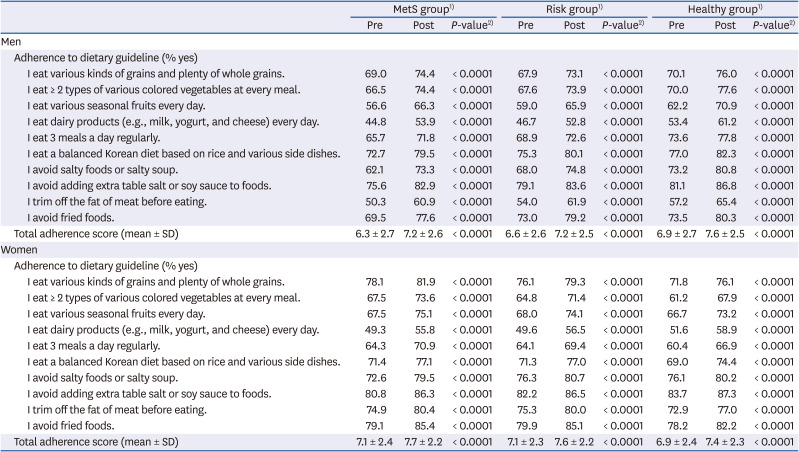
Table 3

Changes in adherence to dietary guidelines according to the MetS risk status

nrp-14-621-i003
MetS group1) Risk group1) Healthy group1)
Pre Post P-value2) Pre Post P-value2) Pre Post P-value2)
Men
Adherence to dietary guideline (% yes)
I eat various kinds of grains and plenty of whole grains. 69.0 74.4 < 0.0001 67.9 73.1 < 0.0001 70.1 76.0 < 0.0001
I eat ≥ 2 types of various colored vegetables at every meal. 66.5 74.4 < 0.0001 67.6 73.9 < 0.0001 70.0 77.6 < 0.0001
I eat various seasonal fruits every day. 56.6 66.3 < 0.0001 59.0 65.9 < 0.0001 62.2 70.9 < 0.0001
I eat dairy products (e.g., milk, yogurt, and cheese) every day. 44.8 53.9 < 0.0001 46.7 52.8 < 0.0001 53.4 61.2 < 0.0001
I eat 3 meals a day regularly. 65.7 71.8 < 0.0001 68.9 72.6 < 0.0001 73.6 77.8 < 0.0001
I eat a balanced Korean diet based on rice and various side dishes. 72.7 79.5 < 0.0001 75.3 80.1 < 0.0001 77.0 82.3 < 0.0001
I avoid salty foods or salty soup. 62.1 73.3 < 0.0001 68.0 74.8 < 0.0001 73.2 80.8 < 0.0001
I avoid adding extra table salt or soy sauce to foods. 75.6 82.9 < 0.0001 79.1 83.6 < 0.0001 81.1 86.8 < 0.0001
I trim off the fat of meat before eating. 50.3 60.9 < 0.0001 54.0 61.9 < 0.0001 57.2 65.4 < 0.0001
I avoid fried foods. 69.5 77.6 < 0.0001 73.0 79.2 < 0.0001 73.5 80.3 < 0.0001
Total adherence score (mean ± SD) 6.3 ± 2.7 7.2 ± 2.6 < 0.0001 6.6 ± 2.6 7.2 ± 2.5 < 0.0001 6.9 ± 2.7 7.6 ± 2.5 < 0.0001
Women
Adherence to dietary guideline (% yes)
I eat various kinds of grains and plenty of whole grains. 78.1 81.9 < 0.0001 76.1 79.3 < 0.0001 71.8 76.1 < 0.0001
I eat ≥ 2 types of various colored vegetables at every meal. 67.5 73.6 < 0.0001 64.8 71.4 < 0.0001 61.2 67.9 < 0.0001
I eat various seasonal fruits every day. 67.5 75.1 < 0.0001 68.0 74.1 < 0.0001 66.7 73.2 < 0.0001
I eat dairy products (e.g., milk, yogurt, and cheese) every day. 49.3 55.8 < 0.0001 49.6 56.5 < 0.0001 51.6 58.9 < 0.0001
I eat 3 meals a day regularly. 64.3 70.9 < 0.0001 64.1 69.4 < 0.0001 60.4 66.9 < 0.0001
I eat a balanced Korean diet based on rice and various side dishes. 71.4 77.1 < 0.0001 71.3 77.0 < 0.0001 69.0 74.4 < 0.0001
I avoid salty foods or salty soup. 72.6 79.5 < 0.0001 76.3 80.7 < 0.0001 76.1 80.2 < 0.0001
I avoid adding extra table salt or soy sauce to foods. 80.8 86.3 < 0.0001 82.2 86.5 < 0.0001 83.7 87.3 < 0.0001
I trim off the fat of meat before eating. 74.9 80.4 < 0.0001 75.3 80.0 < 0.0001 72.9 77.0 < 0.0001
I avoid fried foods. 79.1 85.4 < 0.0001 79.9 85.1 < 0.0001 78.2 82.2 < 0.0001
Total adherence score (mean ± SD) 7.1 ± 2.4 7.7 ± 2.2 < 0.0001 7.1 ± 2.3 7.6 ± 2.2 < 0.0001 6.9 ± 2.4 7.4 ± 2.3 < 0.0001
MetS, metabolic syndrome.
1)Participants were classified according to the number of MetS risk factors: MetS group, ≥ 3; risk group 1–2; healthy group, none.
2)Changes in adherence to each dietary guideline were tested using a McNemar's test, and changes in total adherence scores were tested using a paired t-test.
Table 4 compares the changes in levels of MetS risk factors and prevalence of participants with MetS risk factors among the MetS group according to the changes in adherence to dietary guidelines. The levels of MetS risk factors showed significant improvements after the SMESY program, regardless of the changes in adherence score to dietary guidelines in both sexes, except the FBG levels of men in the unchanged I subgroup after 1 yr. In the MetS group with positively changed adherence scores, the prevalence of MetS decreased by −44.1%p for men and −49.5%p for women, whereas the prevalence in those with negatively changed adherence scores decreased by −38.1%p for men and −48.6%p for women.
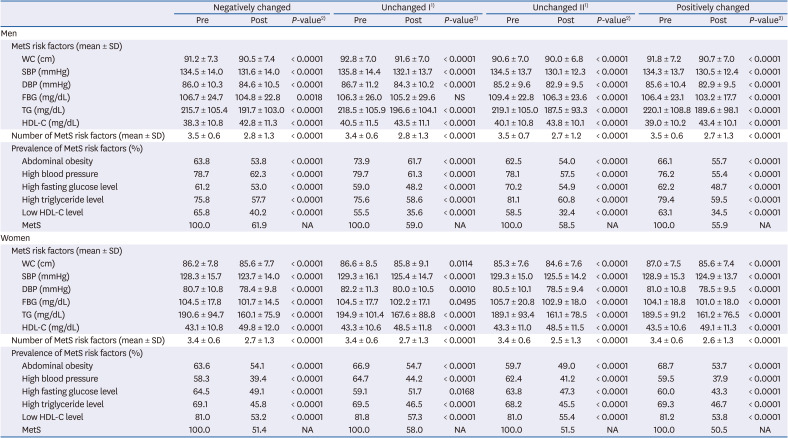
Table 4

Changes in levels of MetS risk factors and the prevalence of participants with risk factors according to changes in adherence to dietary guidelines among the MetS group

nrp-14-621-i004
Negatively changed Unchanged I1) Unchanged II1) Positively changed
Pre Post P-value2) Pre Post P-value2) Pre Post P-value2) Pre Post P-value2)
Men
MetS risk factors (mean ± SD)
WC (cm) 91.2 ± 7.3 90.5 ± 7.4 < 0.0001 92.8 ± 7.0 91.6 ± 7.0 < 0.0001 90.6 ± 7.0 90.0 ± 6.8 < 0.0001 91.8 ± 7.2 90.7 ± 7.0 < 0.0001
SBP (mmHg) 134.5 ± 14.0 131.6 ± 14.0 < 0.0001 135.8 ± 14.4 132.1 ± 13.7 < 0.0001 134.5 ± 13.7 130.1 ± 12.3 < 0.0001 134.3 ± 13.7 130.5 ± 12.4 < 0.0001
DBP (mmHg) 86.0 ± 10.3 84.6 ± 10.5 < 0.0001 86.7 ± 11.2 84.3 ± 10.2 < 0.0001 85.2 ± 9.6 82.9 ± 9.5 < 0.0001 85.6 ± 10.4 82.9 ± 9.5 < 0.0001
FBG (mg/dL) 106.7 ± 24.7 104.8 ± 22.8 0.0018 106.3 ± 26.0 105.2 ± 29.6 NS 109.4 ± 22.8 106.3 ± 23.6 < 0.0001 106.4 ± 23.1 103.2 ± 17.7 < 0.0001
TG (mg/dL) 215.7 ± 105.4 191.7 ± 103.0 < 0.0001 218.5 ± 105.9 196.6 ± 104.1 < 0.0001 219.1 ± 105.0 187.5 ± 93.3 < 0.0001 220.1 ± 108.8 189.6 ± 98.1 < 0.0001
HDL-C (mg/dL) 38.3 ± 10.8 42.8 ± 11.3 < 0.0001 40.5 ± 11.5 43.5 ± 11.1 < 0.0001 40.1 ± 10.8 43.8 ± 10.1 < 0.0001 39.0 ± 10.2 43.4 ± 10.1 < 0.0001
Number of MetS risk factors (mean ± SD) 3.5 ± 0.6 2.8 ± 1.3 < 0.0001 3.4 ± 0.6 2.8 ± 1.3 < 0.0001 3.5 ± 0.7 2.7 ± 1.2 < 0.0001 3.5 ± 0.6 2.7 ± 1.3 < 0.0001
Prevalence of MetS risk factors (%)
Abdominal obesity 63.8 53.8 < 0.0001 73.9 61.7 < 0.0001 62.5 54.0 < 0.0001 66.1 55.7 < 0.0001
High blood pressure 78.7 62.3 < 0.0001 79.7 61.3 < 0.0001 78.1 57.5 < 0.0001 76.2 55.4 < 0.0001
High fasting glucose level 61.2 53.0 < 0.0001 59.0 48.2 < 0.0001 70.2 54.9 < 0.0001 62.2 48.7 < 0.0001
High triglyceride level 75.8 57.7 < 0.0001 75.6 58.6 < 0.0001 81.1 60.8 < 0.0001 79.4 59.5 < 0.0001
Low HDL-C level 65.8 40.2 < 0.0001 55.5 35.6 < 0.0001 58.5 32.4 < 0.0001 63.1 34.5 < 0.0001
MetS 100.0 61.9 NA 100.0 59.0 NA 100.0 58.5 NA 100.0 55.9 NA
Women
MetS risk factors (mean ± SD)
WC (cm) 86.2 ± 7.8 85.6 ± 7.7 < 0.0001 86.6 ± 8.5 85.8 ± 9.1 0.0114 85.3 ± 7.6 84.6 ± 7.6 < 0.0001 87.0 ± 7.5 85.6 ± 7.4 < 0.0001
SBP (mmHg) 128.3 ± 15.7 123.7 ± 14.0 < 0.0001 129.3 ± 16.1 125.4 ± 14.7 < 0.0001 129.3 ± 15.0 125.5 ± 14.2 < 0.0001 128.9 ± 15.3 124.9 ± 13.7 < 0.0001
DBP (mmHg) 80.7 ± 10.8 78.4 ± 9.8 < 0.0001 82.2 ± 11.3 80.0 ± 10.5 0.0010 80.5 ± 10.1 78.5 ± 9.4 < 0.0001 81.0 ± 10.8 78.5 ± 9.5 < 0.0001
FBG (mg/dL) 104.5 ± 17.8 101.7 ± 14.5 < 0.0001 104.5 ± 17.7 102.2 ± 17.1 0.0495 105.7 ± 20.8 102.9 ± 18.0 < 0.0001 104.1 ± 18.8 101.0 ± 18.0 < 0.0001
TG (mg/dL) 190.6 ± 94.7 160.1 ± 75.9 < 0.0001 194.9 ± 101.4 167.6 ± 88.8 < 0.0001 189.1 ± 93.4 161.1 ± 78.5 < 0.0001 189.5 ± 91.2 161.2 ± 76.5 < 0.0001
HDL-C (mg/dL) 43.1 ± 10.8 49.8 ± 12.0 < 0.0001 43.3 ± 10.6 48.5 ± 11.8 < 0.0001 43.3 ± 11.0 48.5 ± 11.5 < 0.0001 43.5 ± 10.6 49.1 ± 11.3 < 0.0001
Number of MetS risk factors (mean ± SD) 3.4 ± 0.6 2.7 ± 1.3 < 0.0001 3.4 ± 0.6 2.7 ± 1.3 < 0.0001 3.4 ± 0.6 2.5 ± 1.3 < 0.0001 3.4 ± 0.6 2.6 ± 1.3 < 0.0001
Prevalence of MetS risk factors (%)
Abdominal obesity 63.6 54.1 < 0.0001 66.9 54.7 < 0.0001 59.7 49.0 < 0.0001 68.7 53.7 < 0.0001
High blood pressure 58.3 39.4 < 0.0001 64.7 44.2 < 0.0001 62.4 41.2 < 0.0001 59.5 37.9 < 0.0001
High fasting glucose level 64.5 49.1 < 0.0001 59.1 51.7 0.0168 63.8 47.3 < 0.0001 60.0 43.3 < 0.0001
High triglyceride level 69.1 45.8 < 0.0001 69.5 46.5 < 0.0001 68.2 45.5 < 0.0001 69.3 46.7 < 0.0001
Low HDL-C level 81.0 53.2 < 0.0001 81.8 57.3 < 0.0001 81.0 55.4 < 0.0001 81.2 53.8 < 0.0001
MetS 100.0 51.4 NA 100.0 58.0 NA 100.0 51.5 NA 100.0 50.5 NA
MetS, metabolic syndrome; WC, waist circumference; SBP, systolic blood pressure; DBP, diastolic blood pressure; FBG, fasting blood glucose; TG, triglyceride; HDL-C, high-density lipoprotein cholesterol; NA, not applicable; NS, not significant.
1)Unchanged I: the participants with low adherence scores (0–5) to the dietary guidelines at baseline; Unchanged II: the participants with high adherence scores (6–10) to the dietary guidelines at baseline
2)Mean differences between pre- and post-program were tested using a paired t-test, and changes in prevalence of MetS risk factors were tested using a McNemar's test.
Table 5 presents association of changes in adherence to dietary guidelines with newly diagnosed MetS among the risk and healthy groups. Among men in the risk group, the participants with positive changes in adherence to all dietary guidelines except adherence to “I avoid adding extra table salt or soy sauce to foods” showed significant decreases in the prevalence of newly diagnosed MetS compared with the participants with negatively changed adherence (range of ORs, 0.67–0.77; all P < 0.05). Among women in the risk group, the participants with positive changes in adherence to the dietary guidelines such as “I eat various kinds of grains and plenty of whole grains” (OR, 0.77; 95% CI, 0.62–0.95), “I eat a balanced Korean diet based on rice and various side dishes” (OR, 0.68; 95% CI, 0.57–0.82), and “I trim off the fat of meat before eating” (OR, 0.81; 95% CI, 0.66–0.99) had significantly decreased prevalence of newly diagnosed MetS. Similarly, in both sexes, an improvement in the total adherence score was inversely associated with newly diagnosed MetS (OR, 0.70; 95% CI, 0.61–0.80 for men; OR, 0.88; 95% CI, 0.79–0.99 for women). Moreover, men in the unchanged II subgroup of the risk group showed a decreased prevalence of newly diagnosed MetS (OR, 0.61; 95% CI, 0.53–0.71), whereas those in the unchanged I subgroup did not show significant change. Among women in the healthy group, significant reductions of ORs for newly diagnosed MetS were observed in the unchanged II subgroup for “I eat ≥ 2 types of various colored vegetables at every meal” (OR, 0.59; 95% CI, 0.35–0.99) and unchanged I/II subgroups for “I eat dairy products (e.g., milk, yogurt, and cheese) every day” (OR, 0.43; 95% CI, 0.22–0.83 for unchanged I; OR, 0.55; 95% CI, 0.33–0.92 for unchanged II). Among the men, the positively changed adherence to “I avoid adding extra table salt or soy sauce to foods” lowered the OR for newly diagnosed MetS (OR, 0.07; 95% CI, 0.01–0.60).
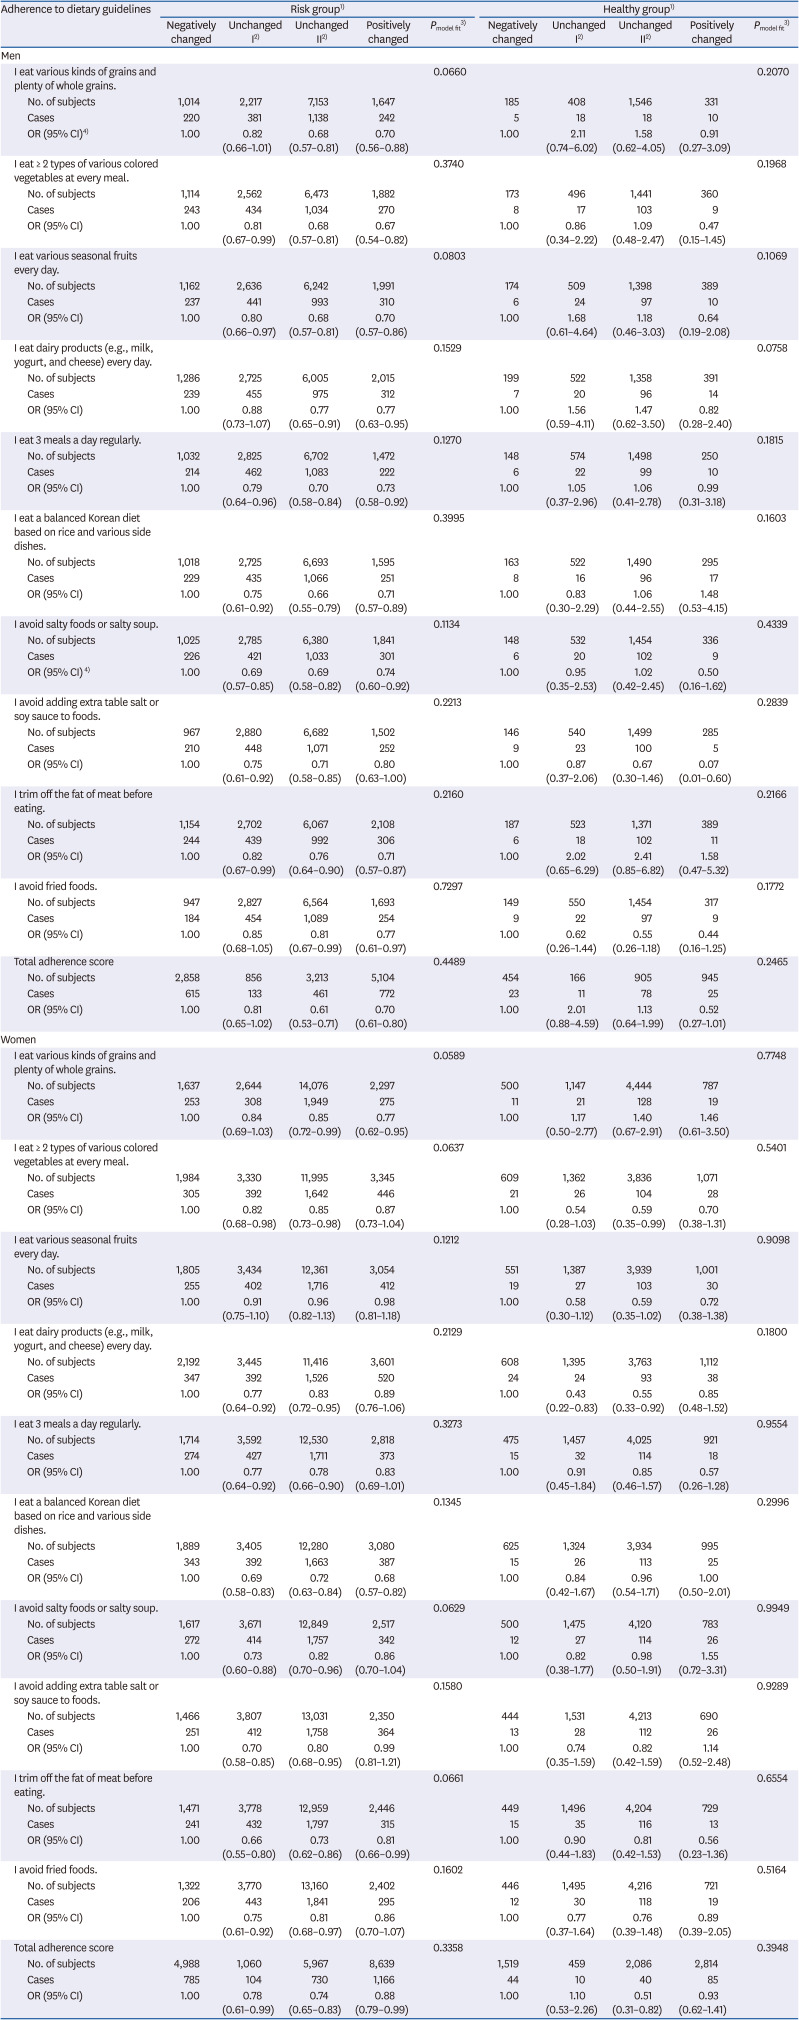
Table 5

ORs and 95% CIs of newly diagnosed MetS according to changes in adherence to dietary guidelines among the risk and healthy groups

nrp-14-621-i005
Adherence to dietary guidelines Risk group1) Healthy group1)
Negatively changed Unchanged I2) Unchanged II2) Positively changed Pmodel fit3) Negatively changed Unchanged I2) Unchanged II2) Positively changed Pmodel fit3)
Men
I eat various kinds of grains and plenty of whole grains. 0.0660 0.2070
No. of subjects 1,014 2,217 7,153 1,647 185 408 1,546 331
Cases 220 381 1,138 242 5 18 18 10
OR (95% CI)4) 1.00 0.82 (0.66–1.01) 0.68 (0.57–0.81) 0.70 (0.56–0.88) 1.00 2.11 (0.74–6.02) 1.58 (0.62–4.05) 0.91 (0.27–3.09)
I eat ≥ 2 types of various colored vegetables at every meal. 0.3740 0.1968
No. of subjects 1,114 2,562 6,473 1,882 173 496 1,441 360
Cases 243 434 1,034 270 8 17 103 9
OR (95% CI) 1.00 0.81 (0.67–0.99) 0.68 (0.57–0.81) 0.67 (0.54–0.82) 1.00 0.86 (0.34–2.22) 1.09 (0.48–2.47) 0.47 (0.15–1.45)
I eat various seasonal fruits every day. 0.0803 0.1069
No. of subjects 1,162 2,636 6,242 1,991 174 509 1,398 389
Cases 237 441 993 310 6 24 97 10
OR (95% CI) 1.00 0.80 (0.66–0.97) 0.68 (0.57–0.81) 0.70 (0.57–0.86) 1.00 1.68 (0.61–4.64) 1.18 (0.46–3.03) 0.64 (0.19–2.08)
I eat dairy products (e.g., milk, yogurt, and cheese) every day. 0.1529 0.0758
No. of subjects 1,286 2,725 6,005 2,015 199 522 1,358 391
Cases 239 455 975 312 7 20 96 14
OR (95% CI) 1.00 0.88 (0.73–1.07) 0.77 (0.65–0.91) 0.77 (0.63–0.95) 1.00 1.56 (0.59–4.11) 1.47 (0.62–3.50) 0.82 (0.28–2.40)
I eat 3 meals a day regularly. 0.1270 0.1815
No. of subjects 1,032 2,825 6,702 1,472 148 574 1,498 250
Cases 214 462 1,083 222 6 22 99 10
OR (95% CI) 1.00 0.79 (0.64–0.96) 0.70 (0.58–0.84) 0.73 (0.58–0.92) 1.00 1.05 (0.37–2.96) 1.06 (0.41–2.78) 0.99 (0.31–3.18)
I eat a balanced Korean diet based on rice and various side dishes. 0.3995 0.1603
No. of subjects 1,018 2,725 6,693 1,595 163 522 1,490 295
Cases 229 435 1,066 251 8 16 96 17
OR (95% CI) 1.00 0.75 (0.61–0.92) 0.66 (0.55–0.79) 0.71 (0.57–0.89) 1.00 0.83 (0.30–2.29) 1.06 (0.44–2.55) 1.48 (0.53–4.15)
I avoid salty foods or salty soup. 0.1134 0.4339
No. of subjects 1,025 2,785 6,380 1,841 148 532 1,454 336
Cases 226 421 1,033 301 6 20 102 9
OR (95% CI) 4) 1.00 0.69 (0.57–0.85) 0.69 (0.58–0.82) 0.74 (0.60–0.92) 1.00 0.95 (0.35–2.53) 1.02 (0.42–2.45) 0.50 (0.16–1.62)
I avoid adding extra table salt or soy sauce to foods. 0.2213 0.2839
No. of subjects 967 2,880 6,682 1,502 146 540 1,499 285
Cases 210 448 1,071 252 9 23 100 5
OR (95% CI) 1.00 0.75 (0.61–0.92) 0.71 (0.58–0.85) 0.80 (0.63–1.00) 1.00 0.87 (0.37–2.06) 0.67 (0.30–1.46) 0.07 (0.01–0.60)
I trim off the fat of meat before eating. 0.2160 0.2166
No. of subjects 1,154 2,702 6,067 2,108 187 523 1,371 389
Cases 244 439 992 306 6 18 102 11
OR (95% CI) 1.00 0.82 (0.67–0.99) 0.76 (0.64–0.90) 0.71 (0.57–0.87) 1.00 2.02 (0.65–6.29) 2.41 (0.85–6.82) 1.58 (0.47–5.32)
I avoid fried foods. 0.7297 0.1772
No. of subjects 947 2,827 6,564 1,693 149 550 1,454 317
Cases 184 454 1,089 254 9 22 97 9
OR (95% CI) 1.00 0.85 (0.68–1.05) 0.81 (0.67–0.99) 0.77 (0.61–0.97) 1.00 0.62 (0.26–1.44) 0.55 (0.26–1.18) 0.44 (0.16–1.25)
Total adherence score 0.4489 0.2465
No. of subjects 2,858 856 3,213 5,104 454 166 905 945
Cases 615 133 461 772 23 11 78 25
OR (95% CI) 1.00 0.81 (0.65–1.02) 0.61 (0.53–0.71) 0.70 (0.61–0.80) 1.00 2.01 (0.88–4.59) 1.13 (0.64–1.99) 0.52 (0.27–1.01)
Women
I eat various kinds of grains and plenty of whole grains. 0.0589 0.7748
No. of subjects 1,637 2,644 14,076 2,297 500 1,147 4,444 787
Cases 253 308 1,949 275 11 21 128 19
OR (95% CI) 1.00 0.84 (0.69–1.03) 0.85 (0.72–0.99) 0.77 (0.62–0.95) 1.00 1.17 (0.50–2.77) 1.40 (0.67–2.91) 1.46 (0.61–3.50)
I eat ≥ 2 types of various colored vegetables at every meal. 0.0637 0.5401
No. of subjects 1,984 3,330 11,995 3,345 609 1,362 3,836 1,071
Cases 305 392 1,642 446 21 26 104 28
OR (95% CI) 1.00 0.82 (0.68–0.98) 0.85 (0.73–0.98) 0.87 (0.73–1.04) 1.00 0.54 (0.28–1.03) 0.59 (0.35–0.99) 0.70 (0.38–1.31)
I eat various seasonal fruits every day. 0.1212 0.9098
No. of subjects 1,805 3,434 12,361 3,054 551 1,387 3,939 1,001
Cases 255 402 1,716 412 19 27 103 30
OR (95% CI) 1.00 0.91 (0.75–1.10) 0.96 (0.82–1.13) 0.98 (0.81–1.18) 1.00 0.58 (0.30–1.12) 0.59 (0.35–1.02) 0.72 (0.38–1.38)
I eat dairy products (e.g., milk, yogurt, and cheese) every day. 0.2129 0.1800
No. of subjects 2,192 3,445 11,416 3,601 608 1,395 3,763 1,112
Cases 347 392 1,526 520 24 24 93 38
OR (95% CI) 1.00 0.77 (0.64–0.92) 0.83 (0.72–0.95) 0.89 (0.76–1.06) 1.00 0.43 (0.22–0.83) 0.55 (0.33–0.92) 0.85 (0.48–1.52)
I eat 3 meals a day regularly. 0.3273 0.9554
No. of subjects 1,714 3,592 12,530 2,818 475 1,457 4,025 921
Cases 274 427 1,711 373 15 32 114 18
OR (95% CI) 1.00 0.77 (0.64–0.92) 0.78 (0.66–0.90) 0.83 (0.69–1.01) 1.00 0.91 (0.45–1.84) 0.85 (0.46–1.57) 0.57 (0.26–1.28)
I eat a balanced Korean diet based on rice and various side dishes. 0.1345 0.2996
No. of subjects 1,889 3,405 12,280 3,080 625 1,324 3,934 995
Cases 343 392 1,663 387 15 26 113 25
OR (95% CI) 1.00 0.69 (0.58–0.83) 0.72 (0.63–0.84) 0.68 (0.57–0.82) 1.00 0.84 (0.42–1.67) 0.96 (0.54–1.71) 1.00 (0.50–2.01)
I avoid salty foods or salty soup. 0.0629 0.9949
No. of subjects 1,617 3,671 12,849 2,517 500 1,475 4,120 783
Cases 272 414 1,757 342 12 27 114 26
OR (95% CI) 1.00 0.73 (0.60–0.88) 0.82 (0.70–0.96) 0.86 (0.70–1.04) 1.00 0.82 (0.38–1.77) 0.98 (0.50–1.91) 1.55 (0.72–3.31)
I avoid adding extra table salt or soy sauce to foods. 0.1580 0.9289
No. of subjects 1,466 3,807 13,031 2,350 444 1,531 4,213 690
Cases 251 412 1,758 364 13 28 112 26
OR (95% CI) 1.00 0.70 (0.58–0.85) 0.80 (0.68–0.95) 0.99 (0.81–1.21) 1.00 0.74 (0.35–1.59) 0.82 (0.42–1.59) 1.14 (0.52–2.48)
I trim off the fat of meat before eating. 0.0661 0.6554
No. of subjects 1,471 3,778 12,959 2,446 449 1,496 4,204 729
Cases 241 432 1,797 315 15 35 116 13
OR (95% CI) 1.00 0.66 (0.55–0.80) 0.73 (0.62–0.86) 0.81 (0.66–0.99) 1.00 0.90 (0.44–1.83) 0.81 (0.42–1.53) 0.56 (0.23–1.36)
I avoid fried foods. 0.1602 0.5164
No. of subjects 1,322 3,770 13,160 2,402 446 1,495 4,216 721
Cases 206 443 1,841 295 12 30 118 19
OR (95% CI) 1.00 0.75 (0.61–0.92) 0.81 (0.68–0.97) 0.86 (0.70–1.07) 1.00 0.77 (0.37–1.64) 0.76 (0.39–1.48) 0.89 (0.39–2.05)
Total adherence score 0.3358 0.3948
No. of subjects 4,988 1,060 5,967 8,639 1,519 459 2,086 2,814
Cases 785 104 730 1,166 44 10 40 85
OR (95% CI) 1.00 0.78 (0.61–0.99) 0.74 (0.65–0.83) 0.88 (0.79–0.99) 1.00 1.10 (0.53–2.26) 0.51 (0.31–0.82) 0.93 (0.62–1.41)
MetS, metabolic syndrome; OR, odds ratio; CI, confidence interval.
1)Participants were classified according to the number of MetS risk factors: risk group, 1–2; healthy group, none.
2)Unchanged I: the participants whose adherence to each dietary guideline was ‘no’ or with low adherence score (0–5) at baseline; Unchanged II: the participants whose adherence to each dietary guideline was ‘yes’ or with high adherence score (6–10) at baseline.
3)Pmodel fit was obtained from Hosmer and Lemeshow goodness-of-fit test.
4)ORs and 95% CIs were obtained from a multiple logistic regression adjusted for age, education level, monthly household income, marital status, smoking, alcohol consumption, and physical activity.

DISCUSSION

This study investigated the associations between adherence to dietary guidelines and MetS among participants in the SMESY program. Adherence to the dietary guidelines was enhanced after the SMESY program in all groups. Furthermore, the participants with positively changed adherence to the dietary guidelines had significant improvements in the levels and the prevalence of MetS risk factors.
In our study, the levels of all MetS risk factors were improved significantly in the MetS group after 12 mon, but improvements in MetS risk factors were observed partially in the risk group. Moreover, the MetS group exhibited the greatest increase in the adherence scores to the dietary guidelines from before to after the program, compared with the risk and healthy groups. These results are consistent with those of previous studies of the SMESY program [2526]. It is assumed that group differences in the changes of the levels of MetS risk factors and adherence to the dietary guidelines were due to different frequencies of text message provision and lifestyle counseling for the groups. Similarly, according to a study of a 10-week dietary modification program for employees in a Korean company, participants with MetS who were provided 3 sessions of group nutrition education and individual counseling showed improvement in WC, SBP, DBP, and HDL-C levels, whereas others who did not receive education or counseling showed no significant change except in glycated hemoglobin level [35]. In a randomized controlled trial of MetS patients in Italy, the intervention group, who received 1 yr of active counseling regarding health-related lifestyle factors (diet, alcohol consumption, and physical activity) delivered by professionals, exhibited a greater decrease in the prevalence of MetS and significant improvements in dietary behavior, compared with the control group [36]. These results imply that frequent feedback such as through text messages and active counseling for lifestyle modification in the program can effectively motivate participants to improve their health-related lifestyle behaviors.
A previous systematic review of lifestyle modification programs suggested that changes in lipid profiles during a program should be considered together with various long-term lifestyle behaviors such as diet, smoking, alcohol consumption, and physical activity [37]. In our study, we observed post-program decreases in the prevalence of low HDL-C level and high TG level in the MetS group. Several studies have reported changes in lipid profiles from before to after the lifestyle modification programs; however, the results have been inconsistent. Bo et al. [36] reported a significant decrease in the TG level but no significant change in the HDL-C level in participants of a lifestyle modification program. In another study, MetS patients who adhered to the American Heart Association (AHA) dietary guidelines for 1 yr also exhibited a significant improvement in TG level after the program compared with the baseline [38]. According to Mensink et al. [39], a lifestyle modification program did not contribute to changes in TG and HDL-C levels of Dutch adults. An Australian study conducted by Pettman et al. [40] reported that improvements in the HDL-C level was instead greater in the control group than in the intervention group after a 4-mon program. These previous findings demonstrate the need for further investigations about the long-term effectiveness of interventions for blood lipid levels and the possible interactions of various lifestyle factors (smoking, alcohol consumption, and physical activity).
In this study, among participants in the MetS group, adherence to the guideline “I avoid salty foods or salty soup” improved the most after the program in men, and adherence to the guideline “I avoid adding extra table salt or soy sauce to foods” was the highest after participation in both men and women. Several epidemiological studies have demonstrated that sodium intake was strongly associated with MetS [144142]. Among Koreans, the sodium intake is generally known to exceed the recommendations of the Dietary Reference Intakes for Korean, AHA, and World Health Organization [43]. The 2 previous studies based on the Korea National Health and Nutrition Examination Surveys during 2007–2009 and 2009–2011 found that only 13.9% and 18.5% of Korean adults, respectively, reported a sodium consumption level of < 2,000 mg/day [4445]. Therefore, the finding that the SMESY program increased awareness about excessive sodium intake is inspiring. Further dietary interventions intended to target MetS should aim to raise awareness about the negative effects of excessive sodium consumption and adopt proper guidelines that encourage a low-sodium diet.
This study found that the prevalence of MetS among the MetS group decreased regardless of the subgroups stratified by the changes in adherence to dietary guidelines. This result implies that participation in the SMESY program effectively contributed to the decrease in MetS prevalence and the improvements in the levels of risk factors. However, the prevalence of MetS in the subgroup with negatively changed adherence decreased less than that in the subgroup with positively changed adherence in both men and women. Moreover, inverse associations between newly diagnosed MetS and improved adherence to dietary guidelines were identified in the risk group. This implies that not only the dietary behaviors at baseline but also changes in dietary behaviors throughout a lifestyle modification program are related to the MetS risk status after the program. Thus, it is necessary to provide continuous dietary management to the participants with negatively changed or unchanged adherence for effective treatment and prevention of MetS.
It was observed that positively changed adherence to the guideline “I eat a balanced Korean diet based on rice and various side dishes” was inversely associated with newly diagnosed MetS in the risk group. The Korean diet has recently received global recognition as a healthy diet. In a randomized feeding study, Schroeder et al. [46] reported that when compared with a typical American diet, a Korean diet led to reductions in the levels of total cholesterol, low-density lipoprotein cholesterol, and FBG. In another study, consumption of a traditional Korean diet containing rice and kimchi was associated with a lower risk of MetS, compared with a diet containing meat and alcohol [47]. According to Lee and Cho [48], a higher Korean dietary pattern score was associated with a lower risk of MetS. Our results may strengthen the evidence supporting the positive aspects of the Korean diet and suggest that this dietary pattern could help address the issue of increasing MetS prevalence.
This study had some limitations. First, the population was not randomly sampled; thus, the results might have selection bias. Specifically, people who visited public health centers and enrolled voluntarily in the SMESY program may have been more health-conscious than the general population. Second, the data might have recall bias because the self-reported questionnaires regarding lifestyle behaviors depended on the participants' memories. Third, the questionnaire regarding adherence to dietary guidelines was not validated although the guidelines were based on the Dietary Guidelines for Korean Adults developed by the government. Fourth, a Cox proportional hazards model could not be applied to this study, even though the data had the characteristics of a 1-yr cohort. Because all participants were followed for the same period, we could not verify whether the data satisfied the assumption of proportional hazards. However, we overcame this limitation by using a multiple logistic regression based on the newly diagnosed patients with MetS to obtain adjusted ORs, rather than simply calculating the crude incident rate ratios.
Despite these limitations, this study had strengths as it enabled large-scale data analyses based on a lifestyle modification program conducted by the Seoul Metropolitan Government. Furthermore, the findings of the present study support the need to include appropriate dietary guidelines in community-based lifestyle modification programs as well as to establish a long-term development plan for the SMESY program.
In conclusion, this study found that the participants with positively changed adherence to the dietary guidelines had significant improvements in the levels and the prevalence of MetS risk factors after the SMESY program. The results imply that greater enrollment in the SMESY program and provision of continuous monitoring system would lead to improvements in the overall health statuses of Seoul residents.

Notes

Funding: The Seoul Metabolic Syndrome Management program was conducted by the budget of Seoul Metropolitan Government and 25 autonomous districts (‘gu’) of Seoul Metropolitan City. The authors received no financial support for this work.

Conflict of Interest: The authors declare no potential conflicts of interests.

Author Contributions:

  • Conceptualization: Ham D, Cho Y, Joung H.

  • Data curation: Park MS, Park YS, Kim SY, Seol HM, Park YM, Woo S, Lim DS.

  • Formal analysis: Ham D, Cho Y.

  • Funding acquisition: Park MS, Park YM, Lim DS.

  • Investigation: Ham D, Cho Y, Joung H.

  • Methodology: Ham D, Cho Y, Joung H.

  • Project administration: Park MS, Park YM, Lim DS.

  • Resources: Park MS, Park YS, Kim SY, Seol HM, Park YM, Woo S, Lim DS.

  • Software: Ham D.

  • Supervision: Joung H, Lim DS.

  • Validation: Joung H.

  • Visualization: Ham D.

  • Writing - original draft: Ham D, Cho Y.

  • Writing - review & editing: Park MS, Park YM, Joung H, Lim DS.

References

1. Alberti KG, Eckel RH, Grundy SM, Zimmet PZ, Cleeman JI, Donato KA, Fruchart JC, James WP, Loria CM, Smith SC Jr. International Diabetes Federation Task Force on Epidemiology and Prevention. National Heart, Lung, and Blood Institute. American Heart Association. World Heart Federation. International Atherosclerosis Society. International Association for the Study of Obesity. Harmonizing the metabolic syndrome: a joint interim statement of the International Diabetes Federation Task Force on Epidemiology and Prevention; National Heart, Lung, and Blood Institute; American Heart Association; World Heart Federation; International Atherosclerosis Society; and International Association for the Study of Obesity. Circulation. 2009; 120:1640–1645. PMID: 19805654.
2. Expert Panel on Detection, Evaluation, and Treatment of High Blood Cholesterol in Adults. Executive summary of the third report of the National Cholesterol Education Program (NCEP) Expert Panel on Detection, Evaluation, and Treatment of High Blood Cholesterol in Adults (Adult Treatment Panel III). JAMA. 2001; 285:2486–2497. PMID: 11368702.
3. Eddy DM, Schlessinger L, Heikes K. The metabolic syndrome and cardiovascular risk: implications for clinical practice. Int J Obes. 2008; 32 Suppl 2:S5–10.
crossref
4. World Health Organization. Cardiovascular diseases (CVDs) [Internet]. Geneva: World Health Organization;2017. cited 2018 June 30. Available from: http://www.who.int/en/news-room/fact-sheets/detail/cardiovascular-diseases-(cvds).
5. Ranasinghe P, Mathangasinghe Y, Jayawardena R, Hills AP, Misra A. Prevalence and trends of metabolic syndrome among adults in the Asia-Pacific region: a systematic review. BMC Public Health. 2017; 17:101. PMID: 28109251.
crossref
6. Korean Statistical Information Service. National Health Examinations Statistics [Internet]. Wonju: National Health Insurance Service;2019. cited 2019 August 28. Available from: http://kosis.kr/index/index.do.
7. O'Neill S, O'Driscoll L. Metabolic syndrome: a closer look at the growing epidemic and its associated pathologies. Obes Rev. 2015; 16:1–12.
8. McKeown NM, Meigs JB, Liu S, Wilson PW, Jacques PF. Whole-grain intake is favorably associated with metabolic risk factors for type 2 diabetes and cardiovascular disease in the Framingham Offspring Study. Am J Clin Nutr. 2002; 76:390–398. PMID: 12145012.
crossref
9. Shin JY, Kim JY, Kang HT, Han KH, Shim JY. Effect of fruits and vegetables on metabolic syndrome: a systematic review and meta-analysis of randomized controlled trials. Int J Food Sci Nutr. 2015; 66:416–425. PMID: 25945735.
crossref
10. Lee CJ, Joung H. Milk intake is associated with metabolic syndrome -using data from the Korea National Health and Nutrition Examination Survey 2007~2010. Korean J Community Nutr. 2012; 17:795–804.
11. Hong S, Song Y, Lee KH, Lee HS, Lee M, Jee SH, Joung H. A fruit and dairy dietary pattern is associated with a reduced risk of metabolic syndrome. Metabolism. 2012; 61:883–890. PMID: 22209672.
crossref
12. Jun S, Ha K, Chung S, Joung H. Meat and milk intake in the rice-based Korean diet: impact on cancer and metabolic syndrome. Proc Nutr Soc. 2016; 75:374–384. PMID: 26975473.
crossref
13. Kim Y, Je Y. Meat consumption and risk of metabolic syndrome: results from the Korean population and a meta-analysis of observational studies. Nutrients. 2018; 10:E390. PMID: 29565803.
crossref
14. Rhee MY, Kim JH, Kim YS, Chung JW, Bae JH, Nah DY, Kim YK, Lee MM, Lim CY, Byun JE, Park HK, Kang BW, Kim JW, Kim SW. High sodium intake in women with metabolic syndrome. Korean Circ J. 2014; 44:30–36. PMID: 24497887.
crossref
15. Riccardi G, Giacco R, Rivellese AA. Dietary fat, insulin sensitivity and the metabolic syndrome. Clin Nutr. 2004; 23:447–456. PMID: 15297079.
crossref
16. Kim YJ, Hwang JY, Kim H, Park S, Kwon O. Diet quality, physical activity, and their association with metabolic syndrome in Korean adults. Nutrition. 2019; 59:138–144. PMID: 30471526.
crossref
17. DeSalvo KB, Olson R, Casavale KO. Dietary Guidelines for Americans. JAMA. 2016; 315:457–458. PMID: 26746707.
crossref
18. Hercberg S, Chat-Yung S, Chaulia M. The French National Nutrition and Health Program: 2001-2006-2010. Int J Public Health. 2008; 53:68–77. PMID: 18681335.
crossref
19. Fogli-Cawley JJ, Dwyer JT, Saltzman E, McCullough ML, Troy LM, Meigs JB, Jacques PF. The 2005 Dietary Guidelines for Americans and risk of the metabolic syndrome. Am J Clin Nutr. 2007; 86:1193–1201. PMID: 17921402.
crossref
20. Kesse-Guyot E, Fezeu L, Galan P, Hercberg S, Czernichow S, Castetbon K. Adherence to French nutritional guidelines is associated with lower risk of metabolic syndrome. J Nutr. 2011; 141:1134–1139. PMID: 21490288.
21. Jung HJ, Han SN, Song S, Paik HY, Baik HW, Joung H. Association between adherence to the Korean Food Guidance System and the risk of metabolic abnormalities in Koreans. Nutr Res Pract. 2011; 5:560–568. PMID: 22259682.
crossref
22. Al Thani M, Al Thani AA, Al-Chetachi W, Al Malki B, Khalifa SA, Bakri AH, Hwalla N, Naja F, Nasreddine L. Adherence to the Qatar dietary guidelines: a cross-sectional study of the gaps, determinants and association with cardiometabolic risk amongst adults. BMC Public Health. 2018; 18:503. PMID: 29661175.
crossref
23. Hosseini-Esfahani F, Jessri M, Mirmiran P, Bastan S, Azizi F. Adherence to dietary recommendations and risk of metabolic syndrome: Tehran Lipid and Glucose Study. Metabolism. 2010; 59:1833–1842. PMID: 20667561.
crossref
24. Lassale C, Galan P, Julia C, Fezeu L, Hercberg S, Kesse-Guyot E. Association between adherence to nutritional guidelines, the metabolic syndrome and adiposity markers in a French adult general population. PLoS One. 2013; 8:e76349. PMID: 24124548.
crossref
25. Choo J, Yoon SJ, Ryu H, Park MS, Lee HS, Park YM, Lim DS. The Seoul Metropolitan lifestyle intervention program and metabolic syndrome risk: a retrospective database study. Int J Environ Res Public Health. 2016; 13:E667. PMID: 27384576.
crossref
26. Lee YH, Yoon SJ, Kim HS, Oh SW, Ryu HS, Choo JA, Kim SN, Kim YA, Park MS, Park YS, Kim SY, Kwon AR. Design and preliminary results of a metropolitan lifestyle intervention program for people with metabolic syndrome in South Korea. Diabetes Res Clin Pract. 2013; 101:293–302. PMID: 23849812.
crossref
27. Metabolic Syndrome Management Center of Seoul Metropolitan Government. The Seoul Metabolic Syndrome Management program [Internet]. Seoul: Metabolic Syndrome Management Center of Seoul Metropolitan Government;2010. cited 2018 June 30. Available from: http://5check.or.kr/eng/eng_main.html.
28. Park MS, Park YS, Kim SY, Park S, Seol HM, Woo S, Cho S, Lim DS. Introduction and effectiveness of the Seoul Metabolic Syndrome Management. Public Health Aff. 2017; 1:25–39.
crossref
29. Trinder P. Determination of glucose in blood using glucose oxidase with an alternative oxygen acceptor. Ann Clin Biochem. 1969; 6:24–27.
crossref
30. Lee S, Park HS, Kim SM, Kwon HS, Kim DY, Kim DJ, Cho GJ, Han JH, Kim SR, Park CY, Oh SJ, Lee CB, Kim KS, Oh SW, Kim YS, Choi WH, Woo HJ. Cut-off points of waist circumference for defining abdominal obesity in the Korean population. Korean J Obes. 2006; 15:1–9.
31. Paik HY, Kim CI, Moon HK, Yoon JS, Joung H, Shim JE, Jung HJ. 2008 Dietary Goals and Dietary Guidelines for Korean Adults. Korean J Nutr. 2008; 41:887–899.
32. Fogelholm M, Malmberg J, Suni J, Santtila M, Kyröläinen H, Mäntysaari M, Oja P. International physical activity questionnaire: validity against fitness. Med Sci Sports Exerc. 2006; 38:753–760. PMID: 16679993.
33. Craig CL, Marshall AL, Sjöström M, Bauman AE, Booth ML, Ainsworth BE, Pratt M, Ekelund U, Yngve A, Sallis JF, Oja P. International physical activity questionnaire: 12-country reliability and validity. Med Sci Sports Exerc. 2003; 35:1381–1395. PMID: 12900694.
crossref
34. Hosmer DW, Lemeshow S. Applied logistic regression. New York (NY): Wiley;2000.
35. Kim HJ, Choi I, Kim WG, Asano K, Hong J, Cho YM, Yoon J. Effect of a worksite-based dietary intervention program for the management of metabolic syndrome. Korean J Community Nutr. 2016; 21:237–246.
crossref
36. Bo S, Ciccone G, Baldi C, Benini L, Dusio F, Forastiere G, Lucia C, Nuti C, Durazzo M, Cassader M, Gentile L, Pagano G. Effectiveness of a lifestyle intervention on metabolic syndrome. A randomized controlled trial. J Gen Intern Med. 2007; 22:1695–1703. PMID: 17922167.
crossref
37. Aucott L, Gray D, Rothnie H, Thapa M, Waweru C. Effects of lifestyle interventions and long-term weight loss on lipid outcomes - a systematic review. Obes Rev. 2011; 12:e412–25. PMID: 21371252.
crossref
38. Ma Y, Olendzki BC, Wang J, Persuitte GM, Li W, Fang H, Merriam PA, Wedick NM, Ockene IS, Culver AL, Schneider KL, Olendzki GF, Carmody J, Ge T, Zhang Z, Pagoto SL. Single-component versus multicomponent dietary goals for the metabolic syndrome: a randomized trial. Ann Intern Med. 2015; 162:248–257. PMID: 25686165.
39. Mensink M, Blaak EE, Corpeleijn E, Saris WH, de Bruin TW, Feskens EJ. Lifestyle intervention according to general recommendations improves glucose tolerance. Obes Res. 2003; 11:1588–1596. PMID: 14694225.
crossref
40. Pettman TL, Buckley JD, Misan GM, Coates AM, Howe PR. Health benefits of a 4-month group-based diet and lifestyle modification program for individuals with metabolic syndrome. Obes Res Clin Pract. 2009; 3:221–235. PMID: 24973150.
crossref
41. Baudrand R, Campino C, Carvajal CA, Olivieri O, Guidi G, Faccini G, Vöhringer PA, Cerda J, Owen G, Kalergis AM, Fardella CE. High sodium intake is associated with increased glucocorticoid production, insulin resistance and metabolic syndrome. Clin Endocrinol (Oxf). 2014; 80:677–684. PMID: 23594269.
crossref
42. Räisänen JP, Silaste ML, Kesäniemi YA, Ukkola O. Increased daily sodium intake is an independent dietary indicator of the metabolic syndrome in middle-aged subjects. Ann Med. 2012; 44:627–634. PMID: 21679102.
crossref
43. Oh HY, Kim MK, Lee M, Kim YO. Macronutrient composition and sodium intake of diet are associated with risk of metabolic syndrome and hypertension in Korean women. PLoS One. 2013; 8:e78088. PMID: 24205105.
crossref
44. Lee WJ, Kim HC, Oh SM, Choi DP, Cho J, Suh I. Factors associated with a low-sodium diet: the Fourth Korean National Health and Nutrition Examination Survey. Epidemiol Health. 2013; 35:e2013005. PMID: 23807908.
crossref
45. Hong JW, Noh JH, Kim DJ. Factors associated with high sodium intake based on estimated 24-hour urinary sodium excretion: the 2009–2011 Korea National Health and Nutrition Examination Survey. Medicine (Baltimore). 2016; 95:e2864. PMID: 26945369.
46. Schroeder N, Park YH, Kang MS, Kim Y, Ha GK, Kim HR, Yates AA, Caballero B. A randomized trial on the effects of 2010 Dietary Guidelines for Americans and Korean diet patterns on cardiovascular risk factors in overweight and obese adults. J Acad Nutr Diet. 2015; 115:1083–1092. PMID: 26115560.
crossref
47. Song Y, Joung H. A traditional Korean dietary pattern and metabolic syndrome abnormalities. Nutr Metab Cardiovasc Dis. 2012; 22:456–462. PMID: 21215606.
crossref
48. Lee KW, Cho MS. The traditional Korean dietary pattern is associated with decreased risk of metabolic syndrome: findings from the Korean National Health and Nutrition Examination Survey, 1998–2009. J Med Food. 2014; 17:43–56. PMID: 24456354.
crossref
TOOLS
Similar articles